• Home
  • Tools dropdown img
    • Spreadsheet Charts

      • ChartExpo for Google Sheets
      • ChartExpo for Microsoft Excel
    • Power BI Charts

      • Power BI Custom Visuals by ChartExpo
    • Word Cloud

  • Charts dropdown img
    • Chart Category

      • Bar Charts
      • Circle Graphs
      • Column Charts
      • Combo Charts
      • Comparison Charts
      • Line Graphs
      • PPC Charts
      • Sentiment Analysis Charts
      • Survey Charts
    • Chart Type

      • Box and Whisker Plot
      • Clustered Bar Chart
      • Clustered Column Chart
      • Comparison Bar Chart
      • Control Chart
      • CSAT Survey Bar Chart
      • CSAT Survey Chart
      • Dot Plot Chart
      • Double Bar Graph
      • Funnel Chart
      • Gauge Chart
      • Likert Scale Chart
      • Matrix Chart
      • Multi Axis Line Chart
      • Overlapping Bar Chart
      • Pareto Chart
      • Radar Chart
      • Radial Bar Chart
      • Sankey Diagram
      • Scatter Plot Chart
      • Slope Chart
      • Sunburst Chart
      • Tornado Chart
      • Waterfall Chart
      • Word Cloud
    • Google Sheets
      Microsoft Excel
  • Services
  • Pricing
  • Contact us
  • Blog
  • Support dropdown img
      • Gallery
      • Videos
      • Contact us
      • FAQs
      • Resources
    • Please feel free to contact us

      atsupport@chartexpo.com

Categories
All Data Visualizations Data Analytics Surveys
Add-ons/
  • Google Sheets
  • Microsoft Excel
  • Power BI
All Data Visualizations Data Analytics Surveys
Add-ons
  • Google Sheets
  • Microsoft Excel
  • Power BI

We use cookies

This website uses cookies to provide better user experience and user's session management.
By continuing visiting this website you consent the use of these cookies.

Ok

ChartExpo Survey


Home > Blog > Data Analytics

Cash Flow Analysis Template: A Complete Guide

It might feel sudden, almost unexpected, but numbers tell their story whether you’re ready or not. Have you ever thought about how powerful a cash flow analysis template can be for your business?

Cash Flow Analysis Template

I will help you understand.

Tracking cash movement through a simple sheet can be the difference between growth and collapse. A well-structured cash flow analysis template makes trends visible. It shows if your daily operations are generating enough to cover expenses. It helps you see gaps before they become bigger problems. The question is not whether to analyze your cash flow. The question is whether you can afford not to.

Every finance team knows revenue can look great on paper, but without clarity on cash, trouble brews fast. Learning how to calculate operating cash flow is one of the first steps in spotting financial health. With the power of Google Sheets, your system updates, shares, scales, and grows alongside business success. No costly software. No unnecessary delays.

The smart companies already use structured tools to stay ahead. They review data regularly, adapt based on insights, and measure results in real time. A cash flow analysis template is not just a spreadsheet. It is a signal system for decision-making. If you want to start analyzing cash flow with accuracy and speed, this could be your simplest, smartest move yet.

Let’s get started.

Table of Contents:

  1. What is a Cash Flow Analysis Template in Google Sheets?
  2. Why is Using a Cash Flow Analysis Format Important in Google Sheets?
  3. When to Use Cash Flow Statement Analysis in Google Sheets?
  4. Examples of a Simple Cash Flow Template in Google Sheets
  5. How to Create a Projected Cash Flow Statement Template in Google Sheets?
  6. How to Do a Google Sheets Cash Flow Template Analysis?
  7. How to Download and Use the Cash Flow Analysis Template?
  8. Benefits of Cash Flow Statement Analysis in Google Sheets
  9. Best Practices of Cash Flow Analysis Template in Google Sheets
  10. FAQs
  11. Wrap Up

What is a Cash Flow Analysis Template in Google Sheets?

Definition: A cash flow analysis template in Google Sheets allows you to track money in and out with ease. It gives you clarity on whether your business generates enough cash to stay healthy. You can update it daily or weekly without needing any extra software. It also helps you connect short-term numbers with bigger targets.

Many teams use it with a monthly finance report to stay consistent. Others apply it when analyzing company financials for growth decisions. The template offers flexibility, scales as your business grows, while keeping your data organized. Most importantly, it helps you understand your numbers more easily.

Why is Using a Cash Flow Analysis Format Important in Google Sheets?

Managing money without a clear system can feel messy and uncertain. A cash flow analysis template in Google Sheets brings structure, speed, and insight to the way you review your finances.

Here is how;

  • Easy to use: Google Sheets is already familiar to most people, so there is no steep learning curve. You can start building a cash flow analysis template right away without extra costs.
  • Real-time updates: Edits appear instantly, keeping everyone on the same page. This saves time and prevents confusion in fast-moving situations.
  • Clear decision-making: The template simplifies cash flow analysis by organizing data in one place. You can quickly see if your operations generate enough to cover expenses.
  • Supports broader reviews: Pairing this template with a monthly finance report adds more depth to your review. You get both high-level insights and detailed breakdowns.
  • Prepares for growth: It helps measure progress against long-term financial goals. This makes it easier to decide when to invest, hire, or scale.

When to Use Cash Flow Statement Analysis in Google Sheets?

Business decisions are easier when you have the right numbers in front of you. A cash flow analysis template in Google Sheets can give you that clarity. It helps you spot strengths, weaknesses, and opportunities at the exact moment you need them.

Use it when:

  • Checking operations: You can start learning how to calculate operating cash flow. This confirms whether your daily activities generate enough money to cover costs.
  • Reviewing performance: It becomes valuable during a financial performance analysis. You can compare past periods and see if your strategies are truly paying off.
  • Planning: Turn to it while setting long-term financial goals as examples. The insights show if you can expand, invest, or save without putting the business at risk.
  • Linking statements: This template also fits well in 3-statement financial modeling. By connecting cash flow with income statements and balance sheets, you gain a complete financial picture.

Examples of a Simple Cash Flow Template in Google Sheets

Sometimes the simplest tools make the biggest difference. A cash flow analysis template in Google Sheets can separate your numbers into clear categories. This structure makes it easier to read, update, and use in decisions. It also gives you a starting point for how to prepare financial statement reviews for your team. Whether you use direct or indirect cash flow, the format remains easy to follow.

  • Operating activities: This section tracks cash flow from core business operations like sales and expenses. It indicates whether your daily activities are sustainable or not.
  • Investing activities: Record spending on assets or returns from investments here. These activities reflect long-term choices that shape the future of your business.
  • Financing activities: This covers money from loans, equity, or dividend payments. It shows how you fund growth and handle obligations to lenders or investors.

How to Create a Projected Cash Flow Statement Template in Google Sheets?

Seeing your financial future on a single sheet can change the way you plan. A projected cash flow statement in Google Sheets makes this possible. It helps you anticipate challenges, prepare for growth, and stay in control of your money.

Here’s how to create one:

  1. Set up your timeline: Create columns for each month across the top of the sheet. This makes it easy to track cash movement over time.
  2. List cash inflows and outflows: List all expected income and expenses. Separating them keeps the flow of money clear.
  3. Organize by activities: Include operating, investing, and financing categories. This structure mirrors formal cash flow statements and simplifies review.
  4. Use formulas for totals: Automate totals with simple formulas. This reduces errors and saves time as your sheet updates automatically.
  5. Add a summary row: Add a row for net cash flow each month. It shows instantly if you face a deficit or surplus.
  6. Review and adjust regularly: Update the sheet as assumptions change. A projected cash flow analysis template should always reflect your latest expectations.

How to Do a Google Sheets Cash Flow Template Analysis?

Cash can easily go unnoticed without careful monitoring. This is where a cash flow analysis Template becomes essential. While tracking numbers provides data, interpreting those figures is the real challenge. This is where data visualization flexes its muscles. It is crucial in analysis, as charts convey insights that numbers alone cannot.

Google Sheets handles basic graphs and charts, but its options are limited and often lack visual impact.

We have a solution: ChartExpo. This tool enhances your cash flow data with powerful, clear, and engaging visuals. Try ChartExpo today to transform your cash flow analysis and see your data in a whole new way.

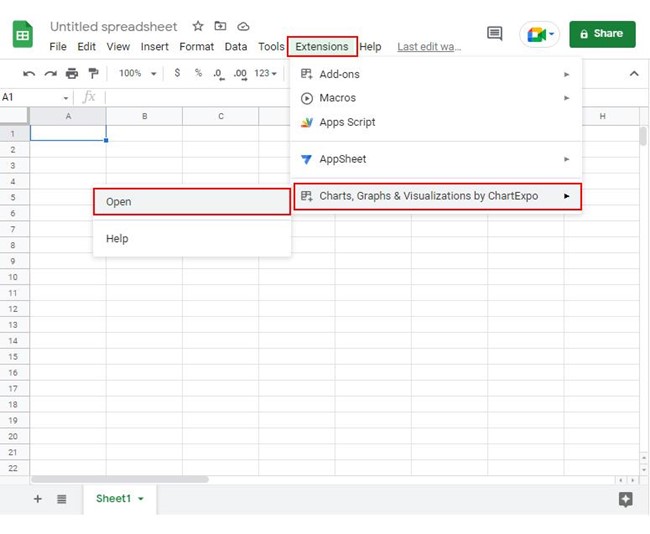
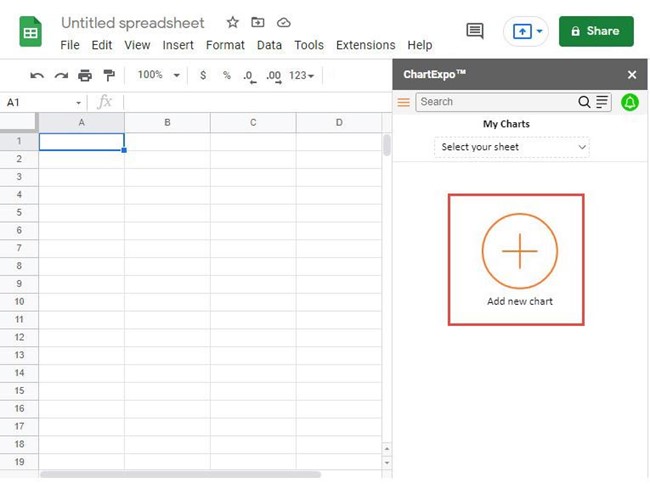
How to Install ChartExpo in Google Sheets?

  1. To start using ChartExpo, download it directly from the Google Sheets program. To do this, select Extensions from the top toolbar.
  2. A menu will appear. Click the Get add-ons option.
  3. Search for ChartExpo, and click on Charts, Graphs & Visualizations by ChartExpo when it appears in the results.
  4. Click the Install button. You will have to confirm your Google account and accept some permissions.

ChartExpo charts are available both in Google Sheets and Microsoft Excel. Please use the following CTAs to install the tool of your choice and create beautiful visualizations in a few clicks in your favorite tool.

Example

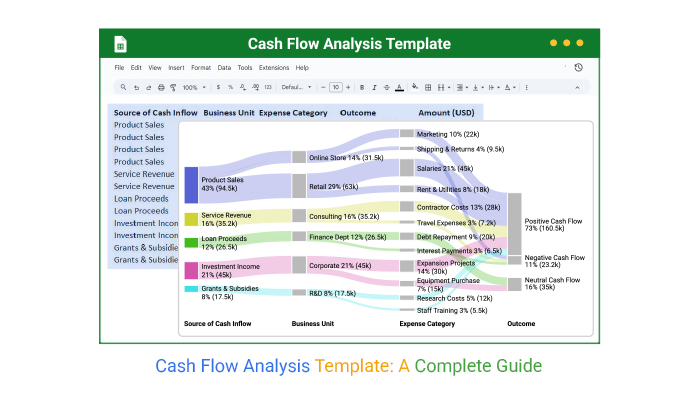
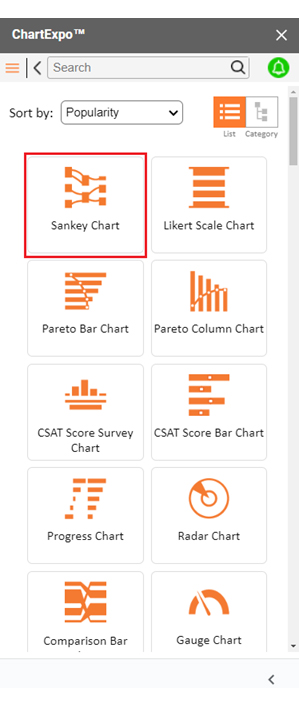
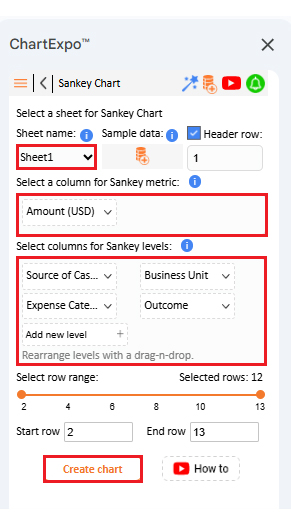
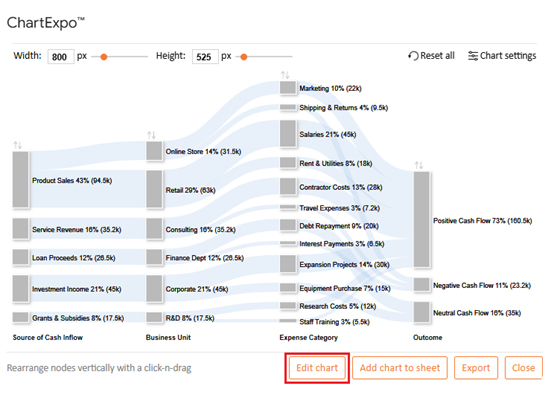
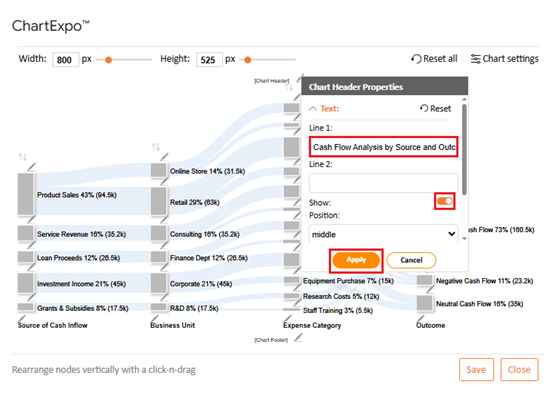
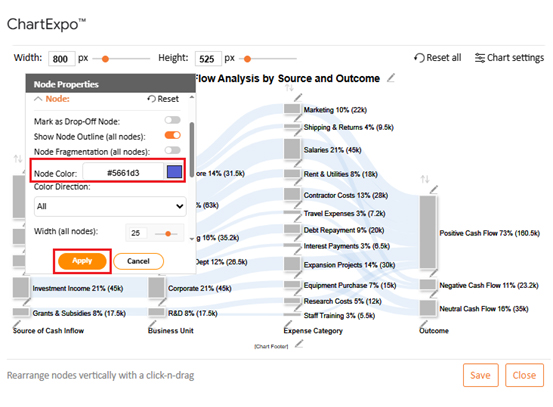
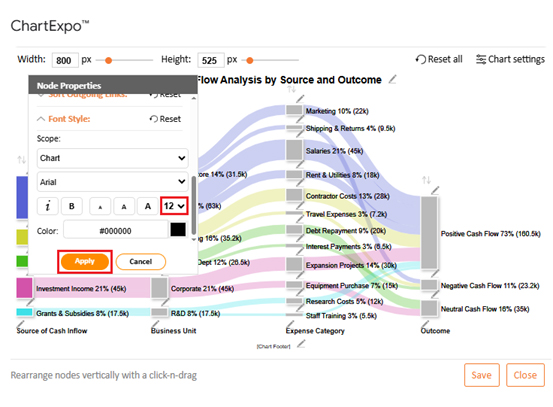
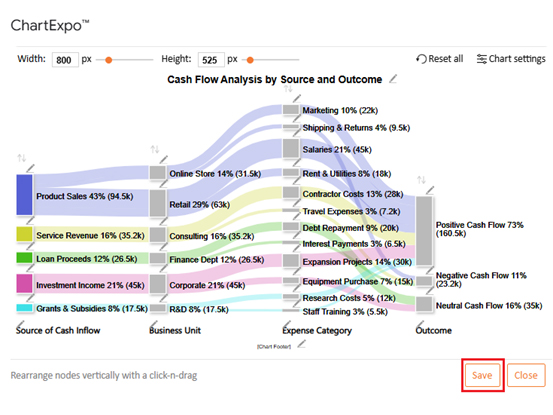
Let’s analyze this sample data in Google Sheets using ChartExpo and visualize the flow with a Sankey chart.

Source of Cash Inflow Business Unit Expense Category Outcome Amount (USD)
Product Sales Retail Salaries Positive Cash Flow 45,000
Product Sales Retail Rent & Utilities Positive Cash Flow 18,000
Product Sales Online Store Marketing Positive Cash Flow 22,000
Product Sales Online Store Shipping & Returns Negative Cash Flow 9,500
Service Revenue Consulting Contractor Costs Positive Cash Flow 28,000
Service Revenue Consulting Travel Expenses Negative Cash Flow 7,200
Loan Proceeds Finance Dept Debt Repayment Neutral Cash Flow 20,000
Loan Proceeds Finance Dept Interest Payments Negative Cash Flow 6,500
Investment Income Corporate Expansion Projects Positive Cash Flow 30,000
Investment Income Corporate Equipment Purchase Neutral Cash Flow 15,000
Grants & Subsidies R&D Research Costs Positive Cash Flow 12,000
Grants & Subsidies R&D Staff Training Positive Cash Flow 5,500
  • To get started with ChartExpo, install ChartExpo in Google Sheets.
  • Go to Extensions > Charts, Graphs & Visualizations by ChartExpo > Open.
Cash Flow Analysis Template
  • To access the charts library, click the Add new chart button.
Cash Flow Analysis Template
  • Once ChartExpo is loaded. Click on “Sankey Chart”.
Cash Flow Analysis Template
  • Put the data table in the sheet first. Then, choose the Sheet name from the drop-down in the ChartExpo section.
  • Select the metric column; metric is the numeric column in your data sheet.
  • Select the dimensions column; the dimension is the categorical column in your datasheet that contains text information.
  • Click the Create chart button to complete the process.
Cash Flow Analysis Template
  • ChartExpo will generate the visualization below for you.
Cash Flow Analysis Template
  • If you want to have the chart’s title, click Edit Chart, as shown in the above image.
  • Click the pencil icon next to the Chart Header to change the title.
  • It will open the properties dialog. Under the Text section, you can add a heading in Line 1 and enable Show.
  • Give the appropriate title of your chart and click the Apply button.
Cash Flow Analysis Template
  • You can add color in Nodes and set the direction as follows:
Cash Flow Analysis Template
  • You can increase font size for better readability as follows:
Cash Flow Analysis Template
  • Click the “Save Changes” button to persist the changes.
Cash Flow Analysis Template
  • Your final chart will appear as follows.
Cash Flow Analysis Template

Insights

  • Product sales make up the largest inflows at 43%, driven by both retail and online units.
  • Positive cash flow dominates at 73%, showing strong liquidity, while 11% negative flows signal areas of concern.
  • Shipping and returns (9.5K) plus interest payments (6.5K) are the key drains on efficiency.
  • Investment income from expansion projects supports long-term corporate growth.

How to Download and Use the Cash Flow Analysis Template?

Manage your money more easily with the right tools. Use a cash flow analysis template to save time, reduce errors, and get instant clarity. Download and start using one in Google Sheets in just a few steps:

  1. Find a reliable template: Choose a trusted source for a ready-to-use cash flow analysis template. Verify it suits your business needs and includes all key categories.
  2. Download and open in Google Sheets: Save the file and upload it to your Google Drive. Open it in Google Sheets to start working right away.
  3. Customize categories: Adjust income and expense categories to reflect your operations. This makes the template relevant to your specific situation.
  4. Enter your data: Add cash inflows and outflows regularly. Consistent updates ensure accurate analysis of cash flow results.
  5. Review and visualize: Check totals and apply a Waterfall chart or other advanced chart for clear breakdowns of financial changes. This helps with decision-making and strengthens your financial performance analysis.

Benefits of Cash Flow Statement Analysis in Google Sheets

Numbers can be overwhelming until they are organized into something meaningful. That is exactly what a cash flow statement analysis in Google Sheets does. It takes raw figures and turns them into insights that guide smarter business choices.

  • Easy access: Google Sheets is free and cloud-based. You can view or update your cash flow analysis template from anywhere.
  • Better understanding: It makes analyzing cash flow straightforward by breaking numbers into clear categories. This helps you see whether your operations are truly sustainable.
  • Informed decisions: The template supports financial performance analysis example reviews. It gives leaders accurate data before making key business moves.
  • Supports planning: Cash flow analysis connects short-term numbers with long-term financial goals. This ensures growth strategies are based on realistic projections.
  • Collaboration made simple: Multiple users can access and update the same sheet. This keeps finance teams aligned without endless email updates.

Best Practices of Cash Flow Analysis Template in Google Sheets

Good cash flow management is less about luck and more about discipline. A cash flow analysis template in Google Sheets becomes far more powerful when you follow the best practices. With the right habits, your sheet turns into a decision-making tool rather than a static report:

  • Keep data updated: Record inflows and outflows regularly. Fresh numbers make analyzing cash flow more accurate.
  • Use clear categories: Separate operating, investing, and financing activities. This mirrors formal reporting and simplifies how to prepare financial statement reviews.
  • Automate where possible: Rely on formulas to calculate totals and balances. This saves time and reduces the likelihood of human error.
  • Compare across periods: Review monthly or quarterly trends. This supports a stronger financial performance analysis and reveals long-term patterns.
  • Link with goals: Tie the analysis to long-term financial goals, examples. This ensures your cash flow supports bigger business strategies.

FAQs

Does Google Sheets have a cash flow template?

Yes, Google Sheets offers free templates. You can find them in the template gallery. They include simple cash flow formats that are customizable. A cash flow analysis template helps in analyzing cash flow quickly.

How to make a cash flow diagram in Google Sheets?

  • Enter inflows and outflows in a table.
  • Highlight the data.
  • Go to Insert and pick a Chart.
  • Choose a bar or line chart.
  • Adjust labels and titles.
  • Use it for a financial performance analysis.

Wrap Up

Cash flow reveals the true story behind your numbers. A cash flow analysis template in Google Sheets makes that story clear by organizing data into actionable insights.

This organization goes beyond clarity. Templates simplify tracking, saving time and reducing mistakes. They also help you compare direct vs. indirect cash flow for a clearer understanding of both methods.

To make data even clearer, visualization matters. Rows of numbers can feel flat and confusing. That is why charts help bring the data to life. Clear visuals make a financial performance analysis example easier to explain to your team.

Beyond immediate tracking and insight, templates also connect to bigger goals. They give you the first step in learning how to prepare financial statement reviews. With consistent tracking, you can connect short-term results with long-term strategies.

However, while Google Sheets is a great starting point, it has limits. Its charts are basic and do not always show the depth you need. That is where ChartExpo becomes important—it adds professional visuals that tell the story quickly and clearly.

With these tools in mind, now is the best time to take action. Start with a template in Google Sheets. Then install ChartExpo to bring your analysis to life. Your numbers are waiting to be seen in full color.

How much did you enjoy this article?

ExcelAd1
Start Free Trial!
158070

Related articles

next previous
Data Analytics12 min read

Cap Table Template: Simplifying Equity Analysis

A cap table template tracks ownership and dilution. This blog shows how to create, analyze, and visualize cap tables in Google Sheets for better decisions.

Data Analytics14 min read

Visual Encoding: The Rules That Improve Insights

Visual encoding converts complex data into visuals that are simple to read. It uses color, size, shape, and position to reveal trends, comparisons, and insights.

Data Analytics15 min read

Operational Reporting for Data-Driven Operations

Operational Reporting tracks daily performance with real-time data. Discover its benefits, examples, and Power BI tips to make smarter business decisions.

Data Analytics12 min read

Startup Financial Model: A Visual Approach

A startup financial model helps founders plan revenue, expenses, and cash flow. This guide shows how to create, analyze, and visualize your model.

Data Analytics12 min read

Restaurant Profit and Loss Template for Data Insights

A Restaurant Profit and Loss Template shows income and costs. Learn how to create, use, and analyze it in Excel to make smarter decisions and boost profits.

ChartExpo logo

Turn Data into Visual
Stories

CHARTEXPO

  • Home
  • Gallery
  • Videos
  • Services
  • Pricing
  • Contact us
  • FAQs
  • Privacy policy
  • Terms of Service
  • Sitemap

TOOLS

  • ChartExpo for Google Sheets
  • ChartExpo for Microsoft Excel
  • Power BI Custom Visuals by ChartExpo
  • Word Cloud

CATEGORIES

  • Bar Charts
  • Circle Graphs
  • Column Charts
  • Combo Charts
  • Comparison Charts
  • Line Graphs
  • PPC Charts
  • Sentiment Analysis Charts
  • Survey Charts

TOP CHARTS

  • Sankey Diagram
  • Likert Scale Chart
  • Comparison Bar Chart
  • Pareto Chart
  • Funnel Chart
  • Gauge Chart
  • Radar Chart
  • Radial Bar Chart
  • Sunburst Chart
  • see more
  • Scatter Plot Chart
  • CSAT Survey Bar Chart
  • CSAT Survey Chart
  • Dot Plot Chart
  • Double Bar Graph
  • Matrix Chart
  • Multi Axis Line Chart
  • Overlapping Bar Chart
  • Control Chart
  • Slope Chart
  • Clustered Bar Chart
  • Clustered Column Chart
  • Box and Whisker Plot
  • Tornado Chart
  • Waterfall Chart
  • Word Cloud
  • see less

RESOURCES

  • Blog
  • Resources
  • YouTube
SIGN UP FOR UPDATES

We wouldn't dream of spamming you or selling your info.

© 2026 ChartExpo, all rights reserved.