• Home
  • Tools dropdown img
    • Spreadsheet Charts

      • ChartExpo for Google Sheets
      • ChartExpo for Microsoft Excel
    • Power BI Charts

      • Power BI Custom Visuals by ChartExpo
    • Word Cloud

  • Charts dropdown img
    • Chart Category

      • Bar Charts
      • Circle Graphs
      • Column Charts
      • Combo Charts
      • Comparison Charts
      • Line Graphs
      • PPC Charts
      • Sentiment Analysis Charts
      • Survey Charts
    • Chart Type

      • Box and Whisker Plot
      • Clustered Bar Chart
      • Clustered Column Chart
      • Comparison Bar Chart
      • Control Chart
      • CSAT Survey Bar Chart
      • CSAT Survey Chart
      • Dot Plot Chart
      • Double Bar Graph
      • Funnel Chart
      • Gauge Chart
      • Likert Scale Chart
      • Matrix Chart
      • Multi Axis Line Chart
      • Overlapping Bar Chart
      • Pareto Chart
      • Radar Chart
      • Radial Bar Chart
      • Sankey Diagram
      • Scatter Plot Chart
      • Slope Chart
      • Sunburst Chart
      • Tornado Chart
      • Waterfall Chart
      • Word Cloud
    • Google Sheets
      Microsoft Excel
  • Services
  • Pricing
  • Contact us
  • Blog
  • Support dropdown img
      • Gallery
      • Videos
      • Contact us
      • FAQs
      • Resources
    • Please feel free to contact us

      atsupport@chartexpo.com

Categories
All Data Visualizations Data Analytics Surveys
Add-ons/
  • Google Sheets
  • Microsoft Excel
  • Power BI
All Data Visualizations Data Analytics Surveys
Add-ons
  • Google Sheets
  • Microsoft Excel
  • Power BI

We use cookies

This website uses cookies to provide better user experience and user's session management.
By continuing visiting this website you consent the use of these cookies.

Ok

ChartExpo Survey


Home > Blog > Microsoft Excel

Excel for Accounting and Finance: A Complete Walkthrough

Excel in accounting and finance—isn’t it the most underrated powerhouse in business operations?

Excel for Accounting and Finance

Spreadsheets do more than track income and expenses. They support decisions, help small business owners spot cash flow issues early, and help accountants create accurate reports.

Using Excel in accounting and finance isn’t new, but using it well can change everything. Excel tools streamline operations, reduce human error, and save time.

Numbers tell a story. Excel helps you read it. You can build a custom finance dashboard in Excel to monitor real-time performance. Or prepare a monthly finance report that enables you to act, not guess.

Many businesses rely on outdated or disconnected systems. Excel bridges that gap. It provides clarity and structure, and when used correctly, it reveals patterns others miss.

And the best part? You already have it on your desktop.

Excel is essential for managing accounts receivable, tracking budget variances, and preparing end-of-month statements. It gives you control, makes finance more visual, and supports smarter choices.

This isn’t about being an Excel wizard. It’s about working smarter with what you already have. Because managing money doesn’t have to be complicated, and understanding it shouldn’t be reserved for accountants.

Let’s dive in.

Table of Contents:

  1. How to Use Excel for Accounting?
  2. How to Use Excel for Finance?
  3. What are Excel Skills for Accounting and Finance?
  4. How to Analyze Accounting and Finance Data in Excel?
  5. Best Practices for Excel in Accounting and Finance
  6. Limitations of Microsoft Excel for Accounting and Finance
  7. FAQs
  8. Wrap Up

How to Use Excel for Accounting?

Do you think Excel is only suitable for number crunching? Think again. Why? You can build a complete accounting system without buying expensive software. Excel gives you control, clarity, and flexibility. Whether you’re a freelancer or running a growing business, you can do more with less.

Let’s walk through how to use Excel for accounting—step by step:

  1. Create a chart of accounts: Make a list of all account categories your business uses — assets, liabilities, income, expenses
  2. ses, and equity. This setup organizes records and maintains the Excel bookkeeping for a small business, keeping them clean and up to date.
  3. Record transactions: Record every sale, purchase, and payment with clear identification information like date, description, amount, and account. This will make your records easy to audit and prepare your data for analysis.
  4. Make journals and ledgers: Use the system journal to record transactions as they occur in double-entry bookkeeping. Post those entries to the ledgers on which you can foot balances by account.
  5. Perform bank reconciliations: To spot differences, compare your recorded transactions with your bank statement. Excel formulas help flag missing or duplicated entries so your books stay accurate.
  6. Generate financial statements: Use formulas to link your trial balance to automated income statements and balance sheets. This saves time and makes sharing reliable monthly finance report data easier.
  7. Use Pivot Tables and charts: PivotTables let you quickly group and filter large financial data sets by category. Then, financial graphs and charts in Excel help spot trends and communicate insights visually.
  8. Automate with macros: Record simple macros to automate repeated tasks like formatting, copying data, or generating reports. Macros save hours and reduce the risk of human error in your workflows.

How to Use Excel for Finance?

Excel isn’t flashy. But it’s powerful. And if you manage money, you need it. Excel makes finance faster, more precise, and more accurate. From planning budgets to forecasting revenue, it helps you take control.

Follow these to use Excel for finance the right way.

  1. Budgeting and forecasting: Create monthly budgets with projected income and expenditures and live formulas for tracking. Excel allows you to compare actuals vs. forecasts, helping you catch overspending before it gets out of hand.
  2. Financial modeling: Connect variables and formulas to develop models to test scenarios, such as changes in prices or increases in costs. Excel lets you analyze and compare economic profit and accounting profit to make smarter business choices.
  3. Data analysis and visualization: Leverage filters, functions, and pivot tables to help analyze and visualize financial data. Develop concise financial charts in Excel to track trends, highlight concerns, and improve your reports.
  4. Investment analysis: Track investment performance, calculate returns, and analyze risk metrics like standard deviation or IRR. Excel gives you the tools to monitor performance and adjust your investment strategy efficiently.
  5. Dashboard reporting: Build a finance dashboard in Excel with linked cells, charts, and conditional formatting. Dashboards offer fast, visual insight into cash flow, revenue, and expenses—perfect for quick reviews or board meetings.

What are Excel Skills for Accounting and Finance?

You don’t need to be a spreadsheet wizard to succeed in finance, but you need the right skills. Excel isn’t about looking busy but getting real insights fast. These core Excel skills for accounting and finance will help you cut hours off your workload. Moreover, they will support you to deliver cleaner, more brilliant results every time.

  • Data entry and formatting: Enter information using drop-downs, data validation, and consistent number formatting to reduce input errors. Clean, structured data is essential for creating reliable bookkeeping spreadsheets and financial reports for small businesses.
  • Pivot tables and charts: PivotTables let you instantly group, filter, and summarize large datasets. Pair them with financial graphs and charts in Excel to present your data in ways people understand.
  • Financial modeling: Use Excel to build dynamic models that test different business scenarios and outcomes. Great models help you compare results like economic profit vs. accounting profit with simple tweaks to key assumptions.
  • Auditing and error checking: Spot errors fast using tools like Trace Precedents, Evaluate Formula, and Conditional Formatting. These features protect your work and make your monthly financial report more trustworthy.
  • Automation with macros: Macros can handle repetitive tasks like formatting, sorting, or generating reports. A few clicks will save hours, improve consistency, and reduce the risk of manual mistakes.

How to Analyze Accounting and Finance Data in Excel?

Excel is excellent—until it isn’t. Sure, it crunches numbers and tracks transactions like a pro. But when is the time to see the story behind the numbers? Not so smooth. Creating insightful visuals in Excel often feels like wrestling with a graph that doesn’t listen. That’s a problem, mainly when good data analysis depends on sharp, clear data visualization.

Enter ChartExpo. It turns dull spreadsheets into dynamic visuals—without the usual chart chaos. It fills the gap Excel leaves behind.

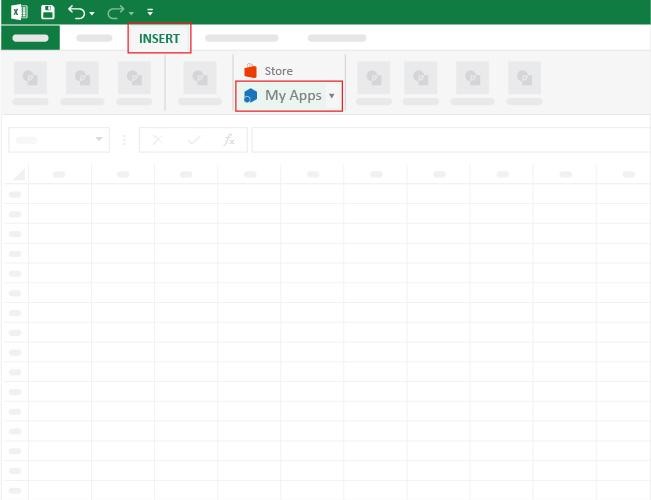
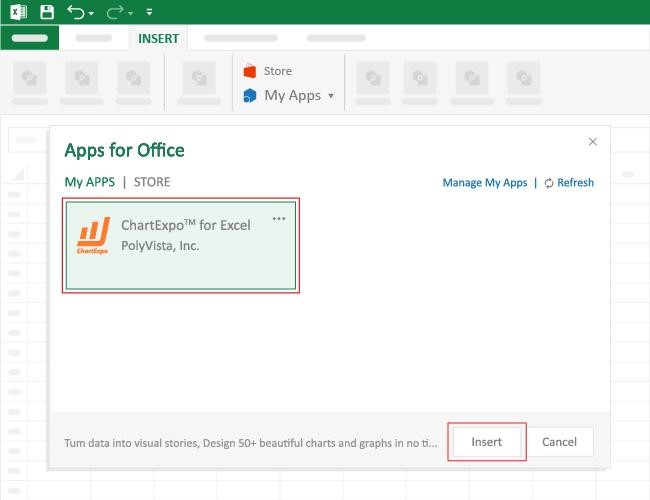
How to Install ChartExpo in Excel?

  1. Open your Excel application.
  2. Open the worksheet and click the “Insert” menu.
  3. You’ll see the “My Apps” option.
  4. In the Office Add-ins window, click “Store” and search for ChartExpo on my Apps Store.
  5. Click the “Add” button to install ChartExpo in your Excel.

ChartExpo charts are available both in Google Sheets and Microsoft Excel. Please use the following CTAs to install the tool of your choice and create beautiful visualizations with a few clicks in your favorite tool.

Example

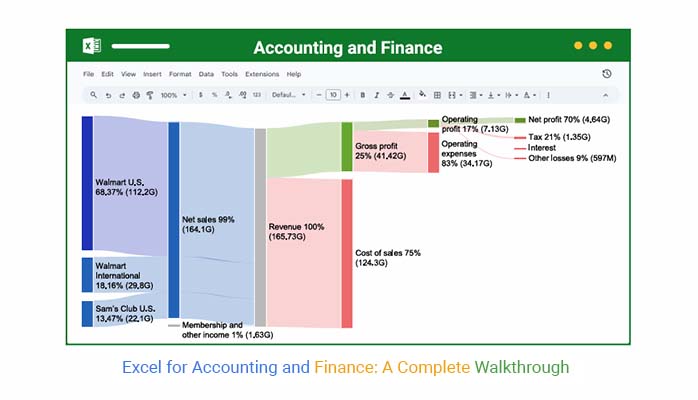
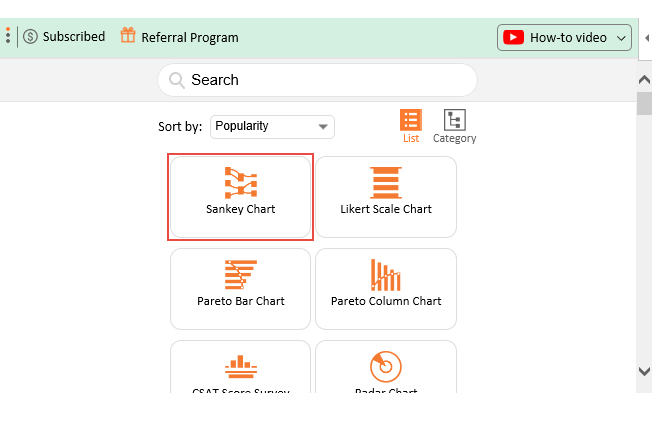
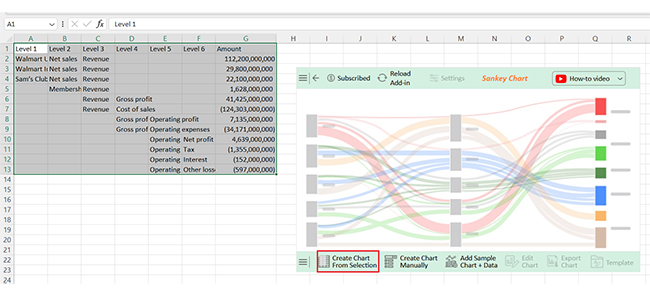
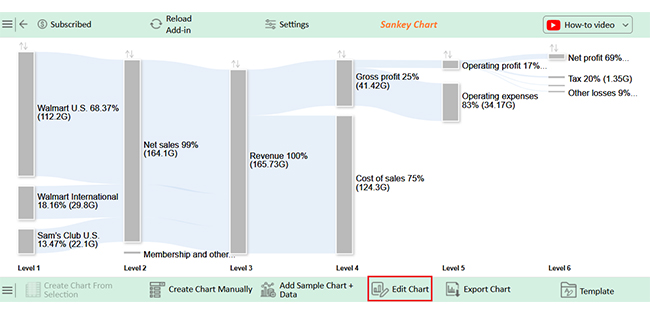
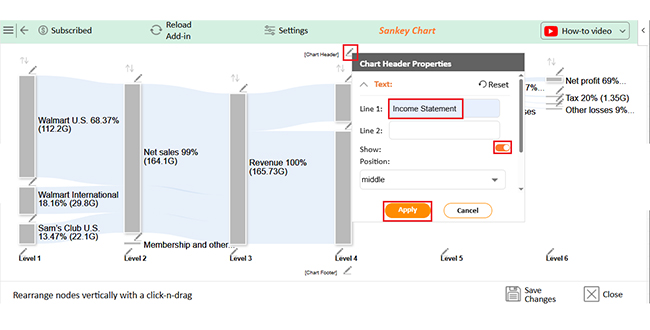
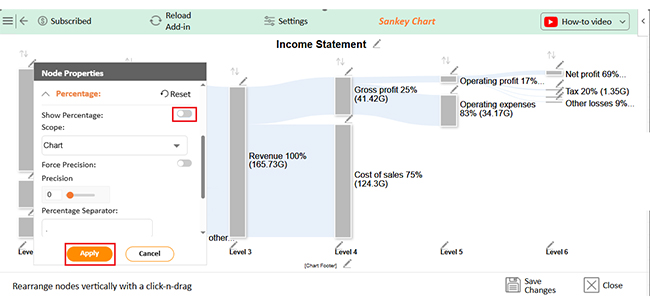
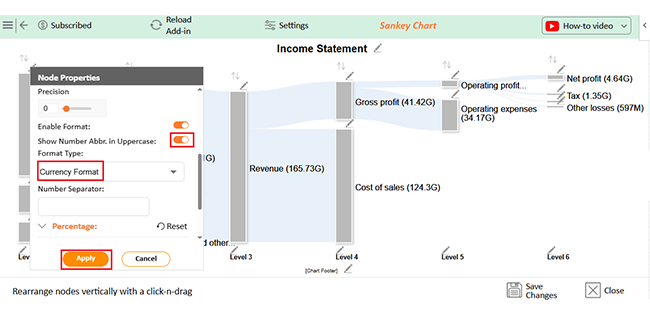
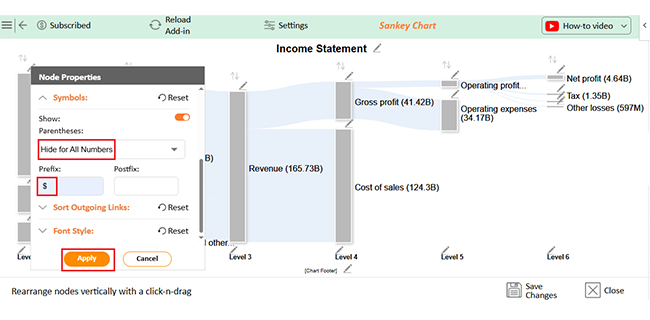
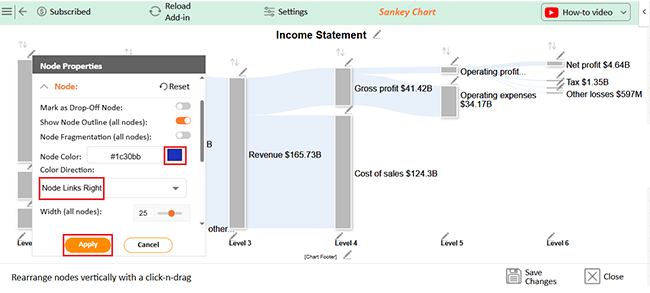
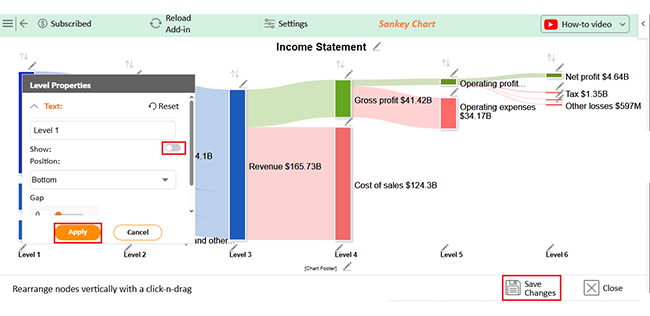
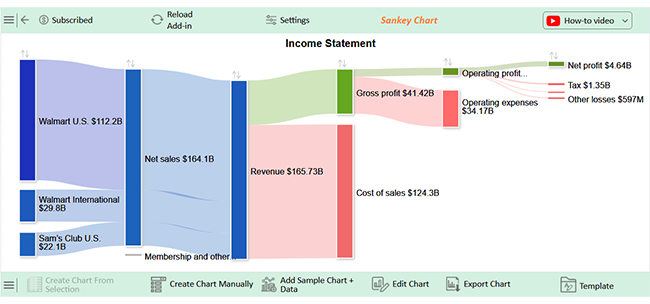
Let’s analyze this sample data in Excel using ChartExpo.

Level 1 Level 2 Level 3 Level 4 Level 5 Level 6 Amount
Walmart U.S. Net sales Revenue 112,200,000,000
Walmart International Net sales Revenue 29,800,000,000
Sam’s Club U.S. Net sales Revenue 22,100,000,000
Membership and other income Revenue 1,628,000,000
Revenue Gross profit 41,425,000,000
Revenue Cost of sales -124,303,000,000
Gross profit Operating profit 7,135,000,000
Gross profit Operating expenses -34,171,000,000
Operating profit Net profit 4,639,000,000
Operating profit Tax -1,355,000,000
Interest -152,000,000
Operating profit Other losses -597,000,000
  • To get started with ChartExpo, install ChartExpo in Excel.
  • Now, click on My Apps from the INSERT menu.
Excel for Accounting and Finance
  • Choose ChartExpo from My Apps, then click Insert.
Excel for Accounting and Finance
  • Once it loads, choose the “Sankey Chart” from the charts list.
Excel for Accounting and Finance
  • Click the “Create Chart From Selection” button after selecting the data from the sheet, as shown.
Excel for Accounting and Finance
  • ChartExpo will generate the visualization below for you.
Excel for Accounting and Finance
  • If you want to have the chart’s title, click Edit Chart, as shown in the above image.
  • Click the pencil icon next to the Chart Header to change the title.
  • It will open the properties dialog. Under the Text section, you can add a heading in Line 1 and enable Show.
  • Give the appropriate title of your chart and click the Apply button.
Excel for Accounting and Finance
  • You can disable the percentage button as follows:
Excel for Accounting and Finance
  • Change the Format Type and disable the upper case as follows:
Excel for Accounting and Finance
  • You can add a dollar sign as follows:
Excel for Accounting and Finance
  • You can add the color in Nodes and set the direction as follows:
Excel for Accounting and Finance
  • Click the “Save Changes” button to persist the changes.
Excel for Accounting and Finance
  • Your final chart will appear as below.
Excel for Accounting and Finance

Insights

  • Walmart U.S. leads revenue with $112.2 billion in total sales.
  • Gross profit is strong at $ 41.4 B.
  • High operating expenses of $34.2B significantly cut into profits.
  • Net profit is $4.64B after taxes, interest, and other costs.
  • This data reflects efficient operations but tight margins despite large sales volumes.

Best Practices for Excel in Accounting and Finance

Excel can be your best asset—or your most significant risk. It depends on how you use it. Sloppy sheets lead to errors, confusion, and hours of rework. But smart habits can turn a basic spreadsheet into a powerful financial tool. Here are the best practices to get the most out of Excel in accounting and finance:

  • Stay structured: Organize your data in a clear, logical format. Clean layouts make your spreadsheets more straightforward to read, navigate, and troubleshoot.
  • Think in tables: Use Excel Tables and named ranges instead of plain cells. They auto-adjust with your data and make formulas more flexible and readable.
  • Format with purpose: Consistent formatting—like aligned text, uniform colors, and proper number styles—helps highlight key figures and improves readability across teams.
  • Build smart, not hard: Avoid hardcoding values into formulas. Use dynamic formulas so your sheets update automatically when data changes. This saves time and reduces errors.
  • Protect and review: Always password-protect sensitive data and regularly audit your formulas. Also, keep backup copies and track versions to avoid costly mistakes.

Limitations of Microsoft Excel for Accounting and Finance

Excel is powerful—but it’s not perfect. For all its strengths, it has real limits, especially in high-pressure finance roles. I know you’ve probably hit some roadblocks if you manage a growing business or handle complex reports. Here’s where Excel falls short in accounting and finance.

  • Error-prone manual entry: One wrong keystroke can throw off an entire monthly finance report. Without built-in checks or guardrails, Excel relies too much on human accuracy, where mistakes slip through.
  • Lack of real-time collaboration: Two people editing the same file? That’s a recipe for disaster. Excel isn’t built for multiple users who are updating sensitive financials simultaneously.
  • Limited audit trails: Want to know who changed what and when? Excel doesn’t log detailed histories. That makes it harder to backtrack on errors or review changes during financial analysis reports.
  • Scalability issues: As data grows, spreadsheets slow down. Big files lag and crash, especially when tracking KPIs or calculating Accounts Receivable Turnover over the years.
  • Security concerns: Passwords help, but Excel isn’t built for high-level financial security. Anyone with access can make changes or copy confidential data without much oversight.
  • Lack of integration: Excel doesn’t sync easily with other accounting or ERP systems. Without integration, you’re left copying data manually instead of building a connected Excel finance dashboard.

FAQs

What is the most used Excel function in accounting?

The sum function is the most used. It quickly adds totals for transactions, expenses, or revenue. Accountants rely on it daily to simplify large datasets. It’s fast, accurate, and essential for clean bookkeeping spreadsheets for small businesses.

How can Excel be used in finance?

Excel tracks budgets, forecasts revenue, and models scenarios. It calculates ROI and builds dashboards. You can analyze trends and calculate the accounts receivable turnover ratio. It’s also used to prepare statements and make complex financial data clear and actionable.

Wrap Up

Excel is more than rows and columns. It’s a powerful tool for everyday accounting. From tracking transactions to building financial reports, it keeps your data organized.

You can use Excel to prepare reports on Financial analysis. It helps you compare revenue, expenses, and profit across periods. With formulas and charts, trends become easier to spot.

Excel is a great place to start if you’re learning how to analyze financial statements. It lets you break down balance sheets, income statements, and cash flow. You can easily trace, calculate, and visualize each number.

Tracking performance is also easier with KPIs for accounting. You can build templates to monitor metrics like net profit margin or days’ sales outstanding. Excel helps you see if you’re on target.

Moreover, charts and dashboards turn raw numbers into insights. Clear formatting and layout make your reports easier to read and explain, and good visuals lead to better decisions.

Excel clarifies your accounting work. Use it well, and it becomes more than software—it becomes your daily advantage. To visualize data effortlessly, install ChartExpo and unlock powerful charting tools.

How much did you enjoy this article?

ExcelAd2
Start Free Trial!
155008

Related articles

next previous
Microsoft Excel12 min read

How to Create Sankey Diagram in Excel? Easy Steps

Create your own Sankey Diagram in Excel with simple steps. This guide shows you how to build, format, and customize a professional flow chart without coding.

Microsoft Excel12 min read

Excel Online Worksheet: A Complete Walkthrough

An Excel online worksheet is a browser-based spreadsheet you can access anywhere. Click here to learn how to edit, chart, share, and manage data online.

Microsoft Excel8 min read

How to Install Excel Add-ins: A Step-by-Step Guide

Learn how to install Excel add-ins to enhance your spreadsheet functionality. This blog covers steps, tips, and visuals to boost data analysis and charting.

Microsoft Excel13 min read

Project Management Dashboard in Excel for Fast Analysis

A project management dashboard in Excel tracks tasks, timelines, and budgets. Click here to discover top templates and tips to build and manage your own.

Microsoft Excel10 min read

Budget vs. Actual Excel Template: Insights Made Simple

A budget vs. actual Excel template compares planned vs. actual spending. Click here to learn how to create, use, and analyze it for better financial decisions.

ChartExpo logo

Turn Data into Visual
Stories

CHARTEXPO

  • Home
  • Gallery
  • Videos
  • Services
  • Pricing
  • Contact us
  • FAQs
  • Privacy policy
  • Terms of Service
  • Sitemap

TOOLS

  • ChartExpo for Google Sheets
  • ChartExpo for Microsoft Excel
  • Power BI Custom Visuals by ChartExpo
  • Word Cloud

CATEGORIES

  • Bar Charts
  • Circle Graphs
  • Column Charts
  • Combo Charts
  • Comparison Charts
  • Line Graphs
  • PPC Charts
  • Sentiment Analysis Charts
  • Survey Charts

TOP CHARTS

  • Sankey Diagram
  • Likert Scale Chart
  • Comparison Bar Chart
  • Pareto Chart
  • Funnel Chart
  • Gauge Chart
  • Radar Chart
  • Radial Bar Chart
  • Sunburst Chart
  • see more
  • Scatter Plot Chart
  • CSAT Survey Bar Chart
  • CSAT Survey Chart
  • Dot Plot Chart
  • Double Bar Graph
  • Matrix Chart
  • Multi Axis Line Chart
  • Overlapping Bar Chart
  • Control Chart
  • Slope Chart
  • Clustered Bar Chart
  • Clustered Column Chart
  • Box and Whisker Plot
  • Tornado Chart
  • Waterfall Chart
  • Word Cloud
  • see less

RESOURCES

  • Blog
  • Resources
  • YouTube
SIGN UP FOR UPDATES

We wouldn't dream of spamming you or selling your info.

© 2025 ChartExpo, all rights reserved.