Categories
To measure happiness, you have to assess emotional well-being, life satisfaction, and overall contentment. The methods used for this process include self-reports, surveys, and evaluating factors like relationships, physical health, and work-life balance.


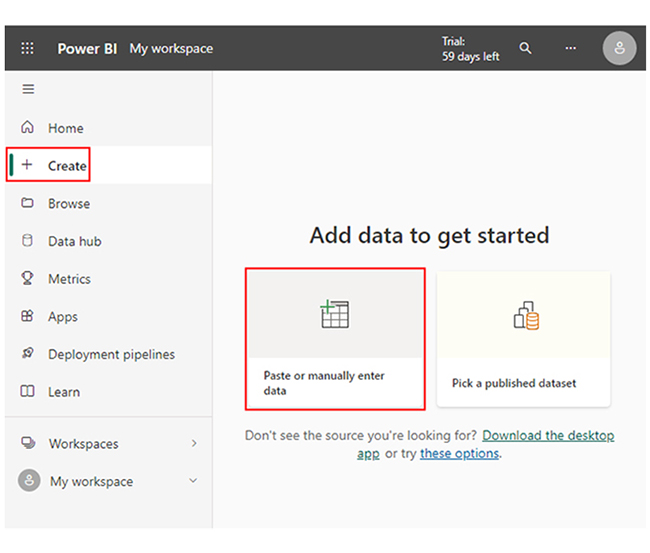
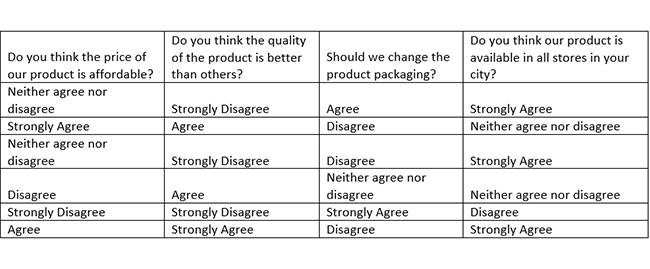
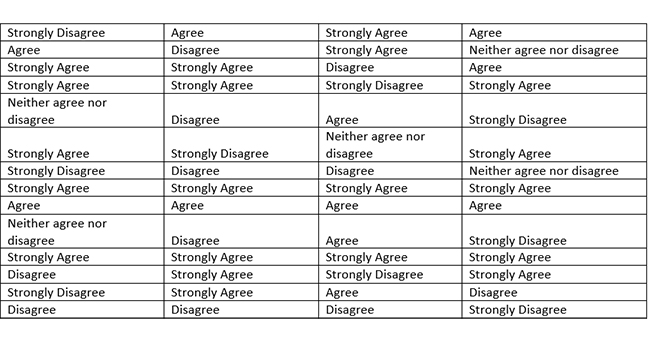
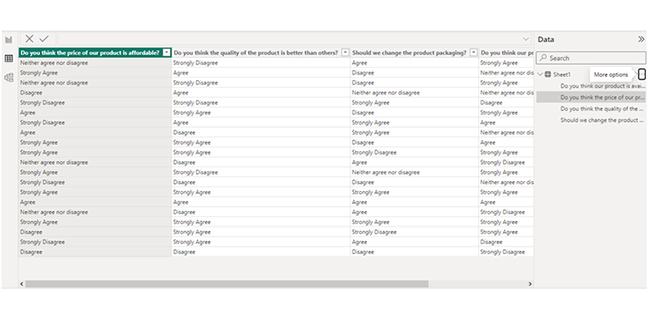
In this guide, you’ll discover the ways to measure happiness, methods for measurement of happiness, and how to measure happiness in Power BI. You’ll also learn about Power BI’s quick measures and easy ways to transform data in Power BI.
Definition: Measuring happiness involves various methods. These methods could be subjective self-reports or a more objective assessment. Common approaches include self-report surveys like the Life Satisfaction Scale and the Subjective Happiness assessments.
The Positive and Negative Affect Schedule (PANAS) measures emotion, while the Experience Sampling Method (ESM) shows real-time emotional states. Psychological well-being can be assessed using factors like personal growth and self-acceptance.
Other methods are the global happiness indices, physiological indicators like behavioral observations, gratitude tracking, and brain activity.
It’s quite challenging to pinpoint the “best” happiness measurement scale. The best method is largely dependent on the purpose and context. Here are the widely recognized scales:
There’s a secure data gateway in Power BI that acts as a bridge and allows you to secure access to data stored on a local network by connecting it to the Power BI cloud service.
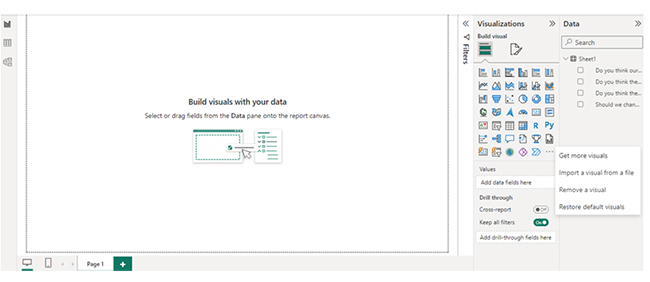
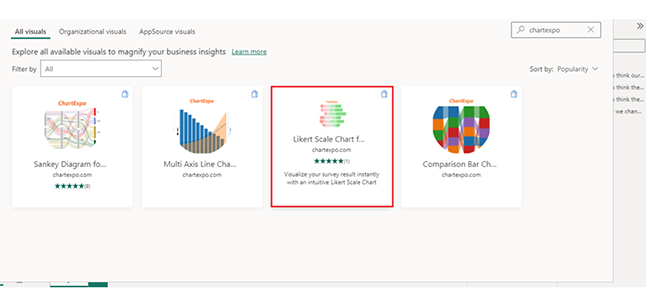
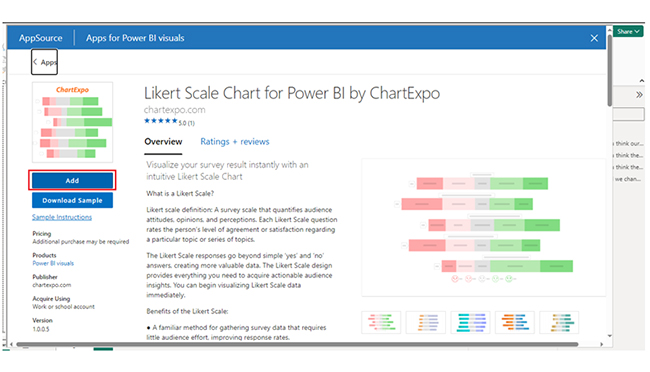
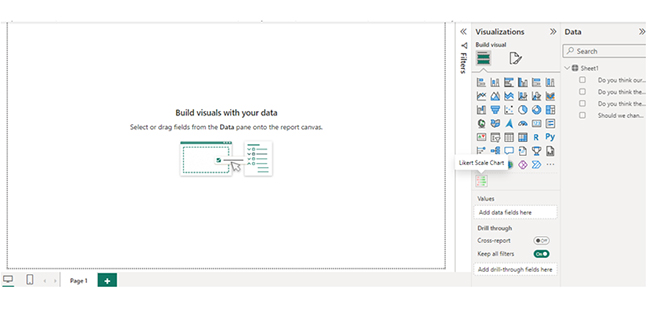
By now, you probably know that Power BI in Office 365 is one of the best data visualization tools. It provides detailed visual analytics and can be used for visual storytelling. The next section shows you a Power BI report example. It also shows you how to create a measure in Power BI, and how to use filters in Power BI.
Yes, happiness can be measured using scales like Life Satisfaction Scale, PANAS, or Subjective Happiness Scale. You can also track it using methods like Sampling, and behavioral and physiological indicators.
There’s no fixed formula to measure happiness. Multiple methods and scales are used. These could be the Life Satisfaction Scale, Subjective Happiness Scale (SHS), and emotional tracking.
The nine metrics of happiness are:
Happiness can be measured using self-report scales (like SHS), emotional tracking (PANAS), psychological well-being assessments, behavioral observations, physiological indicators, experience sampling, and life satisfaction surveys.
Since happiness is dynamic and can fluctuate, you have to use tools like the Experience Sampling Method (ESM). This tool helps you to collect data in real-time, track moment-to-moment changes in emotional states, and recognize long-term trends.
You also have to pay attention to non-verbal cues like laughing, smiling, or overall positivity. All these give insights into a person’s emotional state. External factors like social relationships, financial stability, and work environment influence how happy a person is. You can use life satisfaction scales to measure how content someone feels about these areas.
Finally, getting a comprehensive view of happiness involves combining subjective self-reports with more detailed emotional assessments like the Positive and Negative Affect Schedule (PANAS).
By following the steps outlined in this guide, you’ll be able to use the Power BI data model to measure happiness. All these help in running an efficient data analytics (or business analytics) process.
How much did you enjoy this article?


Discover diverse and high-quality Power BI report examples for inspiration and insights. Elevate your reporting with strategic visualization techniques.

A Customer Relationship Management Dashboard centralizes data, tracks key metrics, and drives smarter business decisions. Discover now!

Explore Healthcare Dashboard Examples and learn how to turn complex healthcare data into clear, actionable insights for better decision-making.


