• Home
  • Tools dropdown img
    • Spreadsheet Charts

      • ChartExpo for Google Sheets
      • ChartExpo for Microsoft Excel
    • Power BI Charts

      • Power BI Custom Visuals by ChartExpo
    • Word Cloud

  • Charts dropdown img
    • Chart Category

      • Bar Charts
      • Circle Graphs
      • Column Charts
      • Combo Charts
      • Comparison Charts
      • Line Graphs
      • PPC Charts
      • Sentiment Analysis Charts
      • Survey Charts
    • Chart Type

      • Box and Whisker Plot
      • Clustered Bar Chart
      • Clustered Column Chart
      • Comparison Bar Chart
      • Control Chart
      • CSAT Survey Bar Chart
      • CSAT Survey Chart
      • Dot Plot Chart
      • Double Bar Graph
      • Funnel Chart
      • Gauge Chart
      • Likert Scale Chart
      • Matrix Chart
      • Multi Axis Line Chart
      • Overlapping Bar Chart
      • Pareto Chart
      • Radar Chart
      • Radial Bar Chart
      • Sankey Diagram
      • Scatter Plot Chart
      • Slope Chart
      • Sunburst Chart
      • Tornado Chart
      • Waterfall Chart
      • Word Cloud
    • Google Sheets
      Microsoft Excel
  • Services
  • Pricing
  • Contact us
  • Blog
  • Support dropdown img
      • Gallery
      • Videos
      • Contact us
      • FAQs
      • Resources
    • Please feel free to contact us

      atsupport@chartexpo.com

Categories
All Data Visualizations Data Analytics Surveys
Add-ons/
  • Google Sheets
  • Microsoft Excel
  • Power BI
All Data Visualizations Data Analytics Surveys
Add-ons
  • Google Sheets
  • Microsoft Excel
  • Power BI

We use cookies

This website uses cookies to provide better user experience and user's session management.
By continuing visiting this website you consent the use of these cookies.

Ok

ChartExpo Survey


Home > Blog > Microsoft Excel

How to Save Excel as CSV to Enhance Chart Quality

How do you save an Excel sheet as CSV?

Many wonder how to handle this crucial step in data analytics. The CSV format, short for Comma Separated Values, is a versatile way to share data. It integrates seamlessly with data visualization tools, databases, and online platforms.

Converting xls to CSV ensures compatibility, especially when collaborating or uploading data. A CSV file removes unnecessary formatting, focusing on raw data for easier processing. It’s a simple way to streamline analyzing and interpreting data.

How to Save Excel as CSV

Businesses depend on CSVs to share customer lists, financial records, and analytics reports. Without it, transferring data accurately can be a challenge.

Saving Excel as CSV is fast and reduces errors from incompatible formats. Whether you’re a student handling assignments or a professional working with datasets, this skill simplifies tasks.

By mastering this, you’ll boost productivity and transform visual storytelling. It’s a small step, but it has a big impact on sharing and understanding data.

Table of Contents:

  1. What is Meant by Saving Excel as CSV?
  2. Why to Save Excel as CSV?
  3. When to Excel Save as CSV?
  4. How to Convert Multiple Excel Sheets to CSV?
  5. What are the Benefits to Convert XLS to CSV?
  6. How to Analyze and Save Excel Sheets as CSV?
  7. FAQs
  8. Wrap Up

First…

What is Meant by Saving Excel as CSV?

Definition: Saving Excel as CSV means converting a spreadsheet into a plain text file where commas separate data. CSV, or Comma Separated Values, is a widely used format for sharing and importing data. It removes all formatting, such as colors and formulas, and focuses only on raw data.

This simplicity enhances compatibility with most software, databases, and tools. CSV files allow quick and accurate data transfer across different platforms and applications. They streamline information design, making data clean and easy to interpret.

By saving as CSV, you ensure data is processable and adaptable. Moreover, pairing raw CSV data with custom Excel charts can turn simple numbers into meaningful insights.

Why to Save Excel as CSV?

Have you ever wondered why people often save Excel files as CSV? It’s not just a techy thing—it’s super practical! This simple switch can make your data work smarter for you.

  • Data portability and compatibility: CSV files are universal. They play nice with almost every system and software. There is no need to worry if the other person has Excel—your data stays accessible everywhere.
  • Simpler data structure: Think of CSV as the no-frills version of your data. There are no fancy formulas or formatting—just raw, clean information. It’s straightforward to manage.
  • Easy data import and export: Are you transferring data between platforms? CSV is your go-to format. Whether uploading to a database or sharing with an app, CSV files ensure a smooth flow without glitches.
  • Data integrity: Have you ever opened a file and found weird formatting issues? CSV avoids that. It keeps your data intact and consistent, precisely as it’s supposed to be.
  • Improved file sharing: CSV files are ideal for emails or cloud uploads where speed matters most. Their simplicity makes them perfect for quick data analysis, focusing on raw information for immediate use.

When to Excel Save as CSV?

Have you ever wondered when to hit that “Save as CSV” button in Excel? Think of CSV as the ultimate team player—lightweight, simple, and universally loved by different systems. Whether you’re sharing data, importing it elsewhere, or keeping things clean and compact, CSV has covered you.

  • You need to share data across platforms: A CSV file works universally, making it ideal for sharing with others who may not use Excel. It ensures your data is accessible and easy to open anywhere.
  • You want to import data into other software: Most tools, like databases or business analytics programs, support CSV for smooth data imports. It simplifies the process, avoids compatibility issues, and ensures seamless integration. CSV’s simplicity makes it the go-to format for preparing data for analytics tools.
  • You don’t need Excel-specific features: CSV files strip away formulas, charts, and formatting, keeping only the raw data. CSV is the perfect minimalist choice if you don’t need those extras.
  • File size is a concern: CSV files are smaller than Excel files, making them easy to share and store. They’re ideal for managing large datasets efficiently. CSV simplifies raw data when comparing tables vs. charts, ensuring simplified visual representation or decision-making for analysis.
  • You want a universal format for data storage: CSV saves data in a plain, structured format that’s easy to read and long-term friendly. It’s a reliable choice for archiving or sharing without complications.

How to Convert Multiple Excel Sheets to CSV?

Do you need a workbook with multiple sheets as separate CSV files? Follow these simple steps, and you’ll have them ready in no time:

  1. Open your Excel workbook: Launch the Excel file with the sheets you want to convert.
  2. Select a sheet: Click on the tab of the first sheet you need.
  3. Save as CSV
    • Go to file> Save As.
    • Choose a location for the file.
    • In the “Save as type” dropdown, select CSV (Comma delimited).
    • Name your file and hit Save.
  1. Repeat for other sheets: Return to the workbook, pick the next sheet, and repeat the steps. Each sheet gets its own CSV file.

What are the Benefits to Convert XLS to CSV?

Converting XLS to CSV can feel like giving your data a makeover—streamlined, flexible, and ready to shine anywhere. It’s not just about changing formats; it’s about unlocking new possibilities for your spreadsheets. Let’s explore why making the switch can be a smart move:

  • Increased compatibility: CSV files are universal. They integrate effortlessly with most software, tools, and platforms. This flexibility simplifies sharing and importing data, laying the foundation for effective data storytelling.
  • Smaller file size: CSV files are much smaller than XLS files, saving storage space and speeding up transfers.
  • Simplified data structure: It removes unnecessary formatting, focusing solely on the core data you need. This simplicity makes it perfect for visual analytics, ensuring clear and actionable insights without distractions.
  • Data portability: Do you need to move data across systems? CSV files are lightweight and easy to transport, ensuring your information travels without a hitch.
  • Preservation of data integrity: CSV frees your raw data from formulas and formatting quirks. It keeps your information accurate and intact during transfers. This clean format is perfect for creating reliable data for Excel charts, ensuring precise and consistent visuals.

How to Analyze and Save Excel Sheets as CSV?

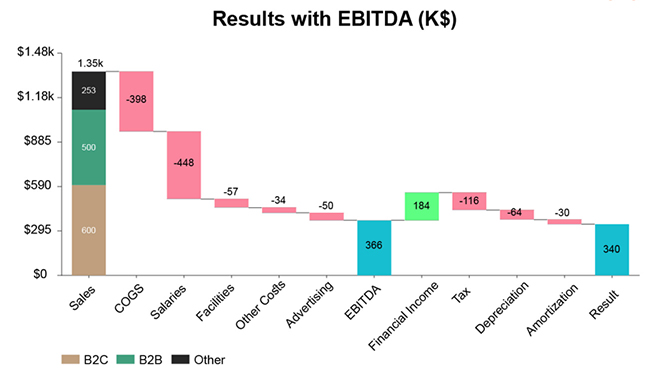
Converting XLS to CSV is a vital step for sharing raw data. But the real challenge lies in data visualizations. Data analysis thrives on visuals, yet Excel often fails to deliver impactful insights: basic charts and clunky formatting limit storytelling.

That’s where ChartExpo, an add-in for Excel Mac, changes the game. Its advanced Excel charts transform static data into stunning data visualizations. It bridges Excel’s gaps, turning numbers into meaningful, easy-to-read insights.
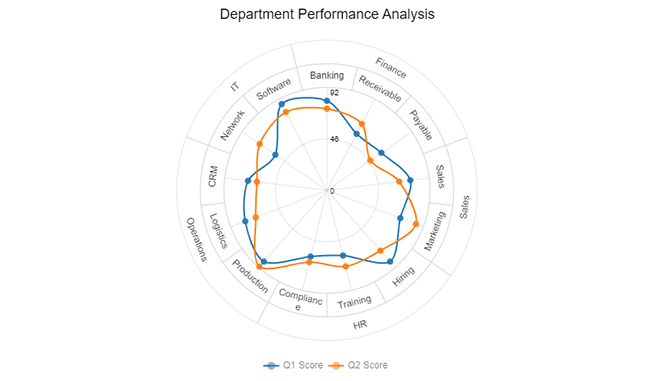
The charts below are created in Excel using ChartExpo:

Multi Axis Line Chart

Multi Axis Line Chart After Learning How to Save Excel as CSV

Sankey Chart

Sankey Chart After Learning How to Save Excel as CSV

Likert Scale Chart

Likert Scale Chart After Learning How to Save Excel as CSV

Comparison Bar Chart

Comparison Bar Chart After Learning How to Save Excel as CSV

Sentiment Trend Chart

Sentiment Trend Chart After Learning How to Save Excel as CSV

Stacked Waterfall Chart

Stacked Waterfall Chart After Learning How to Save Excel as CSV

Horizontal Waterfall Chart

Horizontal Waterfall Chart After Learning How to Save Excel as CSV

Mosaic Plot (aka Mekko)

Mosaic Plot After Learning How to Save Excel as CSV

Progress Chart

Progress Chart After Learning How to Save Excel as CSV

Circular Org Chart

Circular Org Chart After Learning How to Save Excel as CSV

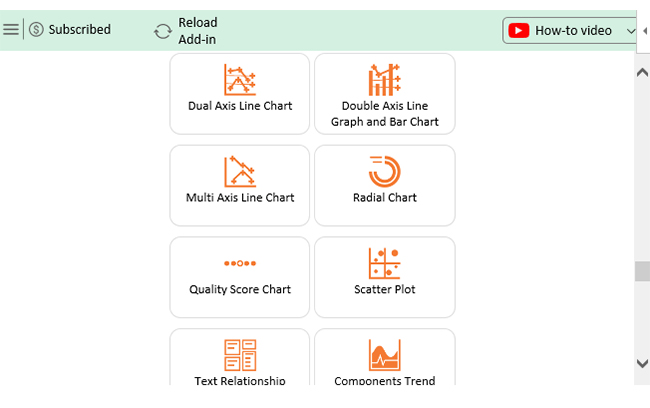
Let’s learn how to install ChartExpo in Excel.

  1. Open your Excel application.
  2. Open the worksheet and click the “Insert” menu.
  3. You’ll see the “My Apps” option.
  4. In the Office Add-ins window, click “Store” and search for ChartExpo on my Apps Store.
  5. Click the “Add” button to install ChartExpo in your Excel.

ChartExpo charts are available both in Google Sheets and Microsoft Excel. Please use the following CTAs to install the tool of your choice and create beautiful visualizations with a few clicks in your favorite tool.

Example

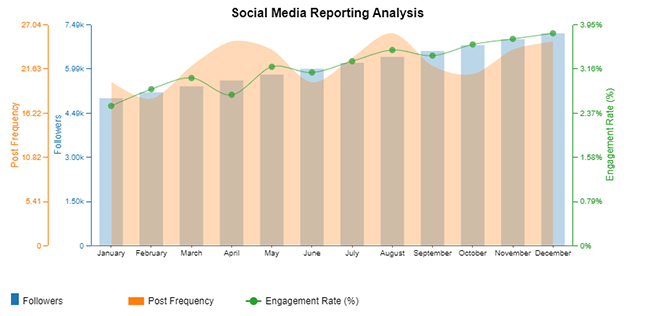
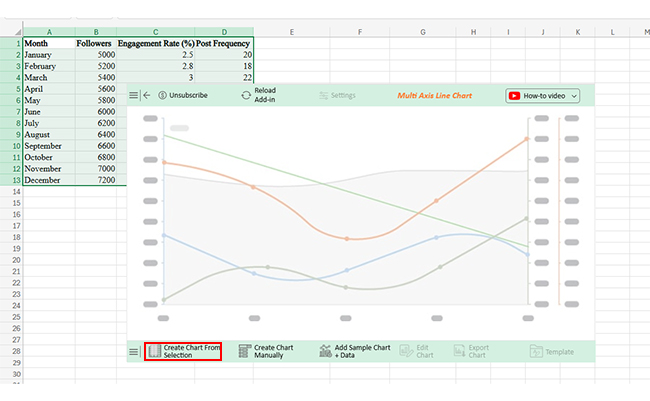
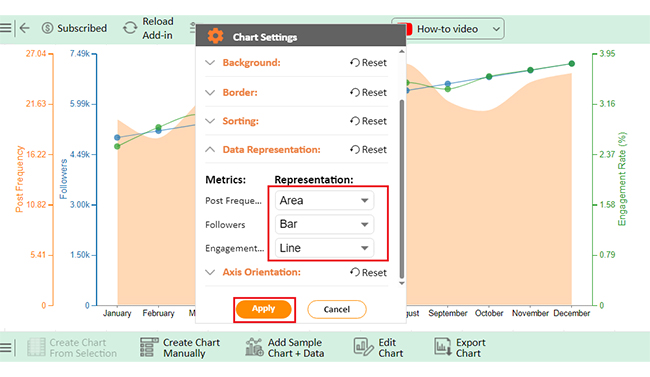
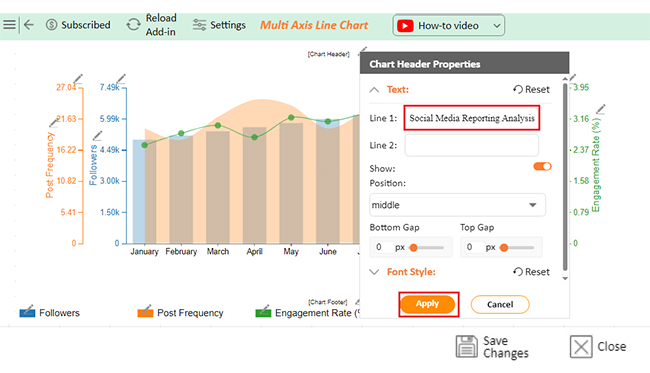
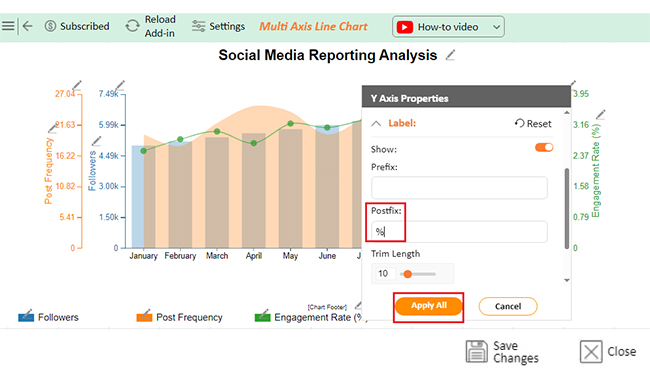
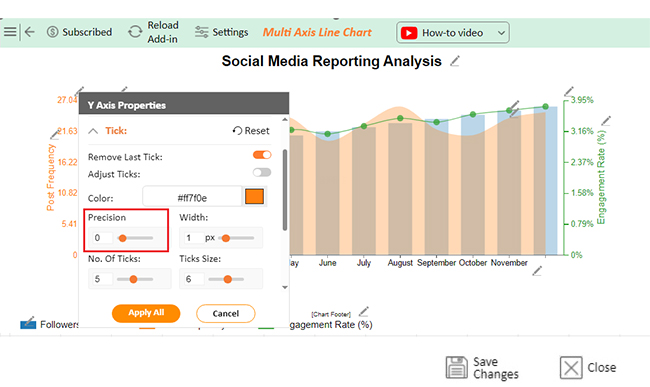
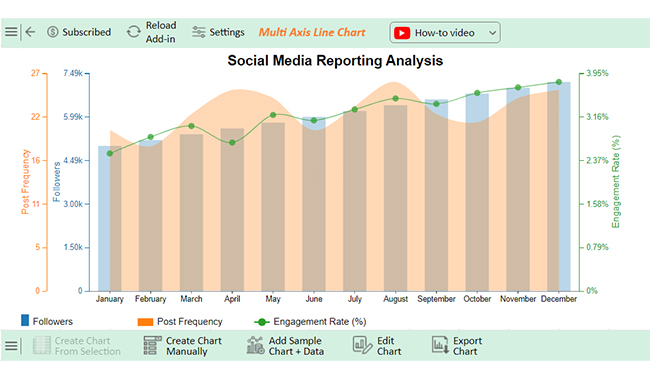
Using the sample data below, let’s see how to make a graph from a table with ChartExpo.

Month Followers Engagement Rate (%) Post Frequency
January 5000 2.5 20
February 5200 2.8 18
March 5400 3 22
April 5600 2.7 25
May 5800 3.2 24
June 6000 3.1 20
July 6200 3.3 23
August 6400 3.5 26
September 6600 3.4 22
October 6800 3.6 21
November 7000 3.7 24
December 7200 3.8 25
  • To get started with ChartExpo, install ChartExpo in Excel.
  • Now Click on My Apps from the INSERT menu.
insert chartexpo in excel
  • Choose ChartExpo from My Apps, then click Insert.
open chartexpo in excel
  • Once it loads, scroll through the charts list to locate and choose the “Multi Axis Line Chart”.
search multi axis line chart in excel
  • You will see a Multi Axis Line Chart on the screen.
See Multi Axis Line Chart After Learning How to Save Excel as CSV
  • Click the “Create Chart From Selection” button after selecting the data from the sheet, as shown.
Click Create Chart From Selection After Learning How to Save Excel as CSV
  • ChartExpo will generate the visualization below for you.
See Initial Visual After Learning How to Save Excel as CSV
  • Click on Settings and change the “Data Representation” as follows.
Change Data Representation After Learning How to Save Excel as CSV
  • Click the pencil icon next to the Chart Header to change the title.
  • It will open the properties dialog. Under the Text section, you can add a heading in Line 1 and enable Show.
  • Give the appropriate title of your chart and click the Apply button.
Add Chart Header After Learning How to Save Excel as CSV
  • You can add the sign of (%) with the Engagement Rate value:
Add Postfix After Learning How to Save Excel as CSV
  • You can change the precision value to zero:
Change Precision Value to Zero After Learning How to Save Excel as CSV
  • Change the Legend shape of “Followers” to Column and click the “Apply” button.
Change Legend Shape of Followers After Learning How to Save Excel as CSV
  • Change the Legend shape of “Engagement Rate” into a Line and Circle and click the “Apply” button.
Change Legend Shape of Engagement Rate After Learning How to Save Excel as CSV
  • You can click on the “Save Changes” button:
Click Save Changes After Learning How to Save Excel as CSV
  • Your final Multi Axis Line Chart will look like the one below.
Final How to Save Excel as CSV

Insights

  • The follower count grew steadily, reaching 7,200 by December.
  • The engagement rate peaked at 3.8% during the year.
  • Post frequency was consistent despite some variations.
  • This data demonstrates effective audience growth and engagement strategies.

Save the Excel Sheet as CSV:

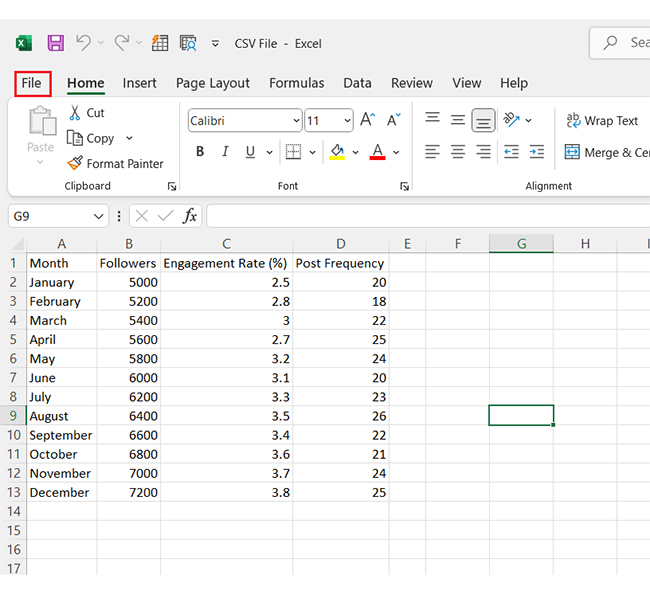
We’ve learnt how to create a dashboard using Excel. Now, do you want to convert your Excel sheet to a CSV file? It’s super simple. Follow these steps, and you’ll be done in minutes.

Let’s make it happen!

  1. Open your file: Click on File in the top menu.
Click on File in Top Menui After Learning How to Save Excel as CSV
  1. Select the Save As option.
Select Save As Option After Learning How to Save Excel as CSV
  1. In the “Save as type” dropdown, scroll and choose CSV (Comma delimited).
Choose CSV After Learning How to Save Excel as CSV
  1. Click the Save button.
Click Save Button After Learning How to Save Excel as CSV
  1. Your spreadsheet is now in CSV format and ready to use.
See Spreadsheet in CSV Format After Learning How to Save Excel as CSV

How to Save Microsoft Excel as CSV and Rebuild Charts from Data:

  1. Open your Excel Application.
  2. Install ChartExpo Add-in for Excel from Microsoft AppSource to create interactive visualizations.
  3. Select the Multi-Axis Line Chart from the list of charts.
  4. Select your data
  5. Click on the “Create Chart from Selection” button.
  6. Customize your chart properties to add header, axis, legends, and other required information.

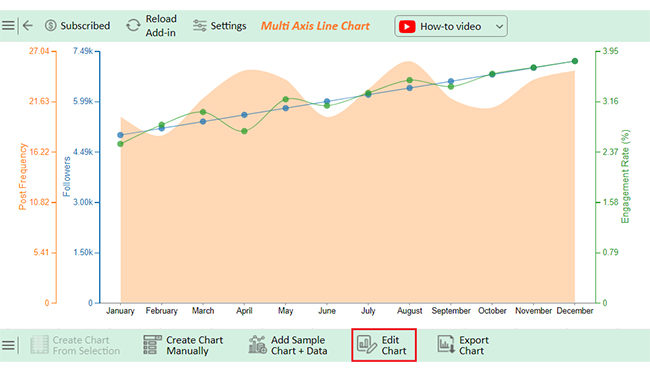
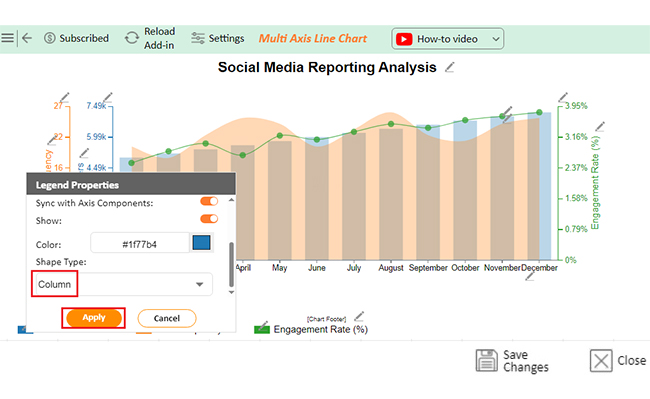
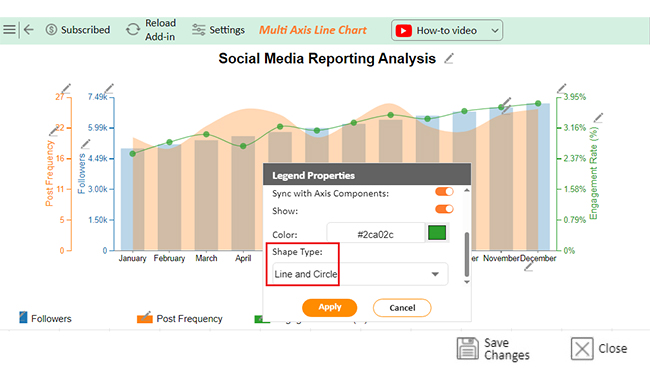
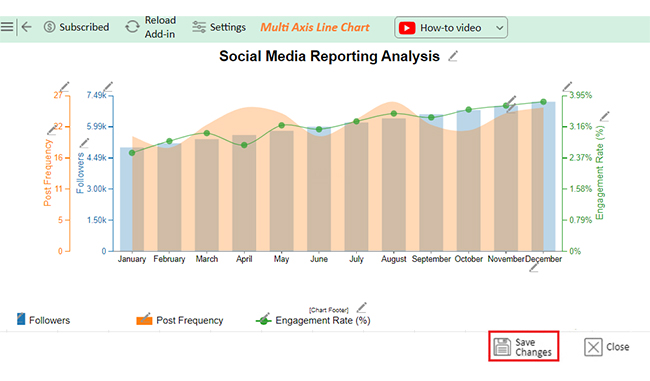
The following video will help you to create a Multi-Axis Line Chart in Microsoft Excel.

FAQs

What is the fastest way to convert Excel to CSV?

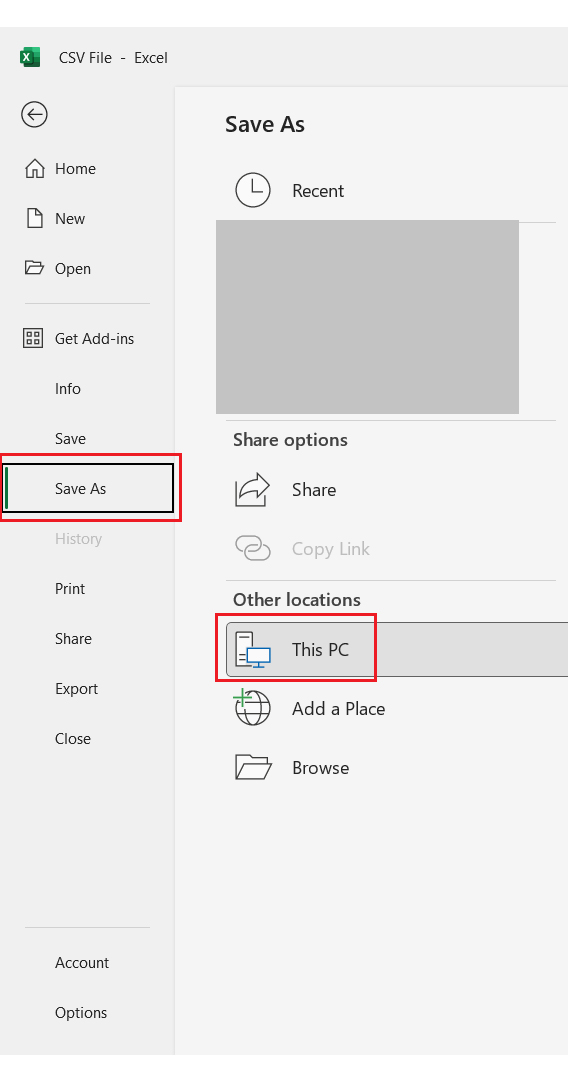
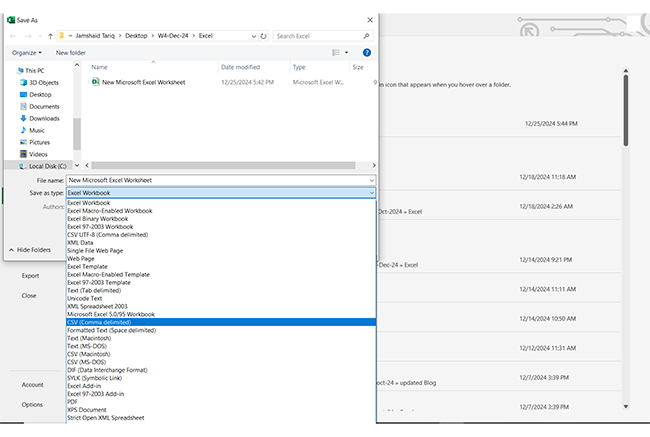
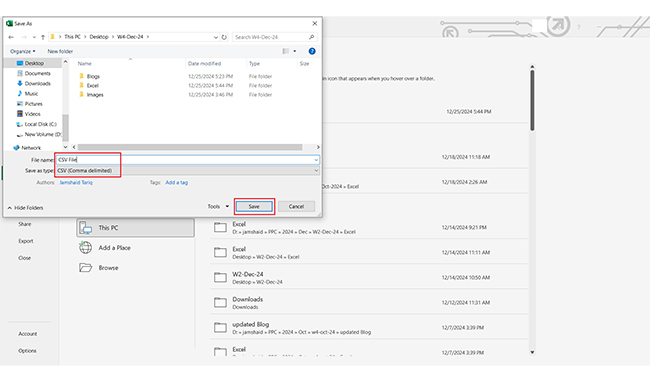
The fastest way to convert Excel to CSV is by using the “Save As” option:

  • Open your Excel file.
  • Click “File”, select “Save As”, choose CSV format, and save.
  • Your file is instantly converted and ready to use.

How do you convert Excel to CSV format online?

To convert Excel to CSV online:

  • Upload your file to a trusted conversion tool like Zamzar or Convertio.
  • Choose CSV as the output format and click convert.
  • Download the converted file, and your data is ready to use

How do I convert a bunch of Excel files to CSV?

  • Open each Excel file.
  • Select a sheet.
  • Click File > Save As.
  • Choose CSV (comma-delimited) as the file type.
  • Repeat for all sheets or files. If needed, automate with scripts for faster processing.

Wrap Up

Saving Excel as CSV is a simple yet essential skill. It ensures data compatibility across platforms, making sharing with teams or uploading data for Excel charts seamless.

The process removes unnecessary formatting, focusing on raw data. This simplifies processing, reduces errors, and increases efficiency. It’s a solution to tackle information overload, ensuring clean, manageable datasets.

CSV files are vital for businesses, researchers, and tech professionals. They support importing, exporting, and organizing large datasets. Their simplicity makes them indispensable for data-driven decision-making.

Learning this skill streamlines data management. It saves time and eliminates format conflicts. You can create a clean, universally accepted file with a few clicks.

While CSV captures raw data, tools like ChartExpo bring it to life through cool Excel charts and graphs. This add-in transforms data from Excel to graph, enhancing analysis and clarity.

Do not hesitate.

Master how to save Excel as CSV and start using ChartExpo to bridge data organization and visualization. This combination leads to smarter decisions and meaningful insights.

How much did you enjoy this article?

ExcelAd1
Start Free Trial!
147566

Related articles

next previous
Microsoft Excel10 min read

Compound Interest in Excel for Smarter Reporting

Discover compound interest in Excel and how it works. Learn its formulas, calculation tips, and common errors to avoid for more accurate financial analysis.

Microsoft Excel9 min read

KPI Dashboard in Excel: A Complete Guide

A KPI dashboard in Excel helps track key metrics and streamline data visualization. Discover how to create, analyze, and use it with clear guides and examples.

Microsoft Excel11 min read

How to Plot a Speedometer Chart in Excel?

Create a Speedometer Chart in Excel to track KPIs, goals, and performance metrics visually. Explore templates, examples, and step-by-step instructions for better dashboards.

Microsoft Excel13 min read

Excel for Teachers for Insightful Preparation

Excel for teachers simplifies grading, tracks attendance, and organizes data. Find its key features, expert tips, and how ChartExpo enhances data visualization.

Microsoft Excel14 min read

How to Make a Cash Flow Diagram in Excel?

Learn how to make a Cash Flow Diagram in Excel. It will help you learn to visualize and analyze inflows and outflows of your business cash flow.

ChartExpo logo

Turn Data into Visual
Stories

CHARTEXPO

  • Home
  • Gallery
  • Videos
  • Services
  • Pricing
  • Contact us
  • FAQs
  • Privacy policy
  • Terms of Service
  • Sitemap

TOOLS

  • ChartExpo for Google Sheets
  • ChartExpo for Microsoft Excel
  • Power BI Custom Visuals by ChartExpo
  • Word Cloud

CATEGORIES

  • Bar Charts
  • Circle Graphs
  • Column Charts
  • Combo Charts
  • Comparison Charts
  • Line Graphs
  • PPC Charts
  • Sentiment Analysis Charts
  • Survey Charts

TOP CHARTS

  • Sankey Diagram
  • Likert Scale Chart
  • Comparison Bar Chart
  • Pareto Chart
  • Funnel Chart
  • Gauge Chart
  • Radar Chart
  • Radial Bar Chart
  • Sunburst Chart
  • see more
  • Scatter Plot Chart
  • CSAT Survey Bar Chart
  • CSAT Survey Chart
  • Dot Plot Chart
  • Double Bar Graph
  • Matrix Chart
  • Multi Axis Line Chart
  • Overlapping Bar Chart
  • Control Chart
  • Slope Chart
  • Clustered Bar Chart
  • Clustered Column Chart
  • Box and Whisker Plot
  • Tornado Chart
  • Waterfall Chart
  • Word Cloud
  • see less

RESOURCES

  • Blog
  • Resources
  • YouTube
SIGN UP FOR UPDATES

We wouldn't dream of spamming you or selling your info.

© 2025 ChartExpo, all rights reserved.