• Home
  • Tools dropdown img
    • Spreadsheet Charts

      • ChartExpo for Google Sheets
      • ChartExpo for Microsoft Excel
    • Power BI Charts

      • Power BI Custom Visuals by ChartExpo
    • Word Cloud

  • Charts dropdown img
    • Chart Category

      • Bar Charts
      • Circle Graphs
      • Column Charts
      • Combo Charts
      • Comparison Charts
      • Line Graphs
      • PPC Charts
      • Sentiment Analysis Charts
      • Survey Charts
    • Chart Type

      • Box and Whisker Plot
      • Clustered Bar Chart
      • Clustered Column Chart
      • Comparison Bar Chart
      • Control Chart
      • CSAT Survey Bar Chart
      • CSAT Survey Chart
      • Dot Plot Chart
      • Double Bar Graph
      • Funnel Chart
      • Gauge Chart
      • Likert Scale Chart
      • Matrix Chart
      • Multi Axis Line Chart
      • Overlapping Bar Chart
      • Pareto Chart
      • Radar Chart
      • Radial Bar Chart
      • Sankey Diagram
      • Scatter Plot Chart
      • Slope Chart
      • Sunburst Chart
      • Tornado Chart
      • Waterfall Chart
      • Word Cloud
    • Google Sheets
      Microsoft Excel
  • Services
  • Pricing
  • Contact us
  • Blog
  • Support dropdown img
      • Gallery
      • Videos
      • Contact us
      • FAQs
      • Resources
    • Please feel free to contact us

      atsupport@chartexpo.com

Categories
All Data Visualizations Data Analytics Surveys
Add-ons/
  • Google Sheets
  • Microsoft Excel
  • Power BI
All Data Visualizations Data Analytics Surveys
Add-ons
  • Google Sheets
  • Microsoft Excel
  • Power BI

We use cookies

This website uses cookies to provide better user experience and user's session management.
By continuing visiting this website you consent the use of these cookies.

Ok

ChartExpo Survey


Home > Blog > Data Analytics

Statement of Retained Earnings: Definition & Example

So, how do businesses determine their financial growth over time? Statement of retained earnings example. This phrase may sound technical, but it is crucial for understanding a company’s profit reinvestment.

Statement of Retained Earnings Example

This financial statement provides a view of what a company chooses to do with its profits whether to distribute them to shareholders as dividends or retain them to invest in future expansions.

A statement of retained earnings example links the income statement and balance sheet. It communicates the company’s specifics on what to do to the stockholder/owner after earning profits. For instance, in 2023, Apple Inc. reported a whopping $20 billion in retained earnings. This signals their strategy for long-term growth and stability.

Incorporating this statement in financial analysis is crucial. It can indicate a company’s maturity whether it’s in a position to reinvest in its own growth or reward shareholders through dividends.

A second glance at a statement of retained earnings example can reveal much about a company’s operational efficacy. For example, a consistent increase in retained earnings might suggest a company is expanding or innovating. A decrease could signal financial struggles or hefty dividend payouts.

To sum up, the statement of retained earnings is not just a figure on a spreadsheet. It’s a snapshot of a company’s fiscal health and strategic choices. By examining this statement, one can gauge the potential for future ventures or the likelihood of receiving dividends.

Let’s discuss why the statement of retained earnings example is an indispensable tool for investors and analysts.

Table of Contents:

  1. What is a Statement of Retained Earnings?
  2. How Do You Calculate Retained Earnings on a Balance Sheet?
  3. How Do You Prepare a Retained Earnings Statement?
  4. How Do You Examine the Statement of Retained Earnings?
  5. What are the Benefits of the Statement of Retained Earnings?
  6. Wrap Up

First…

What is a Statement of Retained Earnings?

Definition: The statement of retained earnings summarizes a company’s retained earnings during a given period. The statement offers a ledger account of how net income and dividends affect the retained earnings balance. The statement is prepared from the start to the end of the period involved.

The statement typically starts with the beginning balance of retained earnings from the previous period. Then, it adjusts for net income or loss generated during the current period. Dividends paid to shareholders are deducted from the retained earnings balance. Other adjustments, such as changes in accounting policies or corrections of errors, are also accounted for. This results in the ending balance of retained earnings.

The statement of retained earnings is crucial as it helps stakeholders learn how the company reinvests or distributes its profits. It also helps one understand the company’s financial performance and dividend policy. The statement is considered part of a company’s financial reporting. It is usually prepared with other financial statements, including income statements and balance sheets.

How Do You Calculate Retained Earnings on a Balance Sheet?

Retained earnings refer to the accumulated profits of a company that have not been distributed to shareholders as dividends. Calculating retained earnings in a balance sheet involves the following:

  1. Determine the beginning retained earnings: A typical balance sheet includes the beginning retained earnings obtained from the previous accounting period. This refers to all the profits the company retained to that point.
  2. Add net income or loss: Next, adjust the beginning retained earnings by any net income earned during the current accounting period. Net income is calculated by subtracting total expenses from total revenues in the current accounting period’s income statement.
  3. Subtract dividends: Subtract the total dividends paid in the accounting period from the corrected retained earnings balance. All dividends paid decrease the overall amount of profits retained by the business.
  4. Account for other adjustments: Correct retained earnings for significant issues, such as stock repurchases that reduce outstanding stock. Or any changes in accounting policies or errors corrected. All these adjustments help ensure the retained earnings balance sheet accurately reflects the company’s overall financial performance and activities.
  5. Calculate ending retained earnings: After accounting for all adjustments, the resulting figure represents the ending retained earnings balance for the current accounting period. This balance is reported on the balance sheet. It carries over as the beginning retained earnings balance for the subsequent period.

The formula for calculating retained earnings is as follows:

         Retained earnings ending balance = Retained earnings starting balance + current-period net

How Do You Prepare a Retained Earnings Statement?

Preparing a retained earnings statement involves several key steps to reflect the changes in retained earnings accurately. Here’s how to prepare a retained earnings statement:

  1. Gather financial data: Collect relevant financial information, including the beginning retained earnings balance, net income or loss, dividends, and other adjustments, utilizing an income statement template in Excel for organization and accuracy.
  2. Calculate beginning retained earnings: Start with the beginning retained earnings balance from the previous accounting period. You can find this on the balance sheet.
  3. Determine net income (or loss): Calculate the net income or loss for the current accounting period by subtracting total expenses from total revenues.
  4. Adjust for dividends: Subtract any dividends paid to shareholders during the accounting period from the calculated net income.
  5. Apply the formula: The formula for retained earnings is: Beginning Retained Earnings + Net Income (or Loss) Dividends = Ending Retained Earnings.
  6. Prepare the statement: Organize the calculated figures into a statement format. Indicate the beginning retained earnings, net income (or loss), dividends, and ending retained earnings.
  7. Include disclosure: Provide additional disclosure if necessary, such as explanations for significant changes in retained earnings. Or details of any other adjustments made.
  8. Review and finalize: Carefully review the retained earnings statement for accuracy and completeness. Ensure all calculations are correct and properly supported by financial data.

How Do You Examine the Statement of Retained Earnings?

Data whispers secrets, but only if you listen closely. Enter the statement of retained earnings, a financial enigma wrapped in numbers. It’s a tale of profits retained, not spent a story best told visually within the framework of a 3-statement financial model.

Now, imagine trying to decode this saga through Excel’s monochrome lens. It’s akin to painting with water on a rainy day.

But fear not, ChartExpo sails in. With its palette of vivid graphs, this tool transforms the mundane into the magnificent. It offers a lens to view financial narratives in full color.

Let’s learn how to install ChartExpo in Excel.

  1. Open your Excel application.
  2. Open the worksheet and click the “Insert” menu.
  3. You’ll see the “My Apps” option.
  4. In the Office Add-ins window, click “Store” and search for ChartExpo on my Apps Store.
  5. Click the “Add” button to install ChartExpo in your Excel.

ChartExpo charts are available both in Google Sheets and Microsoft Excel. Please use the following CTAs to install the tool of your choice and create beautiful visualizations with a few clicks in your favorite tool.

Example

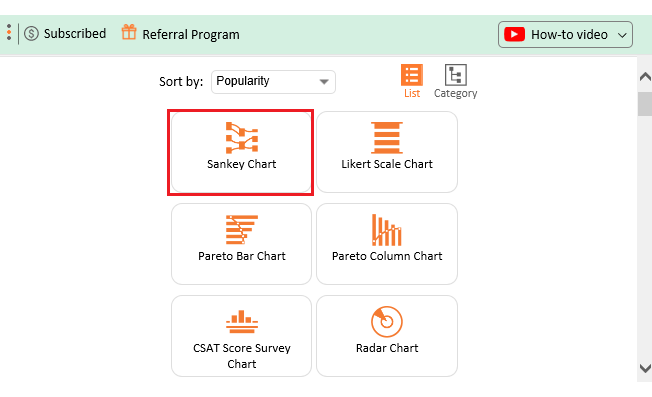
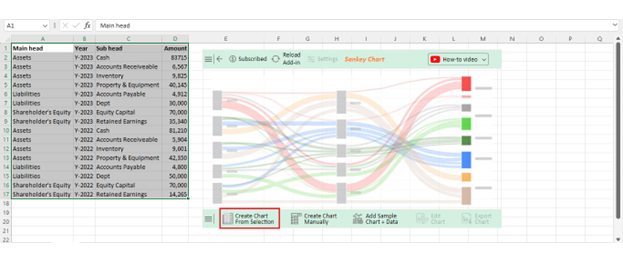
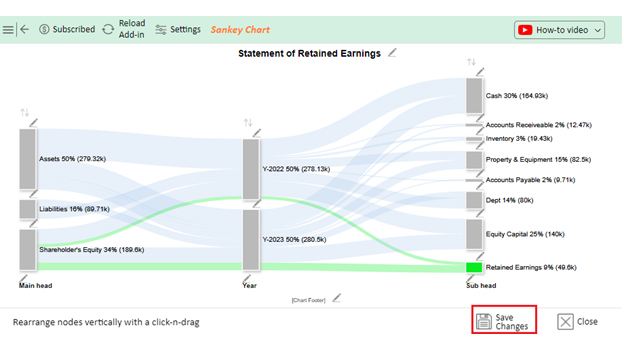
Let’s analyze the statement of retained earnings, as shown in the example data below, using ChartExpo.

Main head Year Subhead Amount
Assets Y-2023 Cash 83715
Assets Y-2023 Accounts Receivable 6,567
Assets Y-2023 Inventory 9,825
Assets Y-2023 Property & Equipment 40,145
Liabilities Y-2023 Accounts Payable 4,912
Liabilities Y-2023 Dept 30,000
Shareholder’s Equity Y-2023 Equity Capital 70,000
Shareholder’s Equity Y-2023 Retained Earnings 35,340
Assets Y-2022 Cash 81,210
Assets Y-2022 Accounts Receivable 5,904
Assets Y-2022 Inventory 9,601
Assets Y-2022 Property & Equipment 42,350
Liabilities Y-2022 Accounts Payable 4,800
Liabilities Y-2022 Dept 50,000
Shareholder’s Equity Y-2022 Equity Capital 70,000
Shareholder’s Equity Y-2022 Retained Earnings 14,265
  • To get started with ChartExpo, install ChartExpo in Excel.
  • Now Click on My Apps from the INSERT menu.
insert chartexpo in excel
  • Choose ChartExpo from My Apps, then click Insert.
open chartexpo in excel
  • Once it loads, choose the “Sankey Chart” from the charts list.
search sankey chart in excel
  • Click the “Create Chart From Selection” button after selecting the data from the sheet, as shown.
Create Chart From Selection After Doing Statement of Retained Earnings Example
  • ChartExpo will generate the visualization below for you.
Edit Chart After Doing Statement of Retained Earnings Example
  • If you want to have the chart’s title, click Edit Chart, as shown in the above image.
  • Click the pencil icon next to the Chart Header to change the title.
  • It will open the properties dialog. Under the Text section, you can add a heading in Line 1 and enable Show.
  • Give the appropriate title of your chart and click the Apply button.
Add Chart Header of Chart After Doing Statement of Retained Earnings Example
  • You can add the Dollar Sign with all values by clicking on the Small Pencil Icon as follows:
Add Dollar Sign of Chart After Doing Statement of Retained Earnings Example
  • Let’s give colors to the nodes. Click the pencil icon at the top of the nodes and go to “Node“. Select the color and click the “Apply” button to save all changes.
Change Node Colors of Chart After Doing Statement of Retained Earnings Example
  • Click the “Save Changes” button to persist the changes.
Save Changes of Chart After Doing Statement of Retained Earnings Example
  • Your final chart will appear below.
Final Statement of Retained Earnings Example

Insights

  • There was an increase in cash from $81,210 to $83,715 in Y-2023.
  • Accounts Receivable rose from $5,904 to $6,567.
  • Inventory went up from $9,601 to $9,825.
  • There was a decrease in Property & Equipment from $42,350 to $40,145.
  • The debt went down from $50,000 to $30,000.
  • The amount of Retained Earnings rose from $14,265 to $35,340.

What are the Benefits of the Statement of Retained Earnings?

The statement of retained earnings is important in a company’s financial reporting process because of the following reasons:

  • Insight into profit retention: The statement helps you know how much of the earnings have been plowed back into the business. Thus, you can understand the company’s future growth plan. You can ascertain what the company intends to use as retained earnings to increase its retained earnings.
  • Track record of performance: Stakeholders can examine the changes in the company’s retained earnings. Then, use the information to assess the company’s past performance and determine how successful it is. If the company’s retained earnings are increasing, then it is profitable and has a stable financial position.
  • Dividend decision support: It provides information on the amount of retained earnings available for distribution. Thus, you can make data-driven decisions on dividend payouts. This helps align the company dividend policy with other financial plans.
  • Transparency: Reporting retained earnings makes the company transparent. Why? It allows investors to know which portion of the earnings have been retained and which portion has been distributed. It illustrates the firm’s dedication to responsibility and financial ethics.
  • Analytical insights: A trend analysis of retained earnings over time can be quite revealing. It serves as an insightful measure of the business’s underlying financial health and helps determine the future course of action from the standpoint of business risk and progressive growth.
  • Benchmarking and comparisons: Comparing retained earnings across the same industry or with competitors makes much more sense. It helps to compare your company with the financial soundness of its rivals.

FAQs

What is the GAAP statement of retained earnings?

The GAAP statement of retained earnings follows generally accepted accounting principles (GAAP). It provides a detailed account of changes in retained earnings over a specific period. It complies with GAAP guidelines for financial reporting and disclosure requirements.

How do you read a statement of income and retained earnings?

To read a statement of income and retained earnings:

  1. Start with the beginning retained earnings balance.
  2. Review the net income or loss for the period.
  3. Factor in dividends paid to shareholders.
  4. Calculate the ending retained earnings balance.

What is the purpose of the retained earnings?

The purpose of retained earnings is to accumulate profits within a company.

  • It provides funds for reinvestment in the business.
  • It supports growth and expansion initiatives.
  • It strengthens the company’s financial position.
  • It can also be used to pay dividends.

Wrap Up

The statement of retained earnings is a valuable tool in a company’s financial reporting domain. It keeps a record and summarizes the changes in retained earnings in an accounting period. This helps to understand how the earnings are managed and allotted to various areas of the business.

The statement of retained earnings breaks down the retained earnings so that stakeholders can better understand the company’s financial performance. It provides information about the company’s profit retention, dividend policy, and overall financial condition.

The statement of retained earnings represents a company’s journey and finances. It conveys the effect of past financial decisions on retained earnings. This forms a clear image of a company’s ability to generate and hold earnings. The statement also gives signals to the stakeholders about the company’s stability, growth potential, and long-term sustainability.

The statement is also instrumental in financial transparency and accountability. It provides a transparent account of how profits are retained or distributed. This fosters trust and confidence among investors, creditors, and other stakeholders.

The statement of retained earnings is also important in making strategic decisions. It helps the management set dividend policies, reinvestment programs, and other financial programs. All this is based on a clear understanding of the company’s financial position and performance.

In essence, the statement of retained earnings transcends its role as a mere financial report. It serves as a cornerstone of financial transparency, accountability, and strategic decision-making within the organization. Start preparing and analyzing it with ChartExpo to ensure sound financial management and corporate governance practices.

How much did you enjoy this article?

PBIAd1
Start Free Trial!
135294

Related articles

next previous
Data Analytics12 min read

Business Intelligence in Healthcare Industry: A Visual Approach

Business Intelligence in the healthcare industry improves patient care and streamlines operations. Learn how BI works and benefits healthcare providers.

Data Analytics10 min read

Analytics in Telecom Industry for Better Insights

Analytics in the telecom industry optimizes networks, enhances customer experience, and detect fraud. Learn its key benefits, challenges, and use cases.

Data Analytics7 min read

Financial Forecasting for Startups: A Complete Guide

This guide dives deep into financial forecasting for startups. You'll also discover elements of a financial projection for a startup, and tips for creating one.

Data Analytics32 min read

Data Reporting: Making Your Reports Irresistible

Data reporting turns numbers into insights that guide decisions. Learn how to simplify complex data and make confident choices. Read on for key strategies!

Data Analytics10 min read

Employee Performance KPIs: Insights That Drive Action

Employee performance KPIs track productivity and success. Learn the key metrics, measurement methods, and analysis techniques to boost performance.

ChartExpo logo

Turn Data into Visual
Stories

CHARTEXPO

  • Home
  • Gallery
  • Videos
  • Services
  • Pricing
  • Contact us
  • FAQs
  • Privacy policy
  • Terms of Service
  • Sitemap

TOOLS

  • ChartExpo for Google Sheets
  • ChartExpo for Microsoft Excel
  • Power BI Custom Visuals by ChartExpo
  • Word Cloud

CATEGORIES

  • Bar Charts
  • Circle Graphs
  • Column Charts
  • Combo Charts
  • Comparison Charts
  • Line Graphs
  • PPC Charts
  • Sentiment Analysis Charts
  • Survey Charts

TOP CHARTS

  • Sankey Diagram
  • Likert Scale Chart
  • Comparison Bar Chart
  • Pareto Chart
  • Funnel Chart
  • Gauge Chart
  • Radar Chart
  • Radial Bar Chart
  • Sunburst Chart
  • see more
  • Scatter Plot Chart
  • CSAT Survey Bar Chart
  • CSAT Survey Chart
  • Dot Plot Chart
  • Double Bar Graph
  • Matrix Chart
  • Multi Axis Line Chart
  • Overlapping Bar Chart
  • Control Chart
  • Slope Chart
  • Clustered Bar Chart
  • Clustered Column Chart
  • Box and Whisker Plot
  • Tornado Chart
  • Waterfall Chart
  • Word Cloud
  • see less

RESOURCES

  • Blog
  • Resources
  • YouTube
SIGN UP FOR UPDATES

We wouldn't dream of spamming you or selling your info.

© 2025 ChartExpo, all rights reserved.