• Home
  • Tools dropdown img
    • Spreadsheet Charts

      • ChartExpo for Google Sheets
      • ChartExpo for Microsoft Excel
    • Power BI Charts

      • Power BI Custom Visuals by ChartExpo
    • Word Cloud

  • Charts dropdown img
    • Chart Category

      • Bar Charts
      • Circle Graphs
      • Column Charts
      • Combo Charts
      • Comparison Charts
      • Line Graphs
      • PPC Charts
      • Sentiment Analysis Charts
      • Survey Charts
    • Chart Type

      • Box and Whisker Plot
      • Clustered Bar Chart
      • Clustered Column Chart
      • Comparison Bar Chart
      • Control Chart
      • CSAT Survey Bar Chart
      • CSAT Survey Chart
      • Dot Plot Chart
      • Double Bar Graph
      • Funnel Chart
      • Gauge Chart
      • Likert Scale Chart
      • Matrix Chart
      • Multi Axis Line Chart
      • Overlapping Bar Chart
      • Pareto Chart
      • Radar Chart
      • Radial Bar Chart
      • Sankey Diagram
      • Scatter Plot Chart
      • Slope Chart
      • Sunburst Chart
      • Tornado Chart
      • Waterfall Chart
      • Word Cloud
    • Google Sheets
      Microsoft Excel
  • Services
  • Pricing
  • Contact us
  • Blog
  • Support dropdown img
      • Gallery
      • Videos
      • Contact us
      • FAQs
      • Resources
    • Please feel free to contact us

      atsupport@chartexpo.com

Categories
All Data Visualizations Data Analytics Surveys
Add-ons/
  • Google Sheets
  • Microsoft Excel
  • Power BI
All Data Visualizations Data Analytics Surveys
Add-ons
  • Google Sheets
  • Microsoft Excel
  • Power BI

We use cookies

This website uses cookies to provide better user experience and user's session management.
By continuing visiting this website you consent the use of these cookies.

Ok

ChartExpo Survey


Home > Blog > Power BI

IF Statements in Power BI: Ultimate Guide

If statement in Power BI empowers you to navigate complex data scenarios effectively. Imagine yourself as a data analyst immersed in a critical project, grappling with extensive data sets.

IF Statements in Power BI

Amidst this challenge, Power BI emerges as a beacon of clarity, enabling you to visualize and disseminate insights seamlessly. Now, suppose you encounter specific conditions or criteria within your data landscape.

This is precisely where mastering the “IF” statement in Power BI becomes indispensable. Leveraging the Power BI IF statement equips you to:

Using the Power BI IF statement allows you to:

Create calculated columns: You can use the IF statement to create new columns in your dataset based on specified conditions. For example, you could categorize sales data as “High,” “Medium,” or “Low” based on predefined sales targets.

Apply conditional formatting: You can use the IF statement to apply conditional formatting to your visualizations. This, as a result, makes it easier to identify trends and outliers in your data.

Mastering the Power BI IF statement opens up a world of possibilities for analyzing and presenting data. Let’s learn how to harness this powerful feature to elevate your data analysis game.

Table of Content:

  1. What is the IF Statement in Power BI?
  2. DAX IF Function Syntax
  3. Why Use an IF Statement in Power BI?
  4. How to Use Power BI IF Statement?
  5. How to Use Multiple If Statements in Power BI?
  6. Examples of IF DAX Statement in Power BI
    1. Example#1
    2. Example# 2
  7. Some More Use Cases of  IF Statement in Power BI
    1. Build a Power BI New Column By Using an IF statement
    2. Power BI IF Statement With Multiple Conditions
    3. Nested IF Statement in Power BI
    4. IF statement With Text in Power BI
    5. IF Statement With Dates in Power BI 
    6.  IF Statement Between Two Values in Power BI
  8. Application of DAX IF Statement in Power BI: Step-By-Step
  9. Benefits of Using IF Statement in Power BI DAX
  10. Best Practices for Using Power BI Measure If Statement
  11. Common Issues with If Statements in Power BI
  12. IF Statement in Power BI: FAQs 
  13. Wrap Up

What is the IF Statement in Power BI?

Definition: The IF statement in Power BI is a logical function for creating conditional logic in data analysis. It evaluates a condition and returns one value if the condition is true and another if false. This function aids in creating calculated columns, creating measures, or transformations based on dynamic criteria.

DAX IF Function Syntax

IF(<logical_test>, <value_if_true>, <value_if_false>)

If the condition is true, the function returns the specified value_if_true; otherwise, it returns value_if_false. This flexibility allows for dynamic and responsive calculations, such as categorizing data, setting thresholds, or applying custom aggregations.

The IF statement is a cornerstone of logical expressions in Power BI. It offers a robust mechanism to tailor data transformations and analyses based on diverse criteria. Consequently, it contributes to the platform’s versatility in data modeling and visualization.

Why Use an IF Statement in Power BI?

Here are some reasons why incorporating IF statements in Power BI is indispensable for data modeling and data visualization.

  • Data Transformation

The IF statement allows you to manipulate or categorize data based on specific criteria conditionally. This capability facilitates the creation of tailored datasets that align with your analytical goals.

For example, you can create a new column that classifies products as “High,” “Medium,” or “Low” based on their sales figures.

ProductCategory = IF(Sales[Amount] > 1000, “High”, “Low”)

  • Filtering Data

IF statements serve as a dynamic filtering mechanism. You can apply conditions to selectively include or exclude data and streamline datasets to focus on relevant information. This, as a result, will enhance the precision of your analysis.

FilteredSales = CALCULATE(SUM(Sales[Amount]), Sales[Region] = IF(Sales[Year] = 2022, “North”, “South”))

  • Creating Flags or Indicators

IF statements are instrumental in generating flags or indicators within datasets. This involves assigning labels or markers to data points based on defined conditions. Consequently, it helps to simplify subsequent analyses and visualizations.

LateDeliveryFlag = IF(Orders[DeliveryDate] > Orders[ExpectedDeliveryDate], “Late”, “On Time”)

  • Dynamic Calculations

With IF statements, you can introduce dynamic calculations based on varying conditions. This is invaluable for creating measures or calculated columns that adapt to changing data scenarios to ensure analytical relevance.

DiscountedPrice = IF(Customer[Type] = “Preferred”, Sales[Amount] * 0.9, Sales[Amount])

  • Handling Errors or Missing Data

Power BI IF statements play a crucial role in error handling and addressing missing data. You can set conditions to manage potential errors, replacing or handling missing values appropriately to maintain data integrity.

ValidatedSales = IF(ISBLANK(Sales[Amount]), 0, Sales[Amount])

  • Scenario Analysis

IF statements facilitate scenario analysis by enabling you to define different outcomes for various conditions. This is particularly useful for exploring the impact of different variables or assumptions on analytical results, especially when using a Power BI connector to integrate these scenarios into your data analysis workflow.

ScenarioAnalysis = IF(Scenario[ScenarioType] = “Optimistic”, Sales[Amount] * 1.2, Sales[Amount] * 0.8)

How to Use Power BI IF Statement?

Here is a step-by-step guide on how to leverage the Power BI IF statement effectively.

  • Open Power BI Desktop

Launch Power BI Desktop to initiate your data analysis journey.

  • Load or Import Data

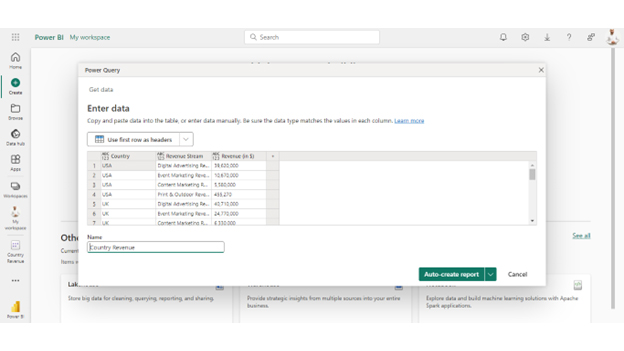
You can import data from various sources, including Excel, databases, or online services. A robust data foundation is essential for meaningful analyses.

  • Create a New Column or Measure

Decide whether you want to introduce the IF statement within a new column or a measure. Typically, columns are used for static calculations within your data table. Measures, on the other hand, are dynamic and suitable for calculations in your visuals.

  • Write the IF Statement

With your data loaded and your destination (column or measure) chosen, it’s time to write the IF statement. The syntax is straightforward: NewColumn = IF(<logical_test>, <value_if_true>, <value_if_false>)

Replace placeholders with your specific conditions and desired outcomes.

Example: Profitability = IF(Sales > Expenses, “Profitable”, “Not Profitable”)

In this example, the IF statement categorizes profitability based on whether sales exceed expenses.

  • Apply the IF Statement

Apply the IF statement to your dataset. You can drag it into the appropriate visual or utilize it in other calculations. The dynamic nature of the IF statement will adapt to changing conditions as you interact with your data.

  • Iterate and Refine

Data analysis is an iterative process. Refine your IF statements based on insights gained, changing requirements, or evolving business needs. Power BI’s iterative development environment allows you to make adjustments seamlessly.

How to Use Multiple If Statements in Power BI?

Follow these steps to use multiple IF statements in Power BI:

  1. Open Power BI Desktop – Load your dataset.
  2. Go to Data View – Click on “New Column” or “New Measure.”
  3. Use Nested IF in DAX – Write the formula:
    • NewColumn = IF([Sales] > 1000, “High”, IF([Sales] > 500, “Medium”, “Low”))
  4. Use SWITCH for Simplicity – Replace multiple IFs:
    • NewColumn = SWITCH(TRUE(), [Sales] > 1000, “High”, [Sales] > 500, “Medium”, “Low”)
  5. Press Enter – The new column will be created.
  6. Use in Reports – Drag the new column into your visuals.

Examples of IF DAX Statement in Power BI

Example#1

if statement example 1

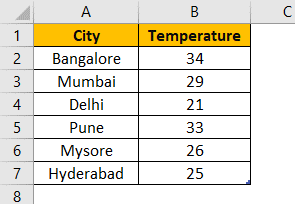
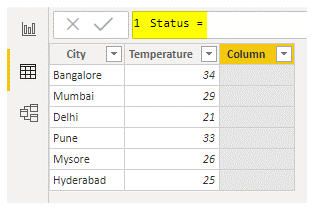
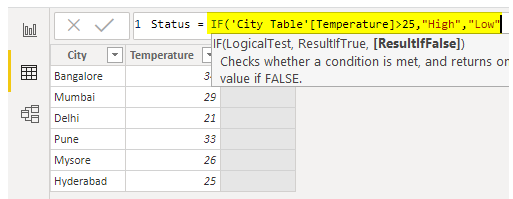
Using this data, we need to create a new column named “Status.”

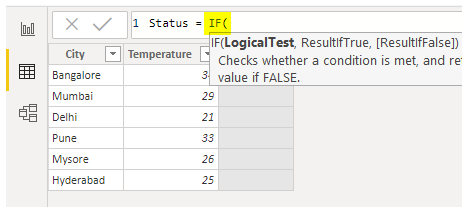
To determine the value for this new column, we will apply a specific criterion: if the temperature exceeds 25, the status should be labeled as “High.” Otherwise, it should be marked as “Medium.”

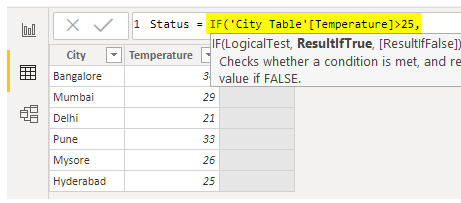
For instance, refer to the data tables above to implement the Power BI IF statement.

  1. Begin by copying the table into your Power BI file.
if statement example 2
  1. Right-click on the table and select “New Column.”
if statement example 3
  1. First, name this new column “Status.”
if statement example 4
  1. Then, open the IF DAX statement.
if statement example 5
  1. The logical test will involve checking if the temperature is greater than 25. To do this, first select the temperature column and apply the logical test as demonstrated below.

Once the logical test is set up, we need to define the outcome if the test returns TRUE.

if statement example 6
  1. Therefore, if the temperature is greater than 25, the result should be “High,” which needs to be enclosed in double-quotes.
if statement example 7
  1. If the logical test yields FALSE, we want the result to be “Low.”
if statement example 8
  1. Close the bracket and hit the “Enter” key to generate the result column.
if statement example 9

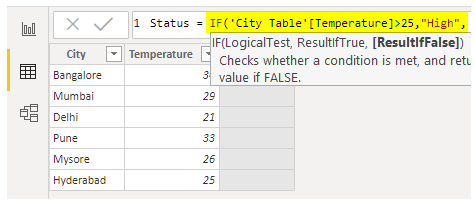
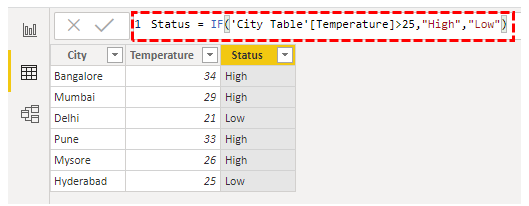
Now, we have a new result column that utilizes the logical IF formula.

Example# 2

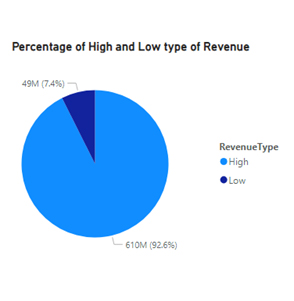
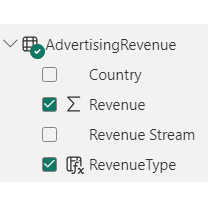
Let’s say you have the data below on advertising revenue of different countries. You need to categorize the revenue as High or Low.

IF Statements in Power BI 1

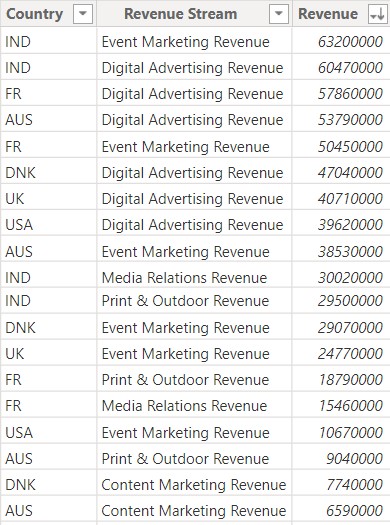
Following DAX is the perfect example for this case:

IF Statements in Power BI 2

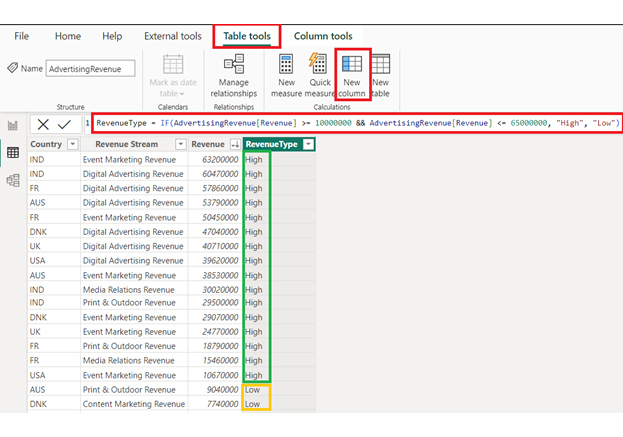
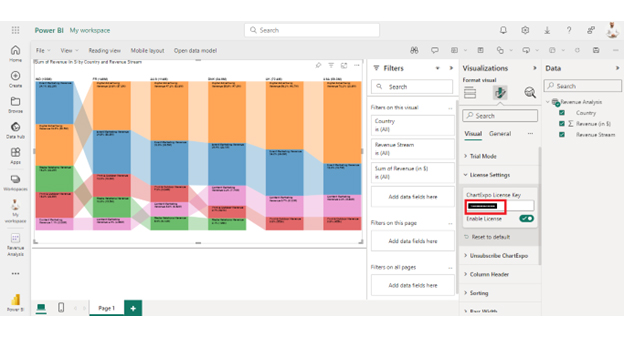
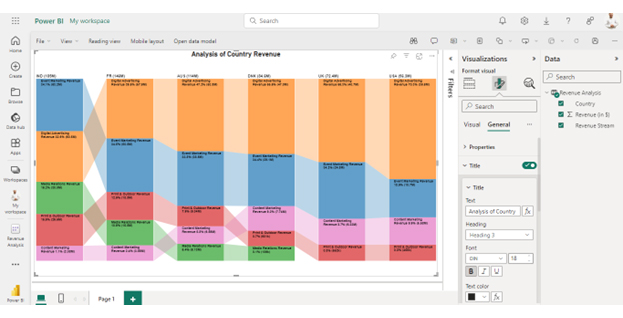
On the base of this new column, you can add a new summary chart in your dashboard.

IF Statements in Power BI 3IF Statements in Power BI 4

Some More Use Cases of  IF Statement in Power BI

Build a Power BI New Column by Using IF statement

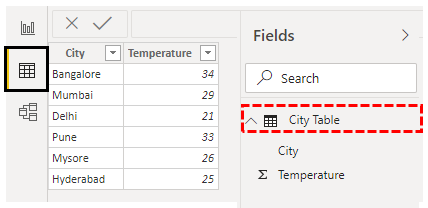
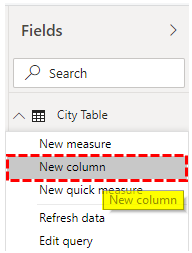
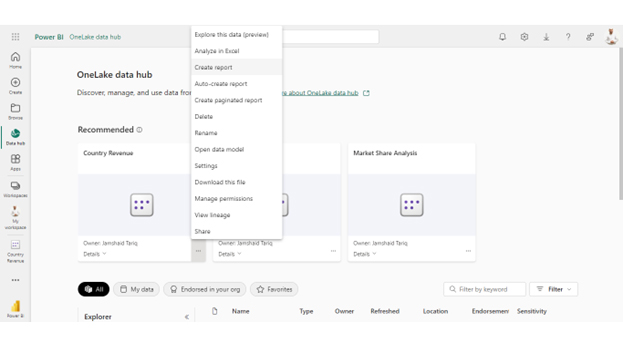
To create a new column in Power BI using an IF statement, navigate to the Data view, then select the table where you want to add the column. Click on “Modeling” in the ribbon and choose “New Column.” In the formula bar, enter your IF statement, following this structure:

NewColumnName = IF(condition, value_if_true, value_if_false)

Replace the condition with your logical test, and value_if_true and value_if_false with the values you want to return.

Power BI IF Statement With Multiple Conditions

You can write an IF statement with multiple conditions by using the SWITCH function or combining multiple IF statements. The syntax for a simple multiple-condition IF statement looks like this:

NewColumnName = IF(condition1, value_if_true1, IF(condition2, value_if_true2, value_if_false))

This allows you to evaluate different conditions sequentially.

Nested IF Statement in Power BI

A nested IF statement allows you to evaluate multiple conditions within a single formula. Here’s how to write it:

NewColumnName = IF(condition1, value_if_true1, IF(condition2, value_if_true2, IF(condition3, value_if_true3, value_if_false)))

This structure enables you to add as many conditions as needed, with each condition checked in order.

IF statement With Text in Power BI

When working with text in an IF statement, ensure to use quotation marks around your string values. For example:

NewColumnName = IF(TextColumn = “SpecificValue”, “Match”, “No Match”)

This formula checks if the TextColumn equals “SpecificValue” and returns “Match” or “No Match” accordingly.

IF Statement With Dates in Power BI

You can use IF statements to compare dates in Power BI by utilizing the DATE function or directly referencing date columns. Here’s an example:

NewColumnName = IF(DateColumn < DATE(2024, 1, 1), “Before 2024”, “In 2024 or later”)

This statement checks if the DateColumn is before January 1, 2024, returning the appropriate label.

 IF Statement Between Two Values in Power BI

To check if a value falls between two numbers, you can use the AND operator within your IF statement:

NewColumnName = IF(ValueColumn >= 10 && ValueColumn <= 20, “Within Range”, “Out of Range”)

This checks if ValueColumn is between 10 and 20, inclusive, returning “Within Range” or “Out of Range.”

Application of DAX IF Statement in Power BI: Step-By-Step

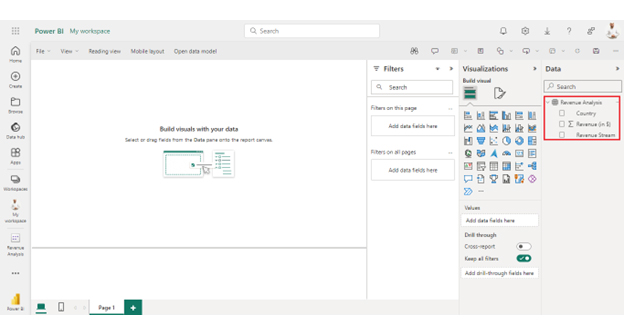
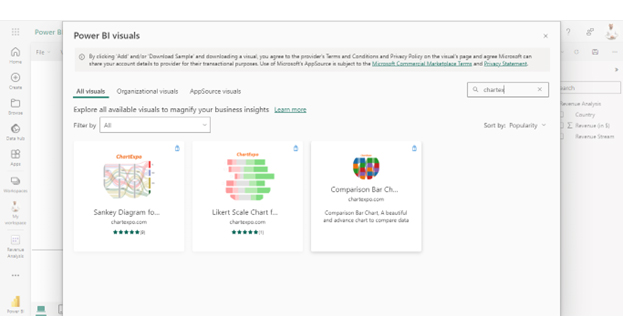
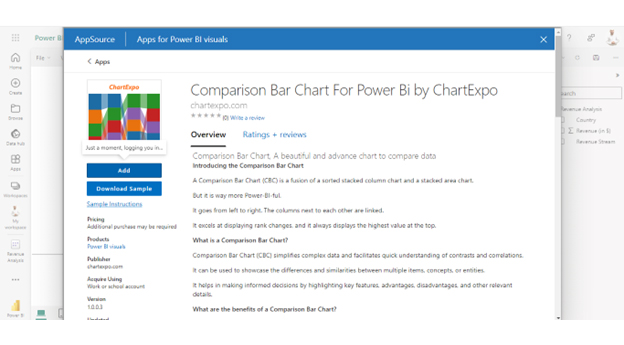
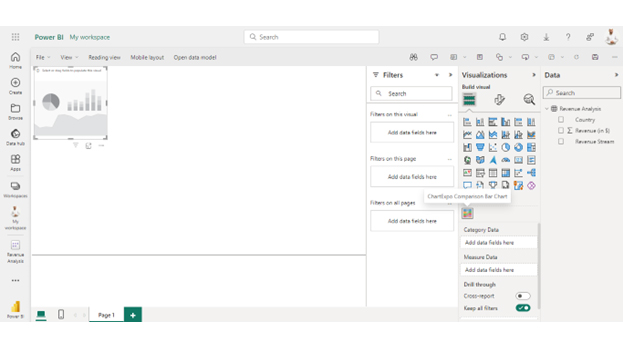
We’ve learned how to use the Power BI measure IF statement. Now, let’s learn how to create an appealing, insightful visualization of your data in Power BI.

Stage 1: Logging in to Power BI

  1. Log in to Power BI.
  2. Enter your email address and click the “Submit” button.
Enter email to login to Power BI
  • You are redirected to your Microsoft account.
  • Enter your password and click “Sign in“.
Enter Password to login to Power BI
  • You can choose whether to stay signed in.
Click on stay signed in
  • Once done, the Power BI home screen will open.

Stage 2: Creating a Data Set and Selecting the Data Set to Use in Your Chart

  • Go to the left-side menu and click the “Create” button.
  • Select “Paste or manually enter data“.
select Paste or manually enter data in Power BI ce487
  • We’ll use the sample data below for this example.
Country Revenue Stream Revenue (in $)
USA Digital Advertising Revenue           39,620,000
USA Event Marketing Revenue           10,670,000
USA Content Marketing Revenue             5,580,000
USA Print & Outdoor Revenue                 455,270
UK Digital Advertising Revenue           40,710,000
UK Event Marketing Revenue           24,770,000
UK Content Marketing Revenue             6,330,000
UK Print & Outdoor Revenue                 552,190
DNK Digital Advertising Revenue           47,040,000
DNK Event Marketing Revenue           29,070,000
DNK Content Marketing Revenue             7,740,000
DNK Print & Outdoor Revenue                 600,690
DNK Media Relations Revenue                 106,430
AUS Digital Advertising Revenue           53,790,000
AUS Event Marketing Revenue           38,530,000
AUS Content Marketing Revenue             6,590,000
AUS Print & Outdoor Revenue             9,040,000
AUS Media Relations Revenue             6,130,000
FR Digital Advertising Revenue           57,860,000
FR Event Marketing Revenue           50,450,000
FR Content Marketing Revenue             3,560,000
FR Print & Outdoor Revenue           18,790,000
FR Media Relations Revenue           15,460,000
IND Digital Advertising Revenue           60,470,000
IND Event Marketing Revenue           63,200,000
IND Content Marketing Revenue             2,080,000
IND Print & Outdoor Revenue           29,500,000
IND Media Relations Revenue           30,020,000
  • Paste the above data table in the Power Query Window.
  • Select the “Create a dataset only” option.
Create a dataset ce515
  • On the left-side menu, click “Data Hub“.
  • Power BI populates the data set list. (If you have not created a data set, refer to the Error! Reference source not found section).
  • Click on the “Create a report” dropdown.
Click on Data Hub ce515
  • Click the “Expand All” button.
  • You can see your chart metrics:
Click Expand All ce515
  • Click on “Get more visuals“.
  • Search for ChartExpo and select the Comparison Bar Chart:
click on to get more visuals ce515
  • Click the “Add” button.
click on add button ce515
  • You can now see the Comparison Bar Chart in the visualizations list.
Chart in the visualizations list ce515
  • In Visual, click License Settings, add the key, and enable the license.
  • After adding the key, you can see the comparison bar chart.
click License Settings ce515
  • Your Comparison Bar Chart in Power BI will appear as below.
Final IF Statements in Power BI

Insights

  • India leads in total revenue, with France, Australia, and Denmark following closely.
  • While “Digital Advertising” is a major revenue source globally, India stands out, with “Event Marketing” taking the lead.
  • “Media Relations” revenue is absent in the US and UK.
  • France shows a lower reliance on content marketing compared to other streams. Conversely, India, despite high overall revenue, has the lowest contribution from content marketing.

Benefits of Using IF Statement in Power BI DAX

The application of the IF statement in Power BI DAX extends far beyond conditional logic. It offers a multifaceted toolkit for your data modeling and analytical needs.

Here are the benefits of using the IF statement in Power BI DAX.

  • Conditional logic: At its core, the DAX IF statement provides a robust framework for introducing conditional logic into calculations. This foundational capability allows you to define outcomes based on specified conditions, laying the groundwork for tailored analyses.
  • Data transformation: The IF statement facilitates data transformation by allowing you to modify or categorize data conditionally. This adaptability is pivotal for creating datasets that align precisely with analytical objectives.
  • Flexibility: Flexibility is a hallmark of the DAX IF statement. Its dynamic nature enables you to create flexible calculations that respond to changing data scenarios. As a result, it provides adaptability in various analytical contexts.
  • Flag creation: DAX IF is instrumental in flag creation, adding labels or markers to data points based on specified conditions. This streamlined approach enhances the interpretability of datasets, simplifying subsequent analyses.
  • Error handling: You can set conditions to address potential errors. This helps to ensure data integrity and maintain the reliability of analytical results.
  • Scenario analysis: DAX IF empowers you to conduct scenario analysis by defining different outcomes for varied conditions. This functionality is pivotal for exploring the impact of different variables, assumptions, or business scenarios on analytical results.
  • Readability: The IF statement contributes to the readability of DAX formulas. Encapsulating conditional logic within a concise structure enhances the clarity of calculations. It makes formulas more understandable for users and collaborators.
  • Dynamic calculations: You can create measures or calculated columns that adapt to changing data scenarios. This ensures that calculations remain relevant and responsive.
  • Filtering data: The IF statement allows you to include or exclude data based on specified conditions selectively. This enhances the precision of analyses and ensures a targeted focus on relevant information.
  • Improved decision-making: The DAX IF statement provides a nuanced approach to data modeling and analysis. It equips you with the tools to derive meaningful insights and make informed decisions that drive business success.

Best Practices for Using Power BI Measure If Statement

1. Keep Logic Simple

  • Avoid overly complex nested IF statements. Simplifying your logic enhances readability and maintainability.

2. Use SWITCH for Multiple Conditions

  • For multiple conditions, opt for the SWITCH function instead of nested IFs to streamline your code and make it easier to understand.

3. Optimize Performance

  • Minimize the use of IF statements in large datasets. Create calculated columns or measures with conditional logic only when necessary to boost performance.

4. Leverage DAX Functions

  • Combine IF statements with DAX functions like AND, OR, or NOT to enhance your logical tests and create more flexible conditions.

5. Use Variables for Complex Logic

  • For complicated scenarios, use variables (with the VAR keyword) to store intermediate results. This simplifies your IF statements and can improve calculation performance.

Common Issues with If Statements in Power BI

1. Complexity from Nested IFs

  • Using too many nested IF statements can make formulas hard to read and maintain, increasing the chance of errors.

2. Performance Issues

  • Excessive use of IF statements in large datasets can lead to slow report performance, causing delays in calculations.

3. Data Type Mismatches

  • Mismatched data types in comparisons can result in errors or unexpected results, so ensure that all comparisons involve compatible types.

4. Logical Errors

  • Incorrect logic in conditions can yield inaccurate results, necessitating thorough verification of the intended logic.

5. Handling Blank Values

  • IF statements may not adequately address blank or null values, potentially leading to calculation errors. Use functions like ISBLANK or COALESCE to manage these cases.

IF Statement in Power BI: FAQs

What is the IF statement in Power BI?

The IF statement in Power BI is a versatile function for introducing conditional logic. It allows you to create dynamic calculations, categorize data, and make decisions based on specific conditions. This, as a result, enhances the flexibility and responsiveness of data analyses.

Can you write an IF statement in Power BI?

Yes, you can write an IF statement in Power BI. Use the DAX (Data Analysis Expressions) language within calculated columns or measures. The syntax is straightforward: IF(<logical_test>, <value_if_true>, <value_if_false>). Customize it based on your specific conditions and desired outcomes.

Can you use if statements in DAX?

Yes, DAX (Data Analysis Expressions) supports IF statements. Use the syntax IF(<logical_test>, <value_if_true>, <value_if_false>) within calculated columns, measures, or calculated tables. Customize conditions and outcomes to introduce dynamic and conditional logic into your Power BI data models.

Wrap Up

Leveraging the IF statement in Power BI is a transformative journey in data modeling and analysis.

First, you open Power BI Desktop to initiate the process. Then, you load and import data to ensure a robust dataset for meaningful analyses. The decision to create a new column or measure comes next, each serving a purpose in your analysis.

Writing the IF statement is where the real power unfolds. The syntax, as simple as IF(<condition>, <value_if_true>, <value_if_false>), encapsulates dynamic possibilities within data. This function allows you to categorize data dynamically and make decisions based on changing conditions.

The applicability of the IF statement is boundless. It doesn’t matter whether it is categorizing data, creating flags, or making condition-based decisions. This function enhances the flexibility of data analyses in Power BI.

Moreover, the iterative and user-friendly environment allows you to apply and refine IF statements seamlessly. This ensures a dynamic approach to deriving insights from data.

Mastering the Power BI IF statement in modern decision-making is not just a skill it’s a strategic advantage. It positions you to navigate the data landscape complexities and derive insights that align precisely with organizational objectives.

Get started with the IF statement in Power BI today to navigate and thrive in the data-driven landscape seamlessly.

How much did you enjoy this article?

PBIAd1
Start Free Trial!
133440

Related articles

next previous
Power BI12 min read

Power BI Group By Guide for Effective Data Insights

Learn how Power BI Group By helps you aggregate data, clarify trends, and create reports by grouping values to make large datasets manageable & insightful.

Power BI12 min read

How to Create Sankey Diagram in Microsoft Power BI?

Learn How to Create Sankey Diagram in Microsoft Power BI using Desktop & Web Service. What they are and how to use them effectively.

Power BI8 min read

Power BI Artificial Intelligence: Insights Using Visuals

Discover all there is to know about the Power BI artificial intelligence. You'll also discover how AI is used in Power BI, and how to use it for analysis and more.

Power BI9 min read

Budgeting in Healthcare: Use Visuals to Spot Budget Gaps

This guide helps you discover what budgeting in healthcare is. You'll also discover the factors that affect hospital budgets and types of budgeting in healthcare.

Power BI9 min read

Predictive Analytics in Power BI for Making Insightful Visuals

This guide shows you everything you need to know about Predictive Analytics in Power BI. It also shows you how it works, and how to interpret the results.

ChartExpo logo

Turn Data into Visual
Stories

CHARTEXPO

  • Home
  • Gallery
  • Videos
  • Services
  • Pricing
  • Contact us
  • FAQs
  • Privacy policy
  • Terms of Service
  • Sitemap

TOOLS

  • ChartExpo for Google Sheets
  • ChartExpo for Microsoft Excel
  • Power BI Custom Visuals by ChartExpo
  • Word Cloud

CATEGORIES

  • Bar Charts
  • Circle Graphs
  • Column Charts
  • Combo Charts
  • Comparison Charts
  • Line Graphs
  • PPC Charts
  • Sentiment Analysis Charts
  • Survey Charts

TOP CHARTS

  • Sankey Diagram
  • Likert Scale Chart
  • Comparison Bar Chart
  • Pareto Chart
  • Funnel Chart
  • Gauge Chart
  • Radar Chart
  • Radial Bar Chart
  • Sunburst Chart
  • see more
  • Scatter Plot Chart
  • CSAT Survey Bar Chart
  • CSAT Survey Chart
  • Dot Plot Chart
  • Double Bar Graph
  • Matrix Chart
  • Multi Axis Line Chart
  • Overlapping Bar Chart
  • Control Chart
  • Slope Chart
  • Clustered Bar Chart
  • Clustered Column Chart
  • Box and Whisker Plot
  • Tornado Chart
  • Waterfall Chart
  • Word Cloud
  • see less

RESOURCES

  • Blog
  • Resources
  • YouTube
SIGN UP FOR UPDATES

We wouldn't dream of spamming you or selling your info.

© 2025 ChartExpo, all rights reserved.