Categories
In the ever-evolving landscape of data management, it’s crucial to stay informed about tools and platforms that can streamline your workflow. Curious about ‘What Is Microsoft Dataverse’?


Microsoft Dataverse is a powerful cloud-based data storage and management platform. It allows you to securely store and manage diverse data types, including structured and unstructured data. With Dataverse, you can create custom databases, tables, and fields to suit your needs.
Dataverse provides a user-friendly interface for data entry, retrieval, and manipulation. It seamlessly integrates with Microsoft Power Apps and Power Automate, enabling you to build powerful apps and workflows. This integration empowers you to create personalized experiences, automate processes, and gain valuable insights from your data.
This blog post explores the features, benefits, and real-world applications of MS Dataverse. You’ll understand how it can revolutionize how you store, manage, and utilize your data.
Let’s dive in and discover the power of Microsoft Dataverse together.
Definition: Microsoft Dataverse is a cloud-based data platform that securely stores and manages data used by business applications. It serves as a central repository for information, offering a unified and scalable solution for app development. Microsoft Dataverse originated as the Common Data Service in 2016. Then, it evolved to Dataverse in 2020 to emphasize its broader capabilities beyond common data models.
Dataverse integrates seamlessly with Microsoft Power Platform, allowing you to build, customize, and extend applications without extensive coding. Its common data model provides a standardized and consistent structure, facilitating interoperability between apps and reducing data silos.
With Dataverse, you can define data models, create relationships, and enforce business rules. This helps to ensure data integrity and reliability across applications.
Microsoft Dataverse addresses the need for a comprehensive, integrated, and secure data management solution. Here is a detailed discussion of why we need it.
Microsoft Dataverse is a versatile solution suitable for various professionals and organizations. It offers a unified data platform that aligns with the diverse needs of modern organizations.
Business analysts can benefit from Microsoft Dataverse as it provides a user-friendly environment for managing and analyzing data. It allows creating and customizing applications without extensive coding, enabling a more hands-on approach to data-driven decision-making.
App developers find Microsoft Dataverse valuable for its seamless integration with Power Apps. It offers a standardized data platform that simplifies database design. This reduces development effort and allows developers to focus on building application logic and functionality.
IT professionals leverage Microsoft Dataverse for its scalability, security features, and compatibility with the broader Microsoft ecosystem. It provides a foundation for managing and storing data, ensuring IT infrastructure aligns with organizational data management needs.
Data professionals, including database administrators and engineers, benefit from Dataverse’s capability to handle and structure data. It provides a unified data platform that supports data modeling, relationships, and security, streamlining data management tasks.
Organizations with multiple applications can utilize Dataverse to centralize and unify their data. It enables seamless data sharing and integration among applications within the Microsoft Power Platform, promoting consistency and collaboration.
Companies embracing the broader Microsoft Power Platform, including Power BI and Power Virtual Agents, should use Dataverse. Why? It serves as the common data platform that facilitates interoperability among these tools. Moreover, it enhances the overall efficiency and effectiveness of the Power Platform ecosystem.
Collaborative teams within an organization benefit from Dataverse’s ability to streamline communication and data sharing. It provides a centralized platform where teams can collaborate on the development and deployment of applications. This fosters a more cohesive and efficient working environment.
Here’s a comparison table for Dataverse vs. SQL Server:
| Feature | Dataverse | SQL Server |
| Purpose | Cloud-based data platform for low-code apps | Full-fledged relational database for complex data management |
| Deployment | Cloud-based (Microsoft Power Platform) | On-premises, cloud (Azure SQL), or hybrid |
| Customization & Control | Predefined tables, low-code environment | Full control over database design, indexing, and queries |
| Integration | Seamless with Power Apps, Power Automate, and Dynamics 365 | Works with multiple platforms, including Azure, BI tools, and third-party applications |
| Security | Built-in role-based security, encryption, and compliance | Advanced security configurations, including encryption and authentication |
| Scalability | Suitable for business applications with structured data | Handles large-scale, high-performance transactional and analytical workloads |
| Use Case | Best for business apps, automation, and low-code development | Ideal for enterprise-grade applications, large databases, and advanced analytics |
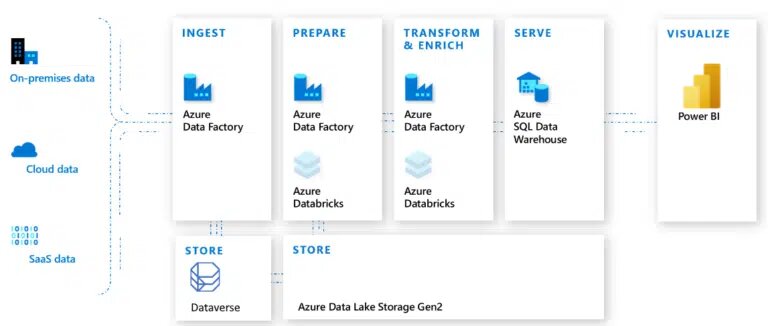
Microsoft Dataverse works seamlessly with Power BI by acting as a centralized data storage platform that connects business applications with analytics tools. Here’s how it functions in Power BI:
Dataverse stores structured business data in a cloud-based environment with predefined tables and relationships. This ensures data consistency and easy accessibility for Power BI reporting.
Power BI connects directly to Dataverse, allowing users to import or query data without needing complex ETL processes. This makes data retrieval faster and more efficient.
Data updates in Dataverse are automatically reflected in Power BI dashboards and reports, ensuring users always work with the latest insights.
Dataverse enforces security policies, ensuring that only authorized users can access or modify data in Power BI reports, maintaining compliance and data integrity.
Power BI can leverage Dataverse’s built-in business rules, relationships, and AI-powered insights for advanced analytics, providing deeper and more meaningful business intelligence.
Integrating data into Microsoft Dataverse is straightforward, enabling organizations to centralize information from various sources. It supports APIs, Power Automate, and third-party tools, allowing easy import, export, and synchronization of data for a unified view.
Microsoft Dynamics 365 is integrated with Dataverse, enhancing functionality by serving as its underlying data platform. This integration allows seamless data sharing, fostering collaboration and informed decision-making across applications.
Dataverse can manage various data formats, including unstructured and structured data. This flexibility allows organizations to store and analyze diverse data types in a centralized location, maximizing the value of their data assets.
Dataverse is compatible with numerous software applications, including Microsoft tools like Power BI and Power Apps, as well as third-party solutions. This interoperability enables organizations to enhance their data-driven initiatives easily.
Dataverse utilizes advanced analytics and machine learning to uncover valuable insights within data. This capability helps organizations identify trends and correlations, empowering informed decision-making and operational optimization.
Dataverse ensures data security through a multi-level framework, including role-based access control and encryption for data at rest and in transit. Compliance with industry standards further strengthens its security, safeguarding critical information.
You can safely store your business information in Dataverse and create sophisticated applications in Power Apps that allow users to manage this data effectively. Moreover, you can integrate this data into solutions that leverage Power Automate, Power BI, and Dynamics 365.
By default, the app links to Dataverse tables within the current environment. If your app is transferred to a different environment, the connector will automatically access the data in that new location. This functionality is particularly useful for applications that operate within a single environment or those that adhere to an application lifecycle management (ALM) process, transitioning from development to testing and finally to production.
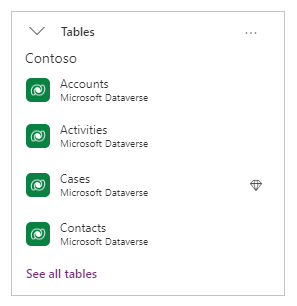
When you incorporate data from Dataverse, you have the option to change the environment and select one or more tables. By default, the application connects to data in the environment currently in use.
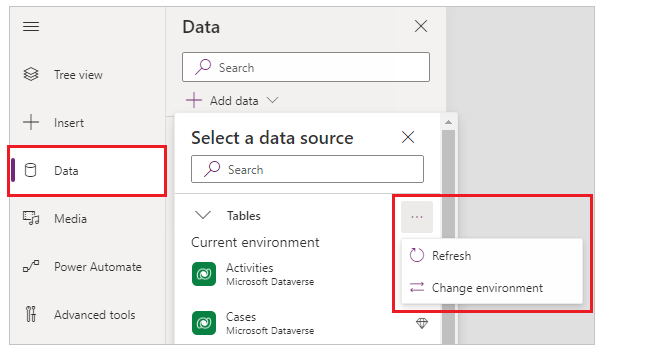
If you choose to change the environment, you can designate a different one to source data either exclusively or in addition to the current environment.
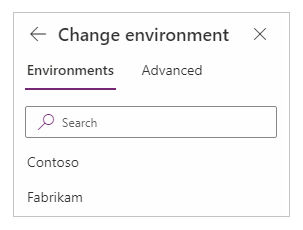
The name of the selected environment will appear below the table list.
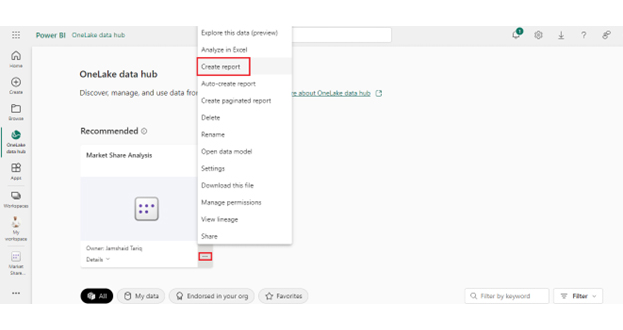
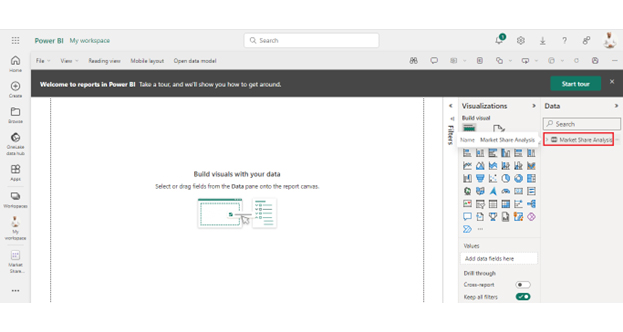
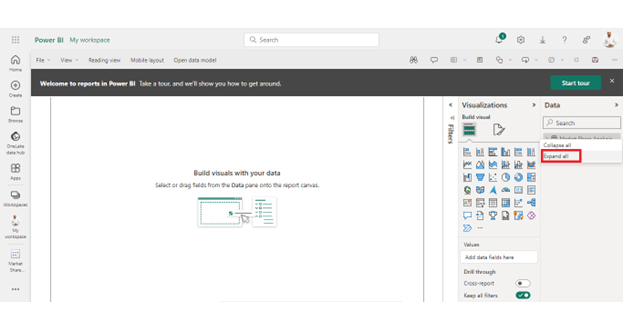
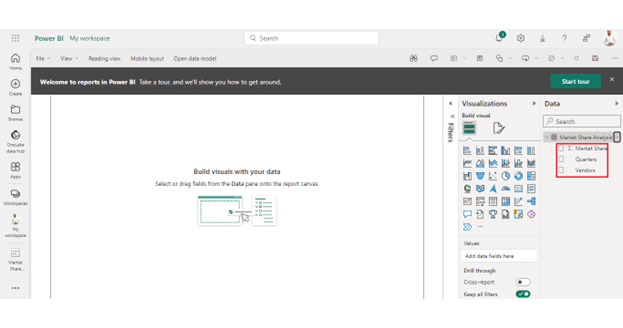
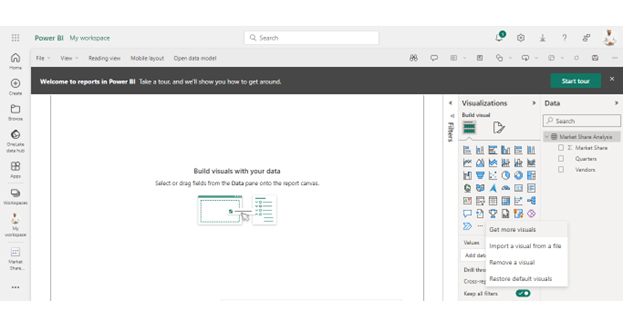
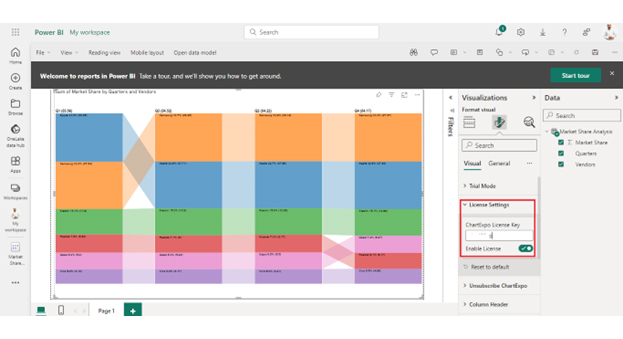
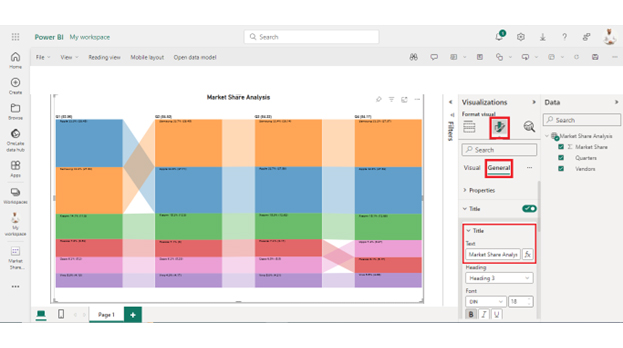
Follow the steps below to use the Power BI Dataverse.


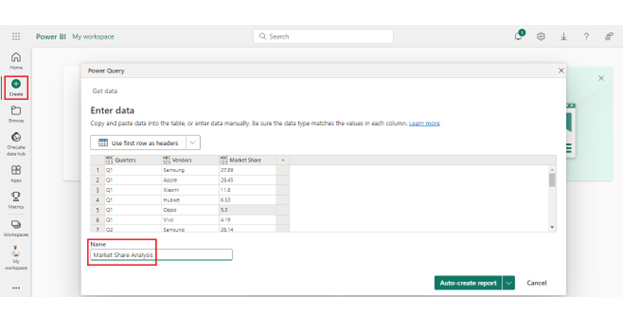
| Quarters | Vendors | Market Share |
| Q1 | Samsung | 27.69 |
| Q1 | Apple | 28.45 |
| Q1 | Xiaomi | 11.8 |
| Q1 | Huawei | 6.53 |
| Q1 | Oppo | 5.3 |
| Q1 | Vivo | 4.19 |
| Q2 | Samsung | 28.14 |
| Q2 | Apple | 27.58 |
| Q2 | Xiaomi | 12.62 |
| Q2 | Huawei | 6.17 |
| Q2 | Oppo | 5.5 |
| Q2 | Vivo | 4.21 |
| Q3 | Samsung | 28.45 |
| Q3 | Apple | 27.71 |
| Q3 | Xiaomi | 12.9 |
| Q3 | Huawei | 6 |
| Q3 | Oppo | 5.29 |
| Q3 | Vivo | 4.17 |
| Q4 | Samsung | 27.97 |
| Q4 | Apple | 27.62 |
| Q4 | Xiaomi | 12.68 |
| Q4 | Huawei | 5.17 |
| Q4 | Oppo | 6.07 |
| Q4 | Vivo | 4.66 |
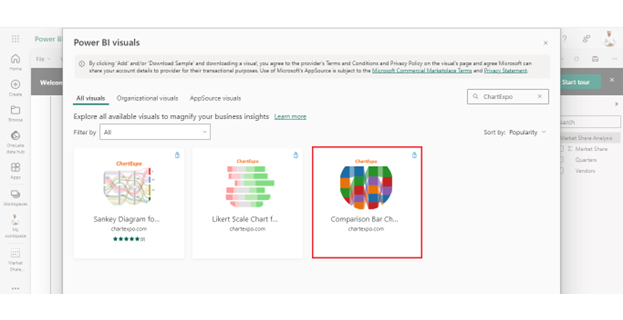
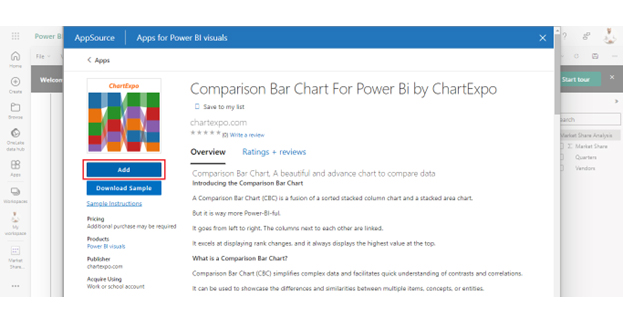

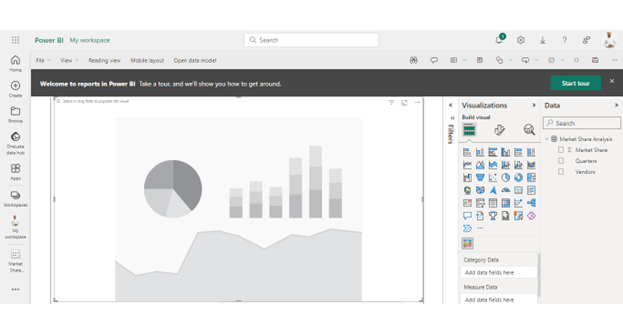
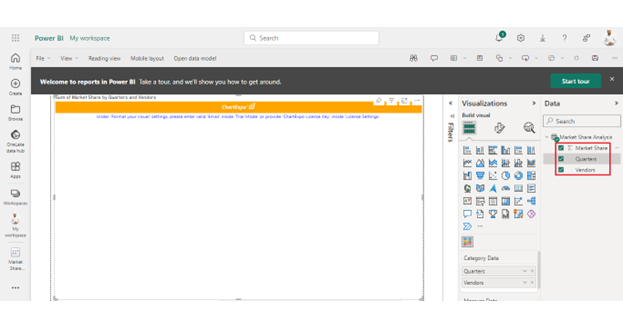
The following video will help you create a Comparison Bar Chart in Microsoft Power BI.
Dataverse integrates effortlessly with Power BI, allowing users to access, analyze, and visualize data in real time. This eliminates the need for complex data extraction and transformation (ETL) processes, making reporting more efficient.
It provides a unified cloud-based data environment, ensuring consistency across Power Apps, Power Automate, and Power BI. This eliminates data silos and improves collaboration across different teams.
With role-based access control, encryption, and compliance with industry standards, Dataverse ensures that sensitive business data is secure while still being accessible to authorized Power BI users.
Built-in validation, business rules, and data governance features help maintain accuracy and integrity. Power BI users benefit from cleaner, more reliable data for better decision-making.
Dataverse enables automatic data refresh with Power BI, ensuring that reports and dashboards always reflect the latest updates without manual intervention.
Microsoft Dataverse offers flexible storage capacity based on the type of data and the specific licensing plan. Here’s a general overview of its storage capabilities:
Dataverse is not just a database; it is a cloud-based data platform by Microsoft that securely stores and manages data for business applications. It provides relational database capabilities along with advanced features like security, business logic, and integration with Power Apps and Power BI.
While it includes database-like storage, it is designed for scalable, low-code data management across organizations.
Microsoft Dataverse in Power BI is a data connector enabling integration of Power BI with the Dataverse platform. It allows Power BI users to connect, analyze, and visualize data in Dataverse, streamlining data analytics and reporting.
To use Dataverse data in Power BI, connect to Dataverse using the built-in Dataverse connector. Select the desired tables/entities, build queries, and load data into Power BI. Then, utilize this data to create visualizations, dashboards, and reports within Power BI.
Microsoft Dataverse is pivotal within the Microsoft Power Platform as a unified and scalable data platform. Curious about ‘What Is Microsoft Dataverse’? Its significance lies in its ability to streamline and centralize data management for organizations across various industries.
Dataverse’s unified data model ensures consistency by providing a standardized framework for storing and organizing data. This foundational feature promotes interoperability among applications, contributing to a more cohesive and integrated business environment.
The platform’s centralized data storage empowers organizations to manage data securely in a single repository. This enhances data accessibility and facilitates efficient governance and compliance with industry standards and regulations.
Moreover, the scalability of Dataverse allows it to adapt to the evolving needs of businesses. Whether handling large datasets or accommodating increasing workloads, Dataverse provides a scalable solution for various organizations.
The synergy of Microsoft Dataverse, ChartExpo, and Power BI forms a powerful trifecta in data management and visualization. Microsoft Dataverse is the central hub, providing a unified data platform that seamlessly integrates with Power BI. ChartExpo’s dynamic visualizations enhance the interpretation of Dataverse data, offering a visually intuitive representation.
Embracing Microsoft Dataverse with ChartExpo and Power BI is not just a technological collaboration. It’s a strategic approach to unlocking the full potential of data for informed decision-making.
Do not hesitate. Embrace this integration and revolutionize how you work with data.
How much did you enjoy this article?


Discover diverse and high-quality Power BI report examples for inspiration and insights. Elevate your reporting with strategic visualization techniques.

A Customer Relationship Management Dashboard centralizes data, tracks key metrics, and drives smarter business decisions. Discover now!

Explore Healthcare Dashboard Examples and learn how to turn complex healthcare data into clear, actionable insights for better decision-making.


