Categories
By ChartExpo Content Team
Predicting the future seems impossible. But what if past data shows you the way?
Time series forecasting uses historical information to anticipate what’s ahead. Think of a retailer stocking shelves right before holiday shoppers flood stores. Or an airline setting ticket prices to match upcoming travel demand. This method helps companies prepare effectively for upcoming events.


Businesses rely on time series forecasting to reduce risk and seize opportunities. Accurate forecasts mean fewer surprises. With the right data, companies manage inventory, staffing, and resources without guesswork.
Ready to sharpen your forecasting skills? Keep reading to see how time series forecasting can benefit your business.
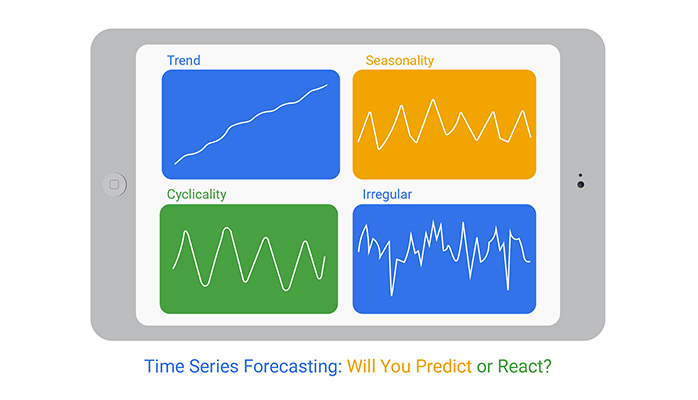
Time series forecasting involves using past data sequences to predict future events. This data is time-stamped and can be analyzed for trends, seasonality, and patterns. Businesses use these forecasts to plan inventory, budget, staff, and other operational needs. Accurate forecasts are crucial for maintaining efficiency and gaining a competitive advantage.
Inaccurate forecasts can lead to significant losses for businesses. Overestimating demand can cause excess inventory, tying up capital that could be used elsewhere. Underestimating, however, can lead to stockouts, missed sales, and unhappy customers.
These forecasting errors can damage a business’s reputation and financial stability.
Effective time series forecasting methods can significantly enhance business strategy. They enable precise planning and resource allocation, ensuring operational efficiency.
Conversely, relying on outdated or poorly implemented forecasting methods can lead to misguided strategies, wasted resources, and lost opportunities.
Many companies overlook the benefits of time series analysis forecasting. This oversight can hinder their ability to compete in today’s data-driven market. Companies that invest in advanced forecasting techniques can better anticipate market trends, adapt quickly to changes, and outperform competitors who fail to leverage this critical tool.
Ever listened to a song with too much background noise? It’s annoying! Similarly, noisy data can mess with your forecasting. Enter the moving average technique. It simplifies your data series by averaging a number of past data points.
This smoothing process highlights important trends by reducing random fluctuations, making your forecasts clearer and more reliable.
More ingredients don’t always make a better soup. Similarly, throwing in more variables into your time series model doesn’t guarantee better forecasts. Each additional variable introduces complexity, which can cloud the main trends rather than clarifying them.
Stick to relevant variables that directly impact your forecast to maintain accuracy.
Here’s a quick tale: a forecaster uses flawed data to predict stock trends. Instead of profits, they face huge losses. Dirty data can lead to false patterns and inaccurate predictions. Always double-check your dataset for cleanliness to avoid the pitfalls of unreliable forecasting.
Imagine a retailer predicting holiday sales with outdated sales data. They end up with a mountain of unsold toys. That’s a real headache! This scenario shows how relying on incorrect or outdated information can lead to costly mistakes like overstocking.
Always use the most current and accurate data for forecasting.
The Scatter graph clearly show how messy data can ruin forecasting accuracy. Each point represents a prediction compared to the actual outcome. Points close to a diagonal line mean accurate forecasts with clean data.
Points scattered far from the line reveal forecasts affected by dirty data. These points show us errors due to missing values or incorrect entries. The chart quickly reveals the negative effects of bad data on predictions.
Seeing this scatter plot helps you realize why clean data truly matters. If data’s messy, your forecast will stray wildly, turning plans into guesswork. With clean data, your forecasts stick close to reality, giving confidence in predictions.
Clean data matters whether forecasting sales, inventory, or even the weather. Good forecasts rely on careful data preparation before you begin the analysis. Don’t skip this step, or your forecasts could become expensive guessing games.
In time series forecasting, more data does not always mean better accuracy. The myth that simply adding more data improves forecasts leads many into the overfitting trap. Overfitting occurs when a model learns not only the underlying pattern but also the noise in the data. This noise does not generalize to new data, resulting in poor predictions.
Imagine training a weather forecast model. You feed it ten years of data, thinking this will predict future weather perfectly. However, the model starts to “think” that minor fluctuations, like a random windy day, are crucial. When you use this model to predict future weather, it gives inaccurate forecasts, as it emphasizes the noise over the actual signal.
To avoid this, it’s pivotal to balance the amount of data with the complexity of the model. Techniques like cross-validation can help test if a model is just memorizing the data or if it truly understands the pattern. Remember, efficient models are those that learn the trend, not the exceptions!
Relying solely on AI for forecasting can be risky due to model bias. A common misconception is that AI models, with their complex algorithms, are always accurate. However, these models can only learn from the data they are given. If this data is biased, the forecasts will be too.
For instance, if a retail sales prediction AI is trained on data from just one specific region or during a particular season, it may not accurately predict sales in different regions or seasons. The model develops a bias based on the data it has seen, leading to skewed results.
Businesses must diversify their datasets and continually update their models with new information. It’s also wise to blend AI insights with human judgment. Remember, AI is a tool, not a magician!
Understanding when to use time series analysis versus regression analysis is crucial for accurate forecasting. Time series analysis is ideal when you are dealing mainly with data that is sequential in time. It considers the time component as a crucial variable, focusing on trends, seasonality, and cycles.
On the other hand, regression analysis is best when you are examining the relationship between a dependent variable and one or more independent variables, without focusing on the element of time. It’s great for scenarios where you need to understand the impact of variables like price changes or marketing spend on sales.
For example, use time series analysis to forecast stock prices where past trends and patterns can predict future prices. Use regression analysis to understand how changes in marketing budget impact sales figures. Choosing the right approach will lead to more accurate predictions and strategies.
A Tornado Chart is a useful tool to visualize the risk versus reward in different forecasting models. It helps businesses assess which models have the potential for high rewards but also carry high risks. The chart displays sensitivity analysis results, showing how changes in input variables impact outputs.
Think of a business deciding between several forecasting models. The Tornado Chart can highlight which models are most sensitive to changes in market conditions. A model that predicts revenue might show high potential rewards but could be very sensitive to market size fluctuations.
Using a Tornado Chart, decision-makers can visually identify which risks are worth taking and which models offer the safest returns. It’s an essential tool for any business that relies on forecasts to make informed decisions.
The following video will help you to create the Tornado Chart in Microsoft Excel.
The following video will help you to create the Tornado Chart in Google Sheets.
ARIMA, standing for AutoRegressive Integrated Moving Average, thrives in scenarios where data shows clear trends or seasonal patterns. Ideal for short-term forecasts, ARIMA makes predictions based on prior values and errors in the data.
If your time series data is non-stationary—meaning its properties change over time—ARIMA could be your go-to by differencing the data, thus stabilizing the mean.
Traditional methods, like ARIMA or Exponential Smoothing, rely heavily on understanding and capturing data patterns manually. These methods work well with less complex data and are easier to explain and understand.
On the flip side, AI-based methods, using algorithms like Long Short-Term Memory (LSTM) networks, excel in handling large volumes of data with complex patterns. These models learn from the data, adjusting their predictions based on newly ingested information, making them more dynamic and scalable.
Industries vary, and so do their forecasting needs. For example, retail benefits immensely from LSTM models that can predict consumer behavior patterns. In contrast, finance often relies on ARIMA for stock price predictions due to its effectiveness with time series data that follows trends or cycles.
Matrix chart visually compares forecasting models based on accuracy, complexity, and data requirements. It highlights each model’s ability to handle trends, seasonality, and anomalies.
Matrix chart simplifies decision-making. It saves time by highlighting which models fit specific forecasting needs.
Ever found your forecasts turning out all wrong? It’s likely you’ve got bad data on your hands. Spotting errors early in time series forecasting is essential.
Look out for outliers, missing values, or incorrect data entries. These can throw off your entire analysis. Regular audits and visual inspections of your data can catch these mistakes. Remember, cleaner data leads to more accurate forecasts.
Choosing the wrong model can lead to forecast failures. For time series, not just any regression will do. You need to match the model to your data’s nature. For instance, using linear regression without checking for non-linearity in your time series can skew results. Always plot your data first. This simple step can reveal the model that fits best.
Have you ever noticed sales peaking every December but your forecast didn’t see it coming? That’s ignoring seasonality. Time series forecasting must account for patterns and trends. Failing to do so can lead to forecasts that are way off mark. Tools like decomposition methods can help you spot and measure these patterns.
Time series machine learning transforms forecasting by adapting to data’s dynamic nature. Traditional models often falter with non-linear patterns, where machine learning thrives.
By applying models like LSTM (Long Short-Term Memory), machine learning not only predicts future values but also understands sequences, crucial for accurate forecasting in fields like
.predictions or weather forecasting.
This adaptability makes it indispensable for modern needs, where data patterns shift rapidly.
Despite the buzz around AI, old-school regression analysis holds its ground in scenarios where relationships between variables are linear and well-defined. Its simplicity and transparency offer ease of use and understanding, crucial in fields where explaining model decisions is as important as accuracy.
For small datasets or projects with limited computational resources, regression analysis offers a cost-effective and efficient solution.
The debate between AI and human forecasting hinges on the complexity of the task and the need for nuanced judgment. AI offers speed and precision, processing large datasets swiftly and with high accuracy.
However, humans bring context, ethics, and flexibility to the table—traits that AI can overlook. The choice often involves a blend of both, with AI handling data-driven tasks and humans making final judgments on complex, multifaceted issues.
Hedge funds increasingly lean on AI for market predictions, leveraging its ability to analyze vast quantities of data quickly. AI models identify potential market movements based on historical data trends, offering hedge funds a competitive edge.
However, reliance on AI can backfire during unprecedented market events where historical data might not predict future outcomes accurately. These scenarios reveal the limits of AI in adapting to new, unforeseen market conditions.
Here’s the scoop: if you feed garbage to your forecasting model, expect garbage predictions in return. Time series forecasting relies heavily on past data patterns to predict future trends.
Feed it inaccurate or irrelevant data, and you’ll get forecasts that are as off the mark as a weather forecast predicting snow in the Sahara!
Think of it this way: you’re trying to bake a cake, but instead of sugar, you accidentally use salt. The result? A disaster! Similarly, poor data quality results in unreliable forecasts. It’s crucial to ensure data accuracy and relevance to avoid forecasting blunders.
Machine learning algorithms are like meticulous chefs; they need the best ingredients (data) to whip up something great. Noisy data, filled with irrelevant information, confuses these algorithms, leading to less than stellar outcomes.
In time series analysis, several metrics stand out for their ability to provide clear insights into the predictive accuracy of models. Mean Absolute Error (MAE) and Root Mean Squared Error (RMSE) are frequently used due to their straightforward interpretations.
However, one should also consider Mean Absolute Percentage Error (MAPE) and Weighted Absolute Percentage Error (WAPE) for scenarios where relative errors are more insightful than absolute values.
Each metric offers a unique lens, revealing different aspects of forecast accuracy and helping analysts to pinpoint strengths and weaknesses in predictive models.
While RMSE and MAE are popular, they might not suffice in all forecasting scenarios. These metrics assume that all prediction errors are equally costly, which isn’t always the case. In business contexts, underestimating demand can be more detrimental than overestimating it.
This is where asymmetric loss functions come into play, providing a way to weigh errors differently. They refine our understanding by imposing higher penalties on more costly mistakes, thus aligning model evaluation closer with business objectives.
Backtesting is a common method to assess the effectiveness of forecasting models by applying them to historical data. However, it’s fraught with pitfalls. It might give a misleading sense of accuracy if the historical data isn’t representative of future conditions.
Also, overfitting during backtesting can lead to models that perform well on past data but falter on new data. It’s essential to use backtesting judiciously, complementing it with robust validation techniques to ensure models are both accurate and adaptable.
Imagine a gauge chart, a tool that visually summarizes performance metrics. For forecast accuracy, this chart could highlight several metrics, each pointing to different aspects of performance. Consider incorporating RMSE for its sensitivity to large errors, MAPE for percentage-based errors, and asymmetric loss functions for context-specific evaluations.
This visual representation helps quickly assess which metrics indicate robust performance and which suggest areas for improvement, making it an invaluable tool for analysts.
Let’s say you run a thriving online retail store and plan to expand. How do you prepare? Time series forecasting methods can be your roadmap. These methods analyze sales data over time to predict future trends, often visualized through tools like an exponential growth chart to understand scaling patterns more clearly. Techniques like exponential smoothing or seasonal decomposition provide insights that help in managing inventory and optimizing supply chain operations.
For scaling enterprises, such predictive power is crucial. It allows them to allocate resources efficiently, reducing waste and increasing profitability. Moreover, by forecasting sales, businesses can identify potential growth areas, helping them focus their efforts where they are most likely to succeed.
Market variability is a tricky beast. It can make forecasting a challenge, especially in volatile markets. Why? Because traditional time series analysis often assumes that historical patterns will repeat. But in reality, markets can change rapidly due to a multitude of unforeseen factors.
Machine learning offers a more dynamic approach but isn’t foolproof. It requires large datasets and can be biased by historical anomalies. Both methods must be used carefully, with a clear understanding of their limitations, to make the most accurate predictions in fluctuating markets.
Airlines are masters of forecasting demand. Why? Because their profits depend on it. They use sophisticated forecasting models to predict how many passengers will book flights on specific routes. These predictions influence ticket pricing, flight schedules, and even fuel purchases.
By accurately forecasting demand, airlines can adjust prices to fill seats and maximize revenue. They also use these forecasts to manage their loyalty programs effectively, ensuring they offer enough rewards seats to keep frequent flyers happy without giving away too many valuable seats.


Have you ever ordered something from Amazon and wondered, “How’s it here already?” It’s not luck—it’s smart logistics backed by accurate forecasting. Amazon uses forecasting to guess exactly what you’ll order and when you’ll need it.
Forecasting lets Amazon look at old sales patterns to plan future inventory levels. They predict demand spikes for holidays, events, and even new product launches. That way, your favorite items are always ready to ship out quickly.
Think about holiday seasons—people rush online to order gifts and decorations. Amazon’s forecasting models see these yearly patterns clearly. They stock warehouses early so nothing runs out when orders start flooding in.
Forecasting helps Amazon save money, too, by preventing too much inventory sitting idle. Overstocked shelves cost money, tie up resources, and take valuable warehouse space. By predicting demand, Amazon only orders what customers actually want.
Amazon also uses forecasting to keep its delivery promises to Prime members. When you order with Prime, you expect your items quickly—sometimes the next day. Amazon meets these expectations by stocking warehouses based on accurate demand forecasts.
Forecasting even tells Amazon where products should sit inside each warehouse. High-demand products go near shipping areas to get out the door faster. That’s why your packages ship within hours instead of days.
Ever wonder how Amazon knows how many warehouse workers to hire each month? Forecasting predicts busy times so Amazon knows exactly how many staff they’ll need. This keeps orders flowing without delays or extra labor costs.
Lastly, Amazon uses forecasts to deal with unexpected disruptions—like weather or supply issues. If snowstorms threaten deliveries, Amazon ships orders earlier to avoid delays. Predictive analytics helps Amazon avoid customer disappointments before problems even begin.
Ever wonder how Netflix guesses your next favorite show? It’s not mind-reading—it’s smart forecasting. Netflix checks your viewing history to predict shows you might enjoy later.
Netflix gathers data on every show or movie you watch. They track viewing dates, times, length, and even if you paused midway. All these details build a clear picture of your taste.
Netflix uses patterns from your past viewing to predict future choices. If you’ve binged comedies last summer, Netflix expects you’ll want similar ones soon. Forecasting spots patterns in your viewing habits that you might not even notice yourself.
Netflix also compares your viewing history with millions of other viewers. They find viewers who watched similar shows and movies to you. Then Netflix suggests new content based on what’s popular among similar viewers.
You might’ve seen “Because you watched…” lists pop up on your homepage. That’s Netflix’s forecasting in action—suggesting shows you probably didn’t even know existed. And hey, who doesn’t love a surprise hit show now and then?
Netflix doesn’t guess blindly—they test their forecasting methods often. They experiment with how users respond to recommendations. Good guesses lead to happy viewers, more watching, and fewer cancellations.
Forecasting also helps Netflix plan new shows and movies. Netflix doesn’t produce shows randomly—they use predictions to fund new projects. They study past successes and failures before giving the green light.
Ever binge-watch an entire season of a show in one weekend? You’re not alone—Netflix sees these patterns too. They forecast demand and drop entire seasons at once to meet viewer expectations.
Netflix even uses forecasting to predict server loads. They know peak viewing hours and prepare servers in advance. No buffering during your weekend movie marathons—just smooth streaming.
Retailers face unique hurdles in predicting demand due to seasonal trends and consumer behaviors. A common pitfall is relying on outdated historical data, leading to inaccurate stock levels. To remedy this, retailers can adopt real-time data analytics.
Integrating machine learning models helps identify patterns and predict future demands more accurately. By adjusting inventory systems to sync with these predictive analytics, retailers minimize overstock and understock situations, ensuring optimal stock levels that reflect current market demands.
In finance, forecasting models often miss sudden market crashes due to their reliance on historical data that may not account for unprecedented events or anomalies. To combat this, financial analysts can incorporate stress testing and scenario analysis into their models. These methods evaluate how certain theoretical situations could impact the market, preparing investors for sudden downturns.
Additionally, blending traditional time series forecasting with sentiment analysis can provide a more holistic view of market conditions, potentially flagging anomalies before they lead to crashes.
Hospitals use time series forecasting to manage resource allocation effectively. However, standard models may not accurately predict sudden surges in demand, such as those seen during a pandemic.
To address this, hospitals are turning to machine learning techniques that can analyze diverse data sources, including local health reports and real-time infection rates, to predict potential increases in patient numbers. This proactive approach allows hospitals to allocate resources more efficiently, ensuring they are prepared for surges without wasting valuable medical supplies.
Energy providers must forecast demand to prevent blackouts and reduce waste. Traditional models might not account for variable factors like renewable energy inputs or sudden changes in consumer behavior.
By implementing more dynamic models that use real-time data from smart grids and IoT devices, energy companies can predict fluctuations more accurately. This enables a more responsive approach to energy distribution, balancing supply with demand efficiently and sustainably, thus preventing blackouts and minimizing waste.
In the fast-paced world of data analysis, old models can turn into liabilities. Why? They fail to adapt to new data trends. Picture a model that still thinks flip phones are the rage! It’s not just about being outdated; it’s about accuracy. As data evolves, models trained on old patterns lose their precision. They start making predictions based on conditions that no longer exist.
Imagine using a weather forecast model from the 1990s today. Would you trust its hurricane predictions? Probably not. It’s the same with time series models in finance, marketing, or any field with dynamic data. When models can’t catch up with new trends, their predictions become less useful, sometimes even misleading. That’s a risk no analyst or business should take.
Market shifts are like earthquakes for time series models; they shake up the underlying patterns. What worked before might not work post-shift. Let’s say a model predicts stock prices based on past trends. If a sudden market crash occurs, the old data won’t align with the new reality. The model’s predictions go haywire.
This isn’t just about stocks. Any significant market change can disrupt models. Consider consumer behavior during the COVID-19 pandemic. Models based on pre-pandemic shopping habits were flipped on their heads. Those unable to adjust quickly became obsolete, leaving businesses scrambling.
To keep a time series model fresh and functional, continuous updates are key. Think of it like updating your phone’s software. You wouldn’t skip updates unless you want security risks, right? The same goes for models. Regularly feeding them new data keeps them relevant.
But it’s not just about feeding data; it’s about tweaking algorithms. Sometimes, introducing new variables or adjusting the model’s structure can help. Regular reviews and adjustments ensure that the model remains on top of the latest trends. It’s a bit like training a puppy; consistent effort leads to better results.
Balancing AI and human expertise in time series analysis enhances accuracy and efficiency. AI excels in processing vast datasets quickly, identifying patterns that might elude human analysts. However, human expertise is crucial for contextual interpretation and decision-making.
The synergy of AI’s computational power and human insight leads to more robust forecasting models. Businesses that master this balance can leverage AI to handle data processing while employing human judgment for strategic decisions.
Top companies invest in advanced time series forecasting models because these tools provide critical competitive edges. Smarter models process data more accurately and adapt to changes swiftly, enabling businesses to anticipate market shifts.
This proactive approach helps firms to allocate resources more effectively, capitalize on market opportunities, and avoid potential pitfalls. Investing in these technologies means not just surviving but thriving in dynamic markets.
Improved forecasting techniques save companies millions by reducing waste, optimizing inventory, and enhancing decision-making. With accurate forecasts, companies minimize overproduction, reduce storage costs, and decrease shortages.
This precision leads to better supply chain management, satisfied customers, and lower operational costs. Essentially, better forecasting translates directly into increased efficiency and reduced financial waste.
Pharmaceutical companies rely on time series forecasting to manage drug production and distribution effectively. By predicting demand fluctuations, these companies adjust manufacturing processes, manage inventory levels, and plan distribution logistics.
This foresight helps in avoiding overproduction and shortages, ensuring timely delivery of medications to those in need while maintaining cost efficiency. As a result, they not only meet patient needs but also control expenses, contributing to healthcare sustainability.
A tornado chart is great for visualizing investment risks clearly. Think of it as a clear roadmap showing where your money might be at risk. Longer bars on the chart mean greater potential impact on your investment returns.
In forecasting, tornado charts help companies compare risks of different spending choices. Pharma companies use them to see risks clearly before investing in drug production. Big bars on the chart warn companies about risky moves.
The visual style of tornado charts makes risks easy to spot instantly. You quickly see where your forecast might go wrong or right. Knowing these risks helps companies choose safer, smarter paths.
The chart supports forecasting by connecting investment plans directly to potential outcomes. Clear visuals help executives quickly grasp what decisions mean for the company. They see what’s worth investing in and what’s too risky.


Predicting the future sounds tough, right? But your business depends on it. You’ve seen how using historical data leads to better decisions. It helps businesses avoid surprises and take advantage of new opportunities.
You’ve learned how forecasting models show clear trends. They identify seasonal patterns, track cycles, and cut through random noise. The right model means smarter decisions, lower risks, and fewer costly mistakes. And who doesn’t want that?
Traditional models, AI methods, or hybrid approaches—each has strengths and weaknesses. Picking the best model depends on your specific situation. Keep testing, updating, and monitoring your forecasts. Accurate predictions keep your business ahead.
Markets shift. Conditions change. The most effective strategy combines good models, clean data, and ongoing review. Never settle for outdated methods or stale predictions.
Predict the future with confidence—your next big move depends on it!
How much did you enjoy this article?


Calculate accounts receivable turnover ratio to measure credit collection speed, improve cash flow, and strengthen your financial strategy. Read on!

Change Management KPIs are the key to tracking adoption, performance, and ROI during transitions. Find out which metrics matter. Read on!

Data collection methods and techniques determine the quality of every insight you act on. Explore key approaches for gathering reliable data. Read on!


