Categories
Salary gaps often hide in plain sight, buried inside payroll records that no one scrutinizes closely enough. Pay equity analysis changes that by bringing compensation patterns into full view, giving organizations the evidence.
They need to spot where unfair pay differences exist across roles, demographics, and departments, giving them the clarity to act on what they find.
This guide explains what pay equity is, why it matters to your workforce strategy, and how to perform a structured salary review from start to finish. Along the way, you will find practical tips, real chart examples, and answers to the most common questions about how it all works.
Definition: Pay equity analysis is the process of examining employee compensation to confirm that individuals performing comparable work receive consistent pay regardless of gender, ethnicity, age, or other demographic attributes.
Businesses run a pay equity audit to locate salary disparities, assess how their compensation structures hold up to scrutiny, and verify that pay decisions stem from objective criteria rather than unconscious bias.
A thorough compensation equity analysis compares salaries across roles and experience tiers while weighing legal requirements and internal standards.
Organizations that conduct these reviews on a regular schedule can strengthen transparency, limit exposure to litigation, and create a compensation culture that motivates employees and builds lasting trust.
Running regular salary reviews helps organizations confirm that every employee receives fair pay for comparable work.
A reliable pay equity review depends on gathering the right data and applying consistent evaluation methods from the start.
When building a pay equity analysis, companies must account for multiple legitimate variables that can explain or conceal compensation differences.
Conducting a thorough pay equity review involves gathering salary data, grouping comparable roles, and using formulas and charts to surface pay gaps with precision.
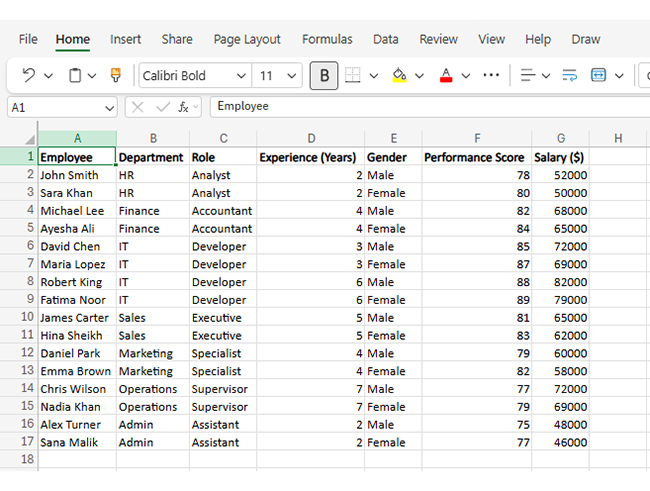
Gather employee details such as job title, department, experience, performance, and salary from payroll records or a business budget template in Excel.
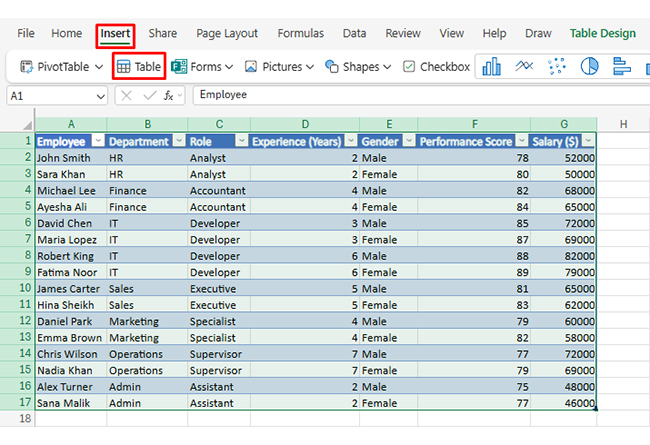
Select the data and press Ctrl + T to convert it into a table, but if you are using online Excel, then select the data and go to Insert > Table. This keeps records consistent and makes filtering easier.
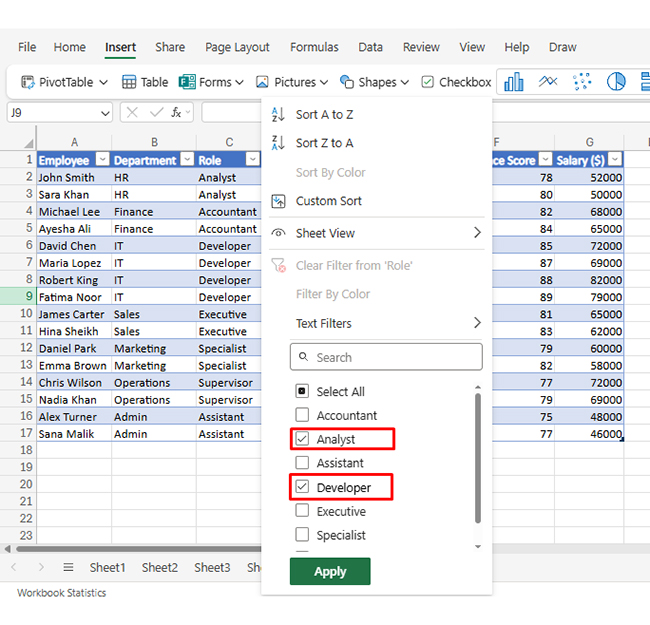
Sort or filter the dataset to compare employees who have the same job title and responsibilities. For example, filter the Role column to show only Developers or Analysts.
Make sure the dataset includes demographic columns such as gender, experience, department, or location.
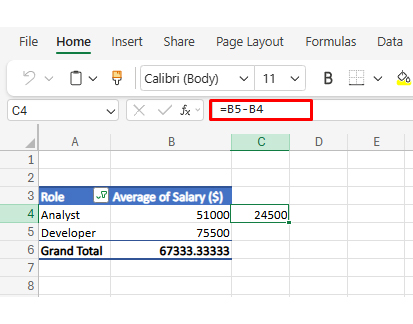
Use a PivotTable to group employees by role and set Salary in Values as Average to calculate the average salary for each role for pay equity analysis.
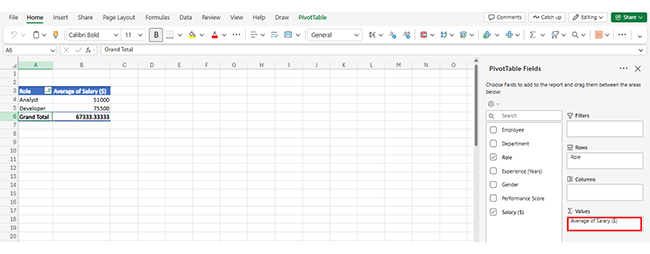
Check whether employees with similar roles and experience are paid differently without valid reasons.
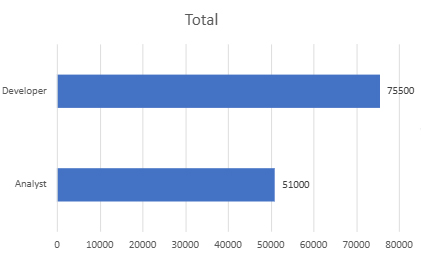
Select the data → Insert → Column or Bar Chart to display salary differences clearly for reports and screenshots.
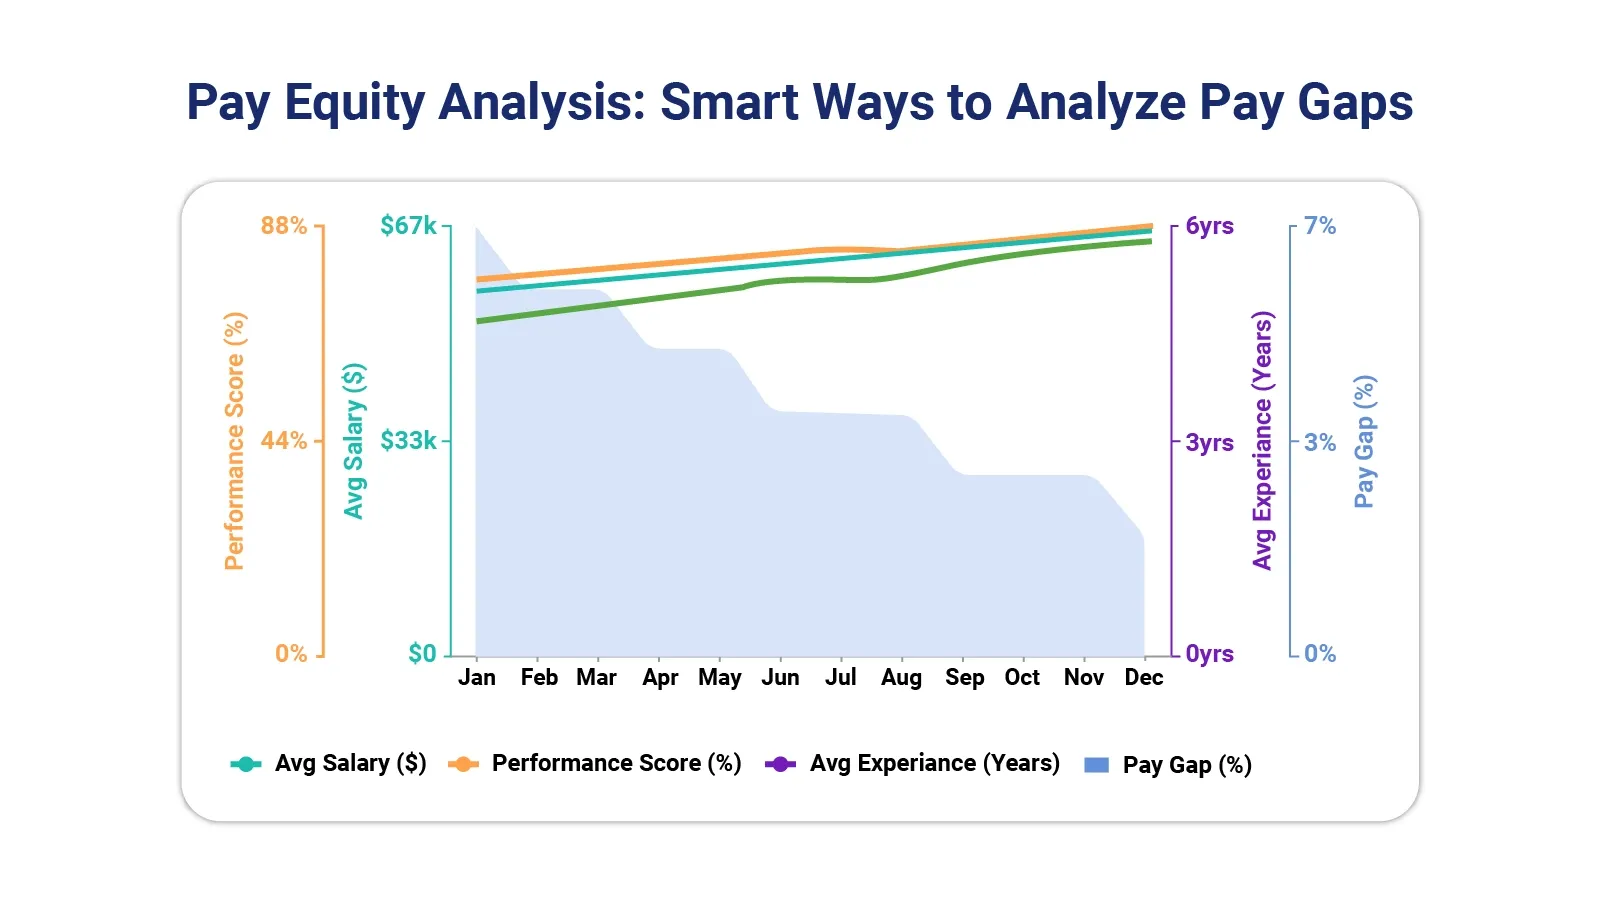
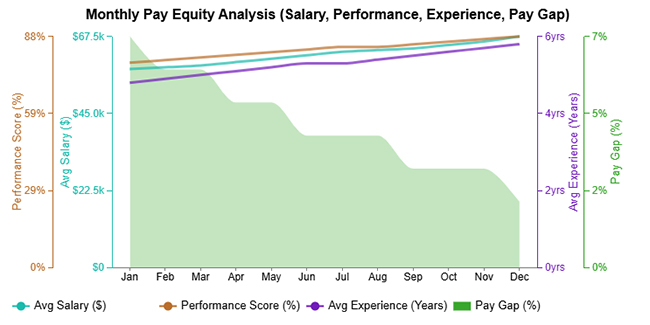
The Monthly Pay Equity example tracks how average salary, performance score, and experience trend upward over twelve months while the pay gap shrinks steadily, pointing toward stronger compensation equity over time.

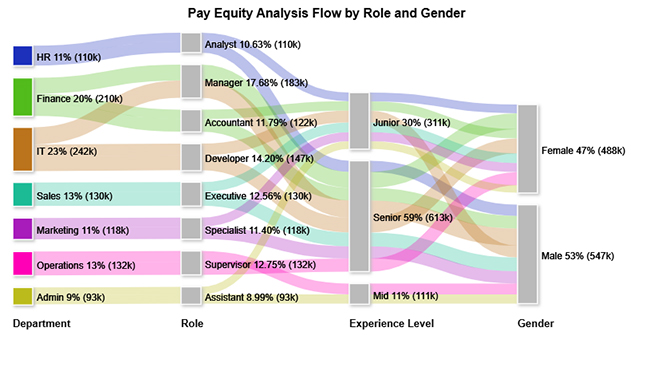
The Equity Analysis Flow by Role and Gender example maps how pay is distributed across departments, job functions, and experience tiers, making gender-based compensation differences visible in a single view.
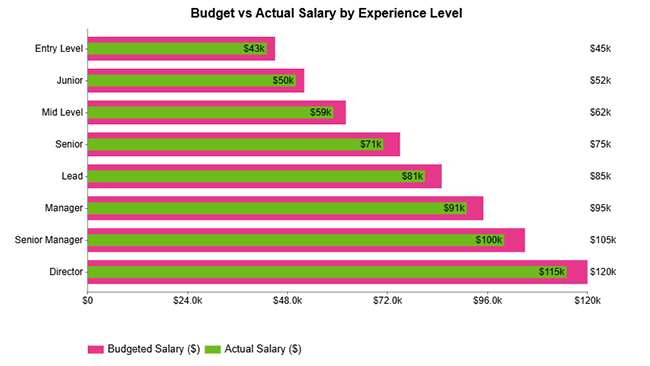
The Budget vs Actual Salary by Experience Level example reveals that actual pay falls slightly below budgeted figures at each experience tier, flagging potential underpayment that warrants further review.
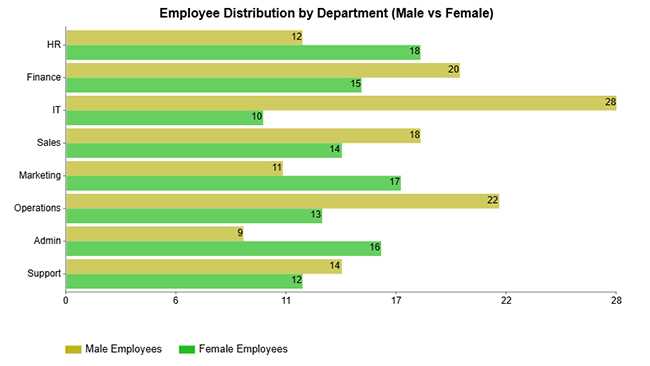
The Employee Distribution by Department example highlights headcount imbalances across teams that can drive undetected pay disparities when workforce composition varies widely between departments.
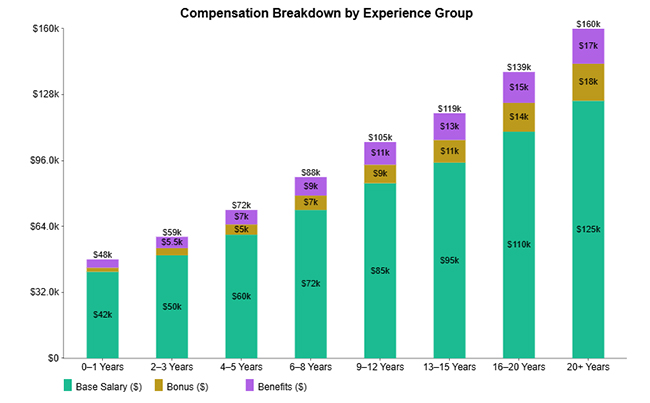
The Compensation Breakdown by Experience Group example confirms that pay rises with seniority, providing a clear picture of how compensation equity shifts as employees progress through experience levels.
Analyzing pay equity data in Excel helps organizations identify salary gaps, ensure fairness, and support data-driven compensation decisions. By comparing pay across roles, experience levels, and performance, you can uncover hidden disparities. Follow these steps to perform effective analysis:
Start by structuring your dataset with clear columns such as employee role, department, salary, experience, and performance score. Clean the data by removing duplicates and ensuring consistency.
Group employees based on comparable factors like job role, level, or location. This ensures fair comparisons when analyzing pay equity across similar positions.
Use Excel formulas to calculate averages, ratios, and differences in salary across groups. Focus on identifying pay gaps between categories such as gender, department, or experience level.
Create Pivot Tables to summarize salary data across different dimensions. This allows you to compare pay distribution and quickly identify areas with potential disparities.
Use charts like line graphs or combination charts to visualize trends in salary, performance, and experience. For more advanced and interactive visuals, you can use ChartExpo to simplify complex data visualization.
Analyze your visuals to detect trends, such as increasing salary with experience or differences in performance versus compensation. Look for inconsistencies that may indicate pay inequity.
Include a final visualization, such as a multi-axis line chart that compares salary, performance, experience, and pay gap over time. This helps present a clear view of equity patterns and makes it easier to communicate insights effectively.
Key Insights
Scheduled reviews keep compensation structures transparent, legally sound, and aligned with the values employees and leaders expect.
Even well-resourced organizations encounter obstacles when they attempt to collect, validate, and interpret compensation data with the consistency a pay equity analysis requires.
Applying proven practices makes the difference between a pay equity analysis that changes behavior and one that generates reports no one acts on.
Gather current payroll records and organize employees into groups with matching roles, experience, and responsibilities. Calculate average pay for each group, flag outliers, and document every decision with supporting data. Revisit the results on a fixed schedule to ensure corrections hold over time.
While pay equity strengthens workplace fairness, it demands precise data collection, significant time investment, and rigorous methodology. Budget constraints can also slow the correction of identified gaps, particularly when multiple salary adjustments must be sequenced across fiscal periods.
A straightforward example is when two employees in the same role with equal experience and performance ratings receive equivalent base pay regardless of gender or ethnic background. Where differences do exist, they should be traceable to objective factors such as specialized skills or relevant certifications.
Pay equity theory holds that workers should receive equivalent compensation for work of equivalent value. A well-structured compensation equity analysis tests this principle by scoring roles against agreed criteria and comparing salary outcomes across those groups using objective, measurable standards.
Compensation fairness is not self-maintaining. Without structured measurement, salary gaps accumulate quietly until they damage trust, invite legal scrutiny, or cost the organization the people it cannot afford to lose.
A rigorous pay equity analysis gives HR and finance teams the evidence they need to make confident, defensible decisions about where pay needs to change and why.
By combining accurate data, consistent methodology, and clear visual reporting, organizations can close gaps before they grow, demonstrate a genuine commitment to fairness, and build a workplace where every employee’s contribution is recognized and rewarded on merit alone, without bias or background holding anyone back.
How much did you enjoy this article?


Calculate accounts receivable turnover ratio to measure credit collection speed, improve cash flow, and strengthen your financial strategy. Read on!

Change Management KPIs are the key to tracking adoption, performance, and ROI during transitions. Find out which metrics matter. Read on!

Data collection methods and techniques determine the quality of every insight you act on. Explore key approaches for gathering reliable data. Read on!


