Categories
Employee performance KPIs—what do they measure? Companies track them to assess productivity, efficiency, and success. Analyzing and interpreting data ensures these metrics provide real value and actionable insights. How? You can leverage KPI graphs. They offer a visual way to spot trends and evaluate performance effectively.


Every workplace is different. What works for one may not work for another. Some industries focus on sales targets, while others measure project completion rates. However, the goal remains the same—higher performance and better results. Data analysis helps businesses make sense of these numbers and turn them into meaningful strategies.
Too many KPIs create confusion, and too few miss critical insights. Tracking attendance, deadlines, customer satisfaction, and revenue growth can show trends. However, without a clear strategy, even the best data is useless.
Employee performance KPIs should align with business goals and be measurable and meaningful. A call center might track response times, while a marketing team may focus on conversion rates. Each metric should drive improvement.
Companies that refine their KPIs see real benefits: higher efficiency, stronger teamwork, and increased profits. Performance measurement isn’t about micromanaging—it’s about progress. The right approach leads to success.
Let’s dive in…
Definition: Employee performance KPIs are metrics that measure work effectiveness. They track productivity, efficiency, and goal achievement, and businesses use them to evaluate success.
Common KPIs include sales targets, project completion rates, and customer satisfaction. The right KPIs depend on industry and job roles.
With KPIs, you get to spot trends and areas for improvement. They also boost motivation – the right approach leads to higher performance and better outcomes.
Success requires clear goals, measurable progress, and continuous improvement. That’s where Key Performance Indicators (KPIs) come in. They turn vague expectations into clear benchmarks. Data storytelling helps bring these KPIs to life, making insights more engaging and actionable.
Here’s why KPIs matter:
The numbers alone don’t define how well you’re performing. It’s about progress, impact, and growth. The right metrics indicate who thrived and where support is needed. Teams stay focused, motivated, and aligned with corporate goals.
Here are 10 key employee performance metrics that matter:
Different roles require different metrics, so employee KPIs fall into various categories. Data integrity ensures these metrics remain accurate and reliable. Each type focuses on a key performance aspect, helping you track progress effectively.
Here are the main types of employee KPIs:
Setting clear benchmarks and using the right tools ensures employees stay focused and businesses gain valuable insights. Effective data presentation makes these insights easier to understand and apply. A well-designed measurement system drives growth, improves efficiency, and strengthens overall performance.
Here’s how to measure KPIs for employees effectively:
Have you ever stared at an Excel spreadsheet packed with numbers, wondering what it all means? That’s the challenge with employee performance KPIs—tracking them is easy, but making sense of the data is another story.
But don’t worry. Data visualization tools help turn raw numbers into insights, making performance analysis clear and actionable. Why data visualization tools? Excel’s basic charts often fall short, leaving you with cluttered, hard-to-read visuals. These tools revolutionize employee engagement survey results presentation and analysis, making insights gleaning a walk in the park.
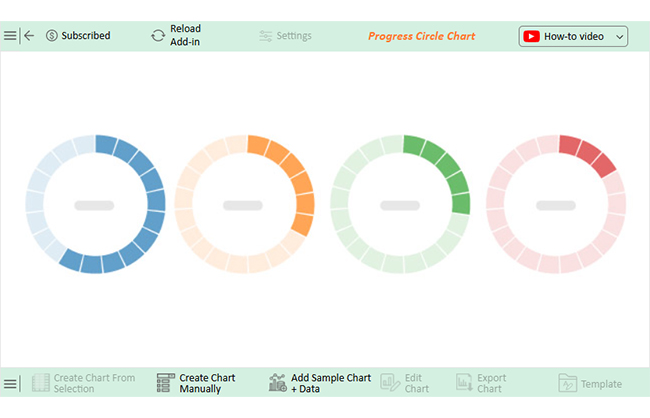
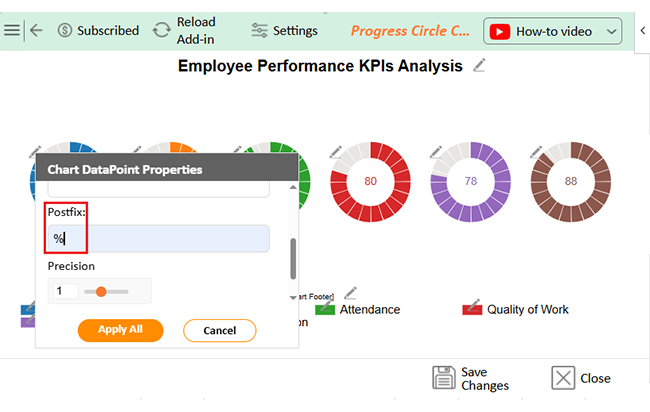
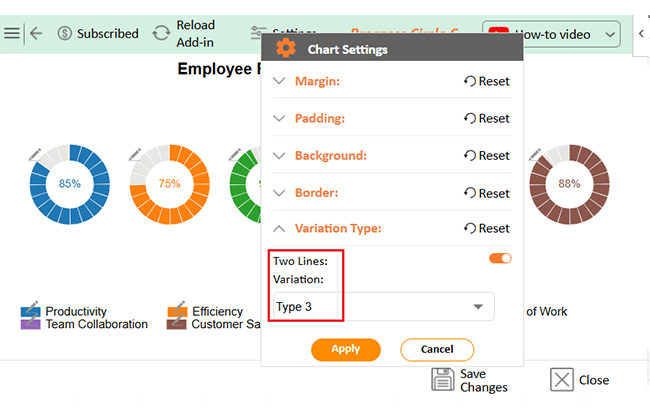
That’s where ChartExpo steps in. It transforms complex KPI data into insightful, easy-to-understand charts, helping businesses track performance clearly and confidently.
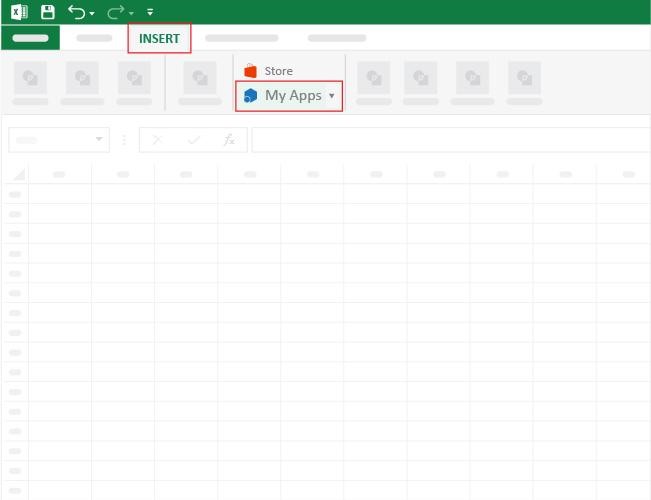
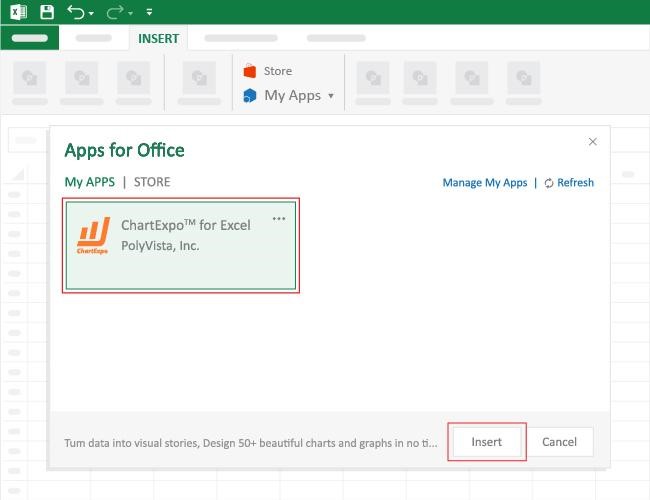
How to Install ChartExpo in Excel?
ChartExpo charts are available both in Google Sheets and Microsoft Excel. Please use the following CTAs to install the tool of your choice and create beautiful visualizations with a few clicks in your favorite tool.
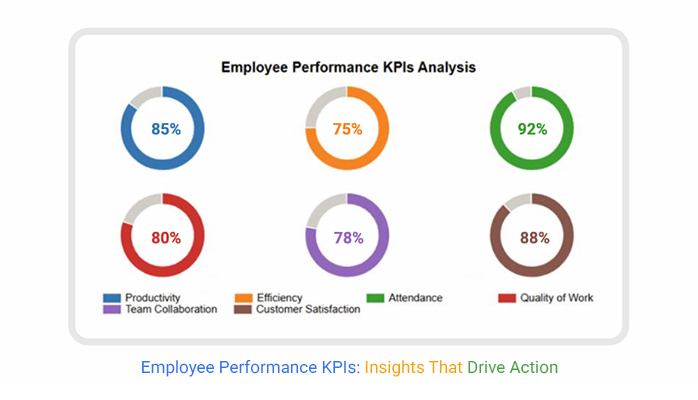
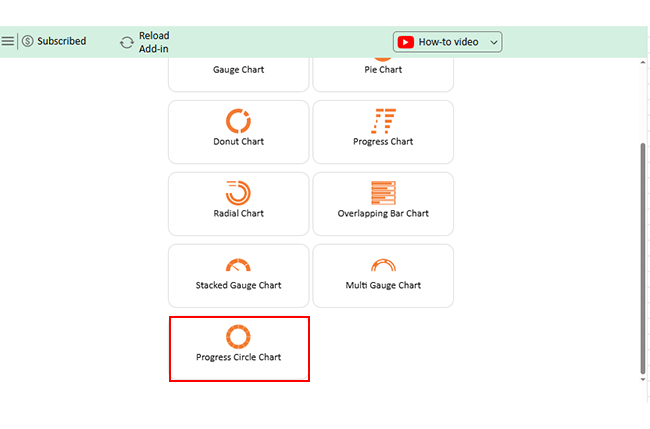
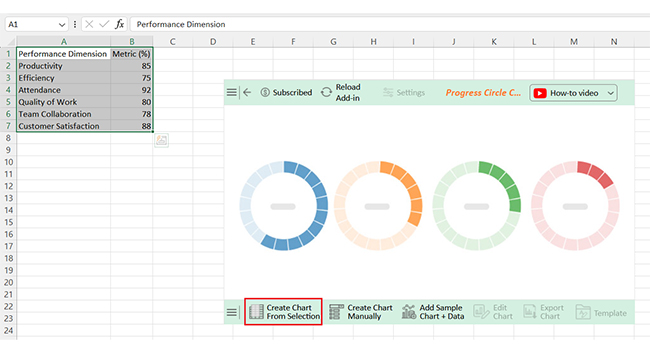
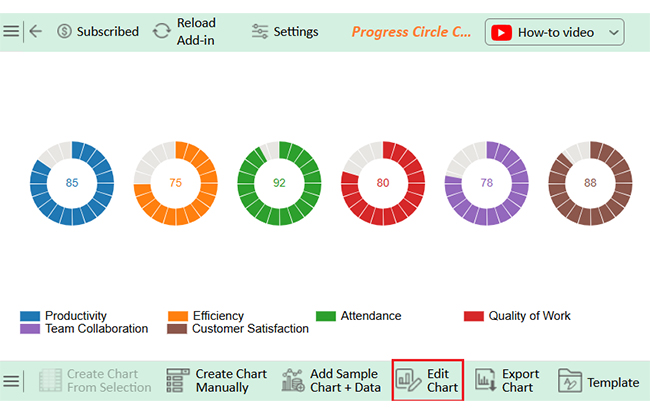
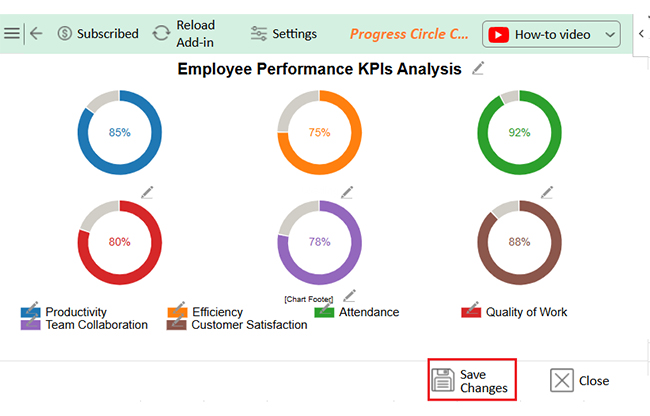
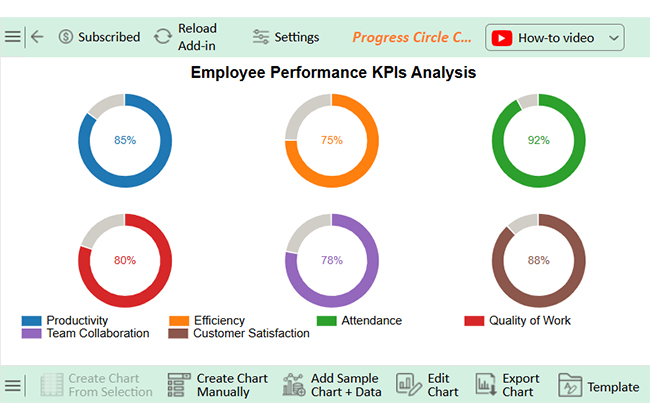
Let’s analyze the KPIs for employee sample data below using ChartExpo.
| Performance Dimension | Metric (%) |
| Productivity | 85 |
| Efficiency | 75 |
| Attendance | 92 |
| Quality of Work | 80 |
| Team Collaboration | 78 |
| Customer Satisfaction | 88 |


Employees thrive when they understand expectations and receive meaningful feedback. Businesses perform better when recognizing strengths, addressing weaknesses, and rewarding achievements. A strong measurement system keeps teams motivated and aligned with company goals.
Here’s how staff performance measurement benefits everyone:


Employees should have 4 to 10 KPIs for balanced performance tracking. Too many can overwhelm, while too few may lack depth. Choose KPIs that align with their role and company goals. Focus on productivity, quality, efficiency, and professional growth for meaningful evaluation.
Employee performance KPIs are essential for measuring success. They set clear productivity, quality, and efficiency benchmarks, helping businesses track progress and improve performance. Using a performance chart for employees helps visualize these benchmarks effectively.
Effective KPIs align with company goals, ensuring employees focus on what matters most. When correctly set, they drive motivation and accountability. Understanding employee performance metrics vs. KPIs ensures businesses track the correct data for meaningful insights.
Tracking KPIs helps identify strengths and weaknesses. Strong performance is recognized, and areas needing improvement become clear. This leads to better training and career growth. Conducting an employee satisfaction survey, for example, can further assess workplace morale and engagement.
Data visualization plays a key role in KPI analysis. Simple spreadsheets often fail to present insights effectively, and clear visuals make data easier to understand and act on.
Excel has limitations in advanced data visualization. It struggles with complex datasets and lacks intuitive design. Tools like ChartExpo simplify the process with better, more precise charts. Install ChartExpo to visualize and analyze KPIs with ease.
How much did you enjoy this article?


Calculate accounts receivable turnover ratio to measure credit collection speed, improve cash flow, and strengthen your financial strategy. Read on!

Change Management KPIs are the key to tracking adoption, performance, and ROI during transitions. Find out which metrics matter. Read on!

Data collection methods and techniques determine the quality of every insight you act on. Explore key approaches for gathering reliable data. Read on!


