• Home
  • Tools dropdown img
    • Spreadsheet Charts

      • ChartExpo for Google Sheets
      • ChartExpo for Microsoft Excel
    • Power BI Charts

      • Power BI Custom Visuals by ChartExpo
    • Word Cloud

  • Charts dropdown img
    • Chart Category

      • Bar Charts
      • Circle Graphs
      • Column Charts
      • Combo Charts
      • Comparison Charts
      • Line Graphs
      • PPC Charts
      • Sentiment Analysis Charts
      • Survey Charts
    • Chart Type

      • Box and Whisker Plot
      • Clustered Bar Chart
      • Clustered Column Chart
      • Comparison Bar Chart
      • Control Chart
      • CSAT Survey Bar Chart
      • CSAT Survey Chart
      • Dot Plot Chart
      • Double Bar Graph
      • Funnel Chart
      • Gauge Chart
      • Likert Scale Chart
      • Matrix Chart
      • Multi Axis Line Chart
      • Overlapping Bar Chart
      • Pareto Chart
      • Radar Chart
      • Radial Bar Chart
      • Sankey Diagram
      • Scatter Plot Chart
      • Slope Chart
      • Sunburst Chart
      • Tornado Chart
      • Waterfall Chart
      • Word Cloud
    • Google Sheets
      Microsoft Excel
  • Services
  • Pricing
  • Contact us
  • Blog
  • Support dropdown img
      • Gallery
      • Videos
      • Contact us
      • FAQs
      • Resources
    • Please feel free to contact us

      atsupport@chartexpo.com

Categories
All Data Visualizations Data Analytics Surveys
Add-ons/
  • Google Sheets
  • Microsoft Excel
  • Power BI
All Data Visualizations Data Analytics Surveys
Add-ons
  • Google Sheets
  • Microsoft Excel
  • Power BI

We use cookies

This website uses cookies to provide better user experience and user's session management.
By continuing visiting this website you consent the use of these cookies.

Ok

ChartExpo Survey


Home > Blog > Microsoft Excel

Payroll Templates for Excel: Ways to Visualize Payroll Data

What are the payroll templates for Excel? This question sparks curiosity among small business owners and HR managers. Why? Many companies depend on spreadsheets to manage salaries, deductions, and taxes. Spreadsheet templates simplify routine work, saving time and reducing mistakes.

Payroll Templates for Excel

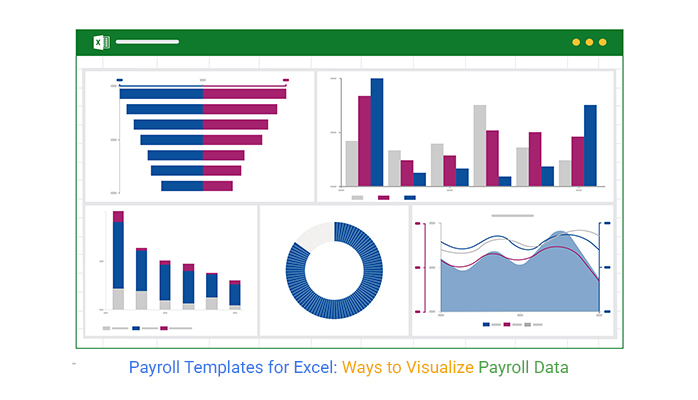
Excel remains a preferred tool for payroll management. Its flexibility and familiarity drive its popularity. Professionals appreciate a structured approach that minimizes manual errors. Why? Accuracy is vital for tax compliance and budget control. A single miscalculation can lead to costly penalties and strained employee relations. Custom Excel charts help visualize payroll trends and financial data, making analysis easier.

Payroll templates for Excel offer a straightforward solution. They present neatly arranged data and automated formulas. This ensures you can easily update tax rates, overtime calculations, and benefits. As a result, employees receive clear, itemized pay stubs that foster trust and transparency.

That’s not all. Records become easier to audit and share during financial reviews. A well-organized template not only boosts efficiency but also improves internal communication. A price comparison template in Excel can further assist in evaluating payroll costs across different periods.

Small business owners have much to gain from adopting these systems. Clear, concise records build confidence among staff and management. A monthly financial report template in Excel can complement payroll tracking, ensuring economic stability.

This introduction sets the stage for practical tips and insightful data that will help you streamline payroll processes. Get ready to explore practical strategies and proven benefits in the sections ahead.

First…

Table of Contents:

  1. What is a Payroll Template in Excel?
  2. Why Are Excel Payroll Templates Necessary?
  3. What Makes a Good Excel Payroll Check Template?
  4. How to Analyze the Payroll Template in Excel?
  5. Advantages and Disadvantages of Payroll Format in Excel
  6. FAQs
  7. Wrap Up

What is a Payroll Template in Excel?

Definition: A payroll template in Excel is a pre-designed spreadsheet for tracking employee wages, taxes, and deductions. It automates salary calculations, saving time and reducing errors. Businesses use this template to manage payrolls efficiently. It includes sections for hours worked, overtime, benefits, and tax withholdings.

Customizable templates suit various company needs. Some templates also generate pay stubs and summaries. Moreover, Excel formulas help compute totals automatically.

An income statement template in Excel clarifies earnings and expenses alongside payroll. It simplifies payroll processing without specialized software.

Payroll Management with a Payroll Template in Power BI Using Multi Axis Line Chart for Data Insights

Payroll Management with a Payroll Template in Google Sheets Using Multi Axis Line Chart for Data Insights

Payroll Management with a Payroll Template in Microsoft Excel Using Multi Axis Line Chart for Data Insights

Why Are Excel Payroll Templates Necessary?

Managing payroll can be a headache. Mistakes lead to unhappy employees and compliance issues. Excel payroll templates streamline the process, ensuring smooth and accurate payroll management. Data visualization tools help present payroll data clearly, making tracking trends and detecting errors easier.

Here’s why these templates are necessary.

  • Accurate calculations: Payroll mistakes can lead to financial losses and employee dissatisfaction. Excel formulas ensure precise calculations for wages, taxes, and deductions.
  • Time-saving: Manually processing payroll is slow and tedious. Excel automates calculations, saving valuable time for businesses.
  • Compliance with regulations: Tax laws and labor regulations frequently change. These templates help track deductions and withholdings correctly, reducing legal risks.
  • Easy record-keeping: Keeping payroll data organized is essential for audits and financial reports. Recruitment dashboards help track hiring costs, ensuring payroll expenses stay manageable.
  • Customization for business needs: Different companies have unique payroll structures. You can modify these templates to fit specific salary, bonus, and tax requirements.
  • Cost efficiency: Hiring payroll services or buying software can be expensive. It provides a free or low-cost alternative with powerful payroll management features.

What Makes a Good Excel Payroll Check Template?

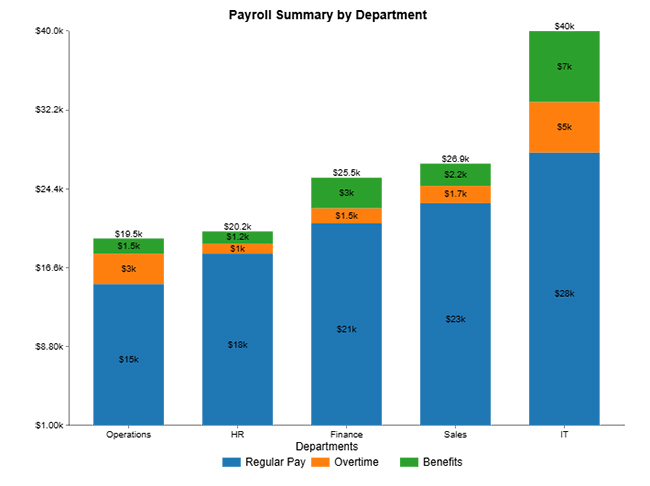
Payroll management doesn’t have to be complicated. Excel payroll templates make it easier to keep everything organized and accurate. A month-to-month comparison Excel chart helps track payroll trends over time, ensuring better financial planning. Here’s what makes them a game-changer:

  • Customizable for your needs: Every business has different payroll structures. These templates let you modify fields for salaries, bonuses, overtime, and deductions.
  • Tracks taxes and compliance: Tax rules change often. Payroll templates track withholdings and ensure compliance.
  • Stores employee information: Keeping all employee details in one place makes payroll management more effortless. Templates store names, hours worked, pay rates, and other essential data.
  • Summarizes earnings and deductions: A clear breakdown of wages, taxes, and benefits ensures transparency. It helps businesses and employees track financial details effortlessly.
  • Professional and printable: Well-structured templates create professional pay stubs and reports. Infographics make payroll data more visual for clear and effective record-keeping.
  • Saves time and reduces errors: Manual calculations increase the risk of mistakes. The automated formulas in Excel speed up payroll processing and ensure accuracy.

How to Analyze the Payroll Template in Excel?

Payroll templates for Excel keep your numbers in line but can make data analysis feel like a maze. Data visualization is the secret sauce of insight. Yet, Excel sometimes fails to spice things up.

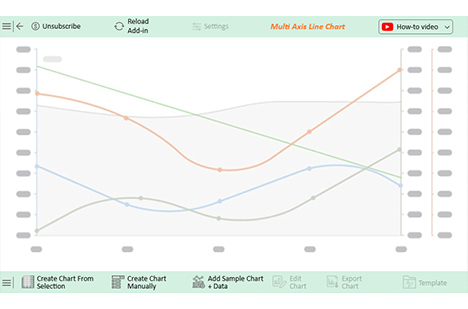
A chart add-in for Excel enhances visual storytelling, making payroll data easier to interpret. Enter ChartExpo. It transforms static spreadsheets into vibrant visual stories, giving payroll templates a fresh, clear view.

Install ChartExpo for smarter data analysis and a touch of wit.
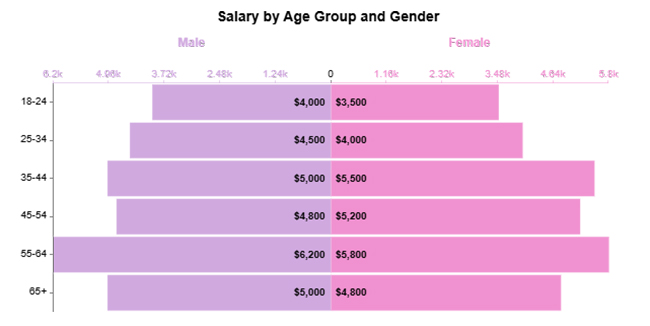
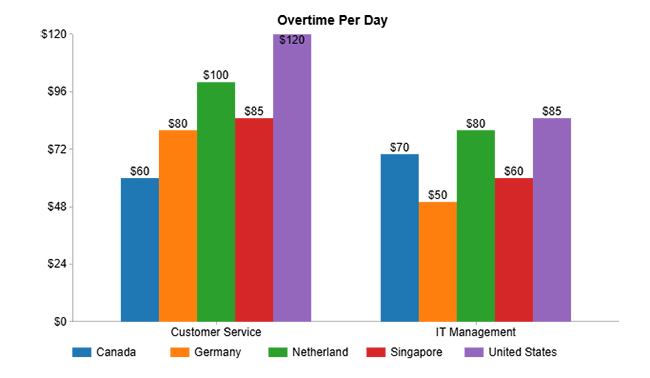
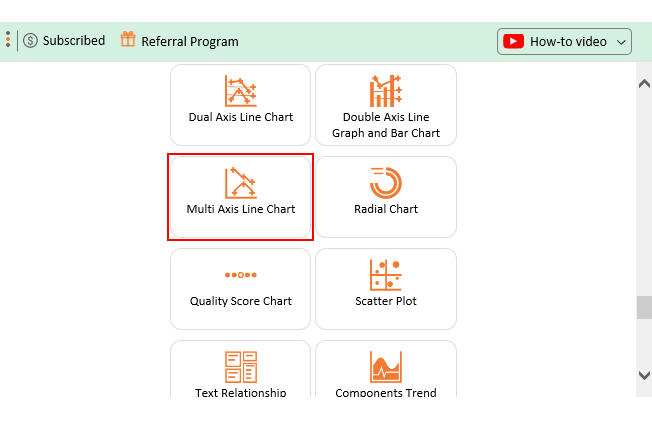
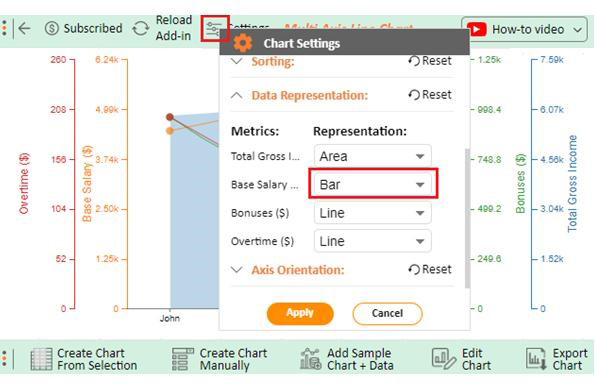
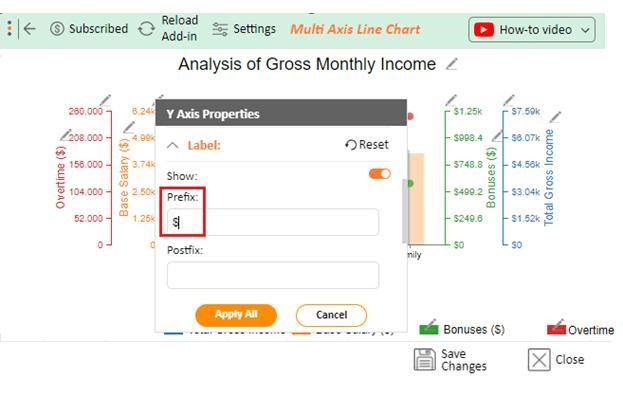
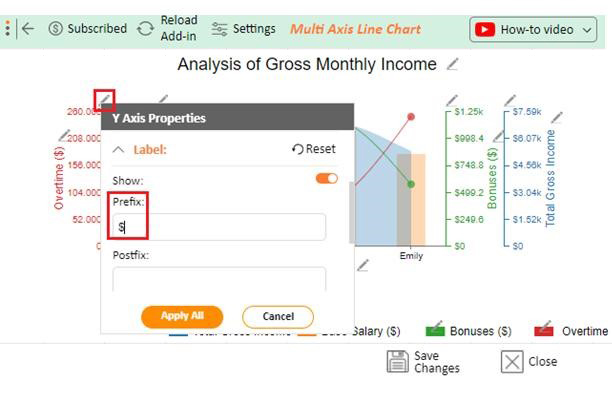
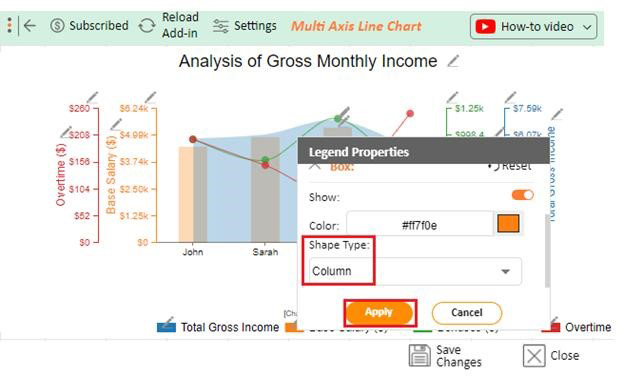
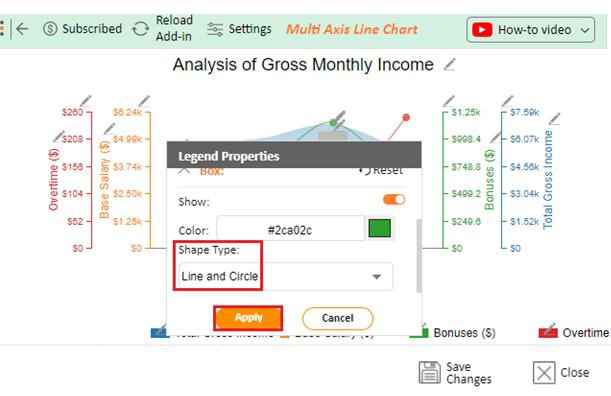
The charts below were created in Excel using ChartExpo:

Multi-Axis Line Chart:

Payroll Templates for Excel

Stacked Column Chart:

Payroll Templates for Excel

Progress Circle Chart:

Payroll Templates for Excel

Double Bar Graph:

Payroll Templates for Excel

Cluster Column Chart:

Payroll Templates for Excel

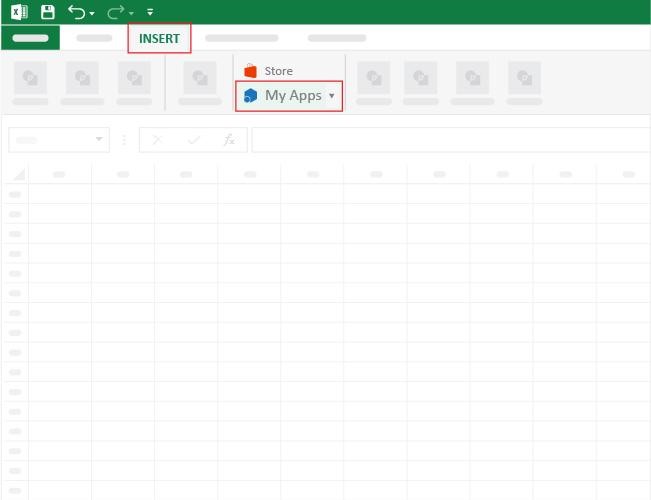
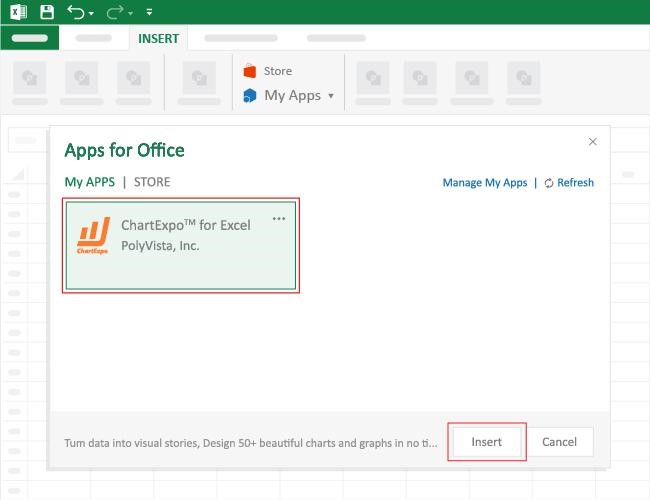
How to Install ChartExpo in Excel?

  1. Open your Excel application.
  2. Open the worksheet and click the “Insert” menu.
  3. You’ll see the “My Apps” option.
  4. In the Office Add-ins window, click “Store” and search for ChartExpo on my Apps Store.
  5. Click the “Add” button to install ChartExpo in your Excel.

ChartExpo charts are available both in Google Sheets and Microsoft Excel. Please use the following CTAs to install the tool of your choice and create beautiful visualizations with a few clicks in your favorite tool.

Example

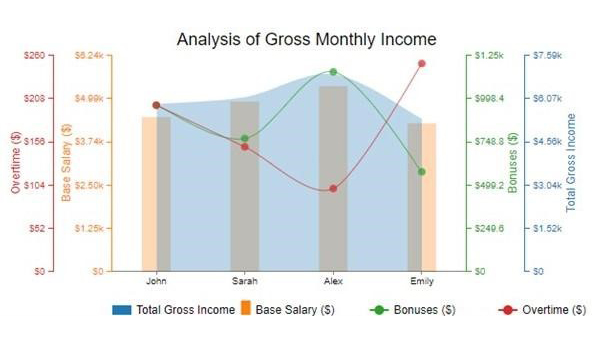
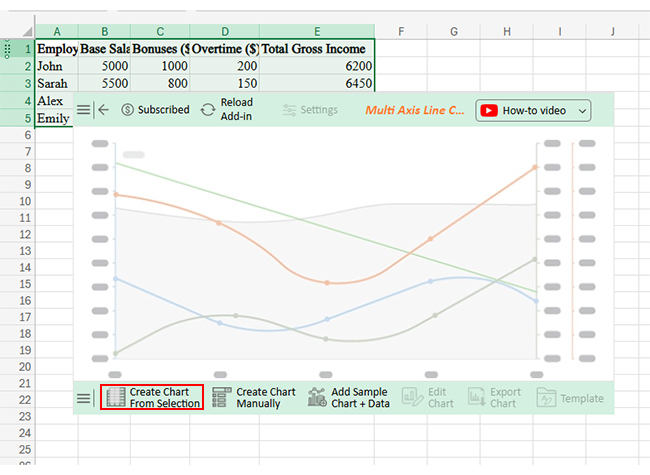
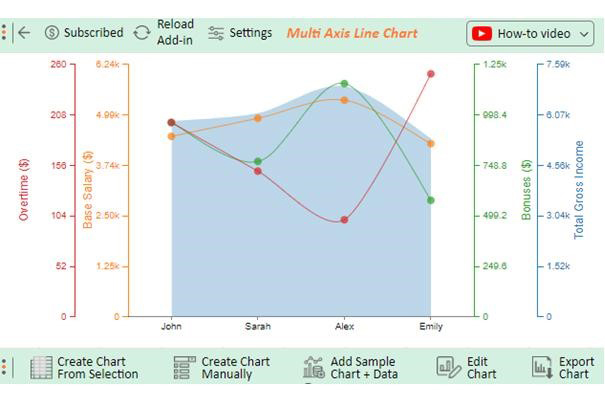
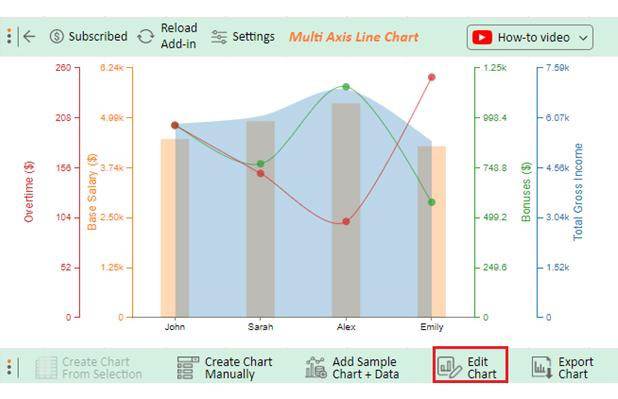
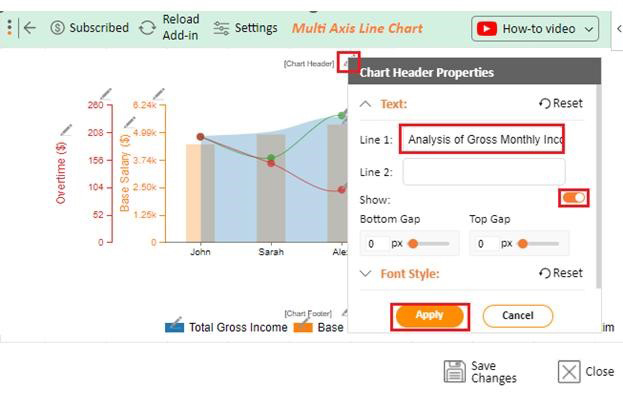
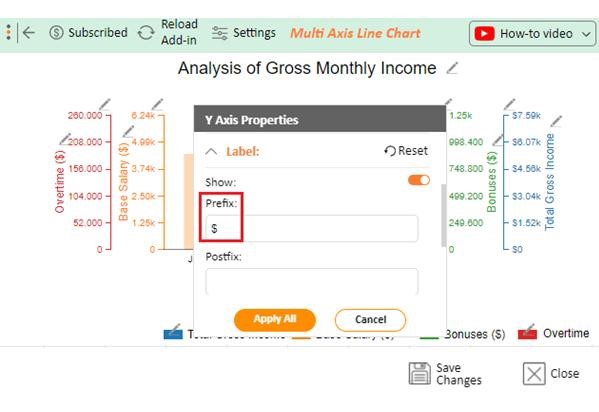
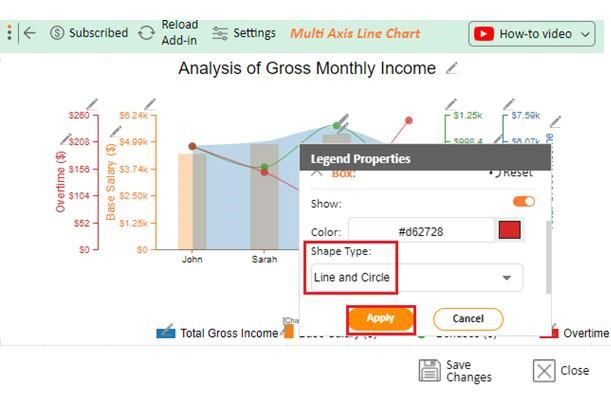
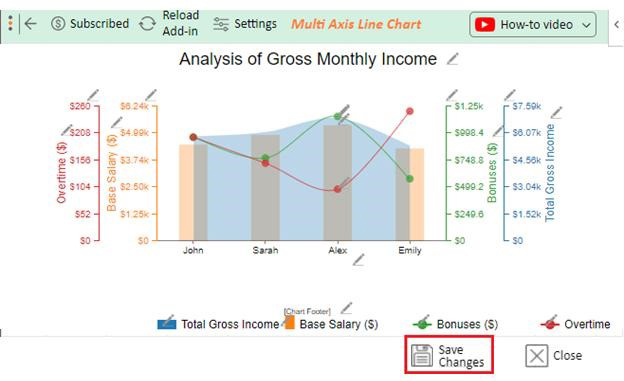
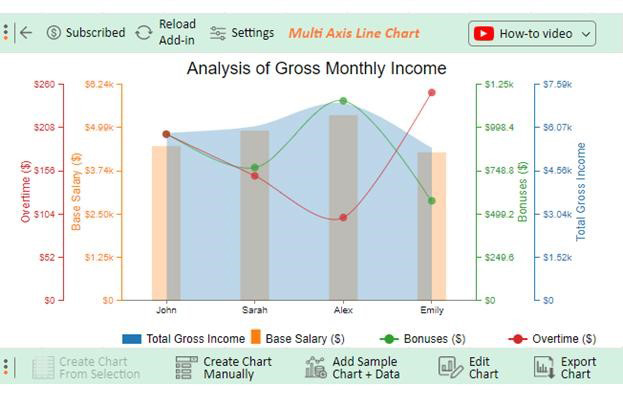
Let’s analyze this sample data in Excel and learn How to Update a Chart in Excel using ChartExpo;

Employee Base Salary ($) Bonuses ($) Overtime ($) Total Gross Income
John 5000 1000 200 6200
Sarah 5500 800 150 6450
Alex 6000 1200 100 7300
Emily 4800 600 250 5650


  • To get started with ChartExpo, install ChartExpo in Excel.
  • Now Click on My Apps from the INSERT.
Payroll Templates for Excel
  • Choose ChartExpo from My Apps, then click.
Payroll Templates for Excel
  • Once it loads, scroll through the charts list to locate and choose the “Multi Axis Line Chart”.
Payroll Templates for Excel
  • You will see a Multi Axis Line Chart on the screen.
Payroll Templates for Excel
  • Click the “Create Chart From Selection” button after selecting the data from the sheet, as shown.
Payroll Templates for Excel
  • ChartExpo will create a Multi Axis Line Chart with respect to the given data:
Payroll Templates for Excel
  • Change Data presentation as follows;
Payroll Templates for Excel
  • If you want to add anything to the chart, click the Edit Chart button:
Payroll Templates for Excel
  • Click the pencil icon next to the Chart Header to change the title.
  • It will open the properties dialog. Under the Text section, you can add a heading in Line 1 and enable Show.
  • Give the appropriate title of your chart and click the Apply button.
Payroll Templates for Excel
  • Change the precision value of Bonuses as well as Total Gross Income to zero and add the dollar sign:
Payroll Templates for Excel
  • Change the precision value of Base Salary to zero and add the dollar sign:
Payroll Templates for Excel
  • Change the precision value of Overtime to zero and add the dollar sign:
Payroll Templates for Excel
  • Change the Legend shape of “Base Salary” to Column and click the “Apply” button.
Payroll Templates for Excel
  • Change the Legend shape of “Bonuses” into a Line and Circle and click the “Apply” button.
Payroll Templates for Excel
  • Change the Legend shape of “Overtime” into a Line and Circle and click the “Apply” button.
Payroll Templates for Excel
  • Click the “Save Changes” button to persist the changes made to the chart.
Payroll Templates for Excel
  • Your final Multi Axis Line Chart will appear as below.
Payroll Templates for Excel

Insights

  • Alex has the highest overall gross income of $7300, boosted by a $1200 bonus.
  • Emily’s earnings are driven primarily by overtime.
  • Sara enjoys a balanced mix of salary, bonus, and overtime.
  • John has a notable income with a significant $1000 bonus.

Advantages and Disadvantages of Payroll Format in Excel

Excel payroll formats bring many benefits and some challenges. They are a popular option for many businesses. For instance, an accurate, timely payroll boosts customer retention through better service and satisfaction. Let’s break down each of the advantages and disadvantages associated with these templates.

Advantages

  • Cost-effective: Excel is an affordable tool that most companies already own. It reduces the need to invest in expensive payroll software.
  • Customization: You can adjust formulas and layouts to suit your needs. A Digital dashboard helps visualize payroll data, making it easier to track changes as your business evolves.
  • Ease of use: The interface is familiar to many users. This simplicity helps speed up training and daily tasks.
  • Data accuracy and automation: Built-in formulas calculate numbers automatically, minimizing human error and ensuring accurate payroll data.
  • Trackable record-keeping: All payroll records are stored in one file for easy access. This organization makes audits and reviews straightforward.
  • Flexibility and integration: Excel files can easily be shared across various platforms. They can integrate with other systems to support your overall workflow.

Disadvantages

  • Manual updates: Data must be updated by hand every pay cycle. This process can be time-consuming and increases the chance of mistakes.
  • Limited security: Excel lacks advanced security features to protect sensitive information. Extra measures are needed to safeguard your data.
  • Scalability issues: Excel may struggle with large data sets as your business grows, leading to slow performance. Information overload can make it harder to analyze payroll details efficiently.
  • Complex for new users: The features can overwhelm beginners, and a steep learning curve may delay effective use for some employees.
  • Risk of errors: Manual entry heightens the possibility of mistakes. A single error in data can disrupt the entire payroll process.
  • No automatic tax filing: Excel does not connect directly to tax filing systems. It means you must handle tax submissions separately.

FAQs

How do I create a payroll Spreadsheet in Excel?

  • Open Excel and create a new spreadsheet.
  • Label columns for employee name, hours worked, pay rate, taxes, and deductions.
  • Use formulas to calculate gross pay, taxes, and net salary.
  • Apply formatting for clarity and easy reading.
  • Save the file and update it regularly for accuracy.

What is the best formula for payroll in Excel?

  • Use =Hours Worked × Hourly Rate for gross pay.
  • Apply =Gross Pay × Tax Rate to calculate taxes.
  • Use =Gross Pay – Taxes – Deductions for net salary.
  • Automate calculations with SUM, IF, and VLOOKUP

Does Microsoft Excel have a pay stub template?

Yes, Microsoft Excel offers pay stub templates. You can find them in the template gallery. Open Excel, search for “pay stub” in the template, and select one. Customize it to fit your needs. It simplifies payroll processing and record-keeping.

Wrap Up

Payroll templates for Excel simplify payroll management. They help businesses track wages, taxes, and deductions accurately. With built-in formulas, they reduce errors and save time. A time series chart in Excel can help visualize payroll trends, aiding financial planning.

These templates ensure compliance with tax and labor laws. They automatically calculate withholdings and other deductions, helping businesses avoid penalties and legal issues.

Payroll templates make employee records easy to manage. They store names, hours worked, salaries, and benefits in one place, keeping payroll data organized and accessible. A CRM template for Excel can further help you track employee interactions and payroll-related communications.

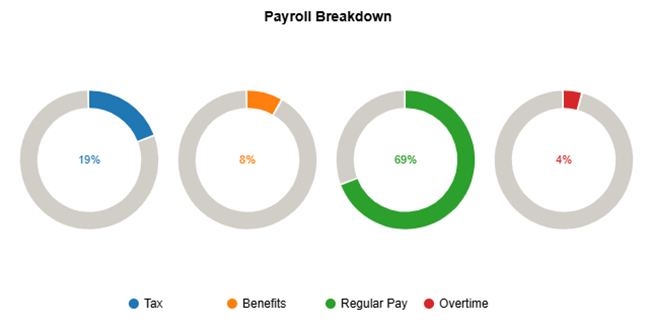
Earnings and deductions are summarized. Employees can easily see their wages, taxes, and benefits. You can also generate reports for financial planning. Moreover, conducting a SWOT analysis will help you assess payroll efficiency and identify strengths and areas for improvement.

Excel payroll templates offer customization options. You can adjust fields to match your company’s payroll structure, making them a flexible and cost-effective solution.

In conclusion, payroll templates make payroll processing faster and easier. They reduce errors, ensure compliance, and improve record-keeping. They are a valuable tool for businesses of all sizes.

To enhance data visualization, consider installing ChartExpo, the king of add-ins for creating insightful charts in Excel.

How much did you enjoy this article?

ExcelAd2
Start Free Trial!
148933

Related articles

next previous
Microsoft Excel12 min read

Artificial Intelligence in Excel for Clear Insights

Discover how AI elevates Excel, from automation to advanced data analysis. This blog covers benefits, limitations, and examples to enhance your productivity.

Microsoft Excel8 min read

Excel Task Tracker Template for Smarter Task Insights

Task tracker template in Excel organizes tasks, tracks deadlines, and boosts efficiency. Learn its benefits, and explore expert tips to simplify task management.

Microsoft Excel10 min read

Invoice Tracker Template in Excel for Better Insights

An invoice tracker Excel template helps track invoices, due dates, and payments. Learn how to use this template for better financial management.

Microsoft Excel12 min read

Key Performance Indicators in Healthcare for Better Insights

Key Performance Indicators in healthcare track patient care and efficiency. Learn about these KPIs, top examples, and how to use them to improve outcomes.

Microsoft Excel10 min read

BMI Calculation Formula in Excel for Better Fitness Insights

The BMI calculation formula in Excel helps track and analyze body mass index. Explore step-by-step instructions and tips to simplify BMI tracking in Excel.

ChartExpo logo

Turn Data into Visual
Stories

CHARTEXPO

  • Home
  • Gallery
  • Videos
  • Services
  • Pricing
  • Contact us
  • FAQs
  • Privacy policy
  • Terms of Service
  • Sitemap

TOOLS

  • ChartExpo for Google Sheets
  • ChartExpo for Microsoft Excel
  • Power BI Custom Visuals by ChartExpo
  • Word Cloud

CATEGORIES

  • Bar Charts
  • Circle Graphs
  • Column Charts
  • Combo Charts
  • Comparison Charts
  • Line Graphs
  • PPC Charts
  • Sentiment Analysis Charts
  • Survey Charts

TOP CHARTS

  • Sankey Diagram
  • Likert Scale Chart
  • Comparison Bar Chart
  • Pareto Chart
  • Funnel Chart
  • Gauge Chart
  • Radar Chart
  • Radial Bar Chart
  • Sunburst Chart
  • see more
  • Scatter Plot Chart
  • CSAT Survey Bar Chart
  • CSAT Survey Chart
  • Dot Plot Chart
  • Double Bar Graph
  • Matrix Chart
  • Multi Axis Line Chart
  • Overlapping Bar Chart
  • Control Chart
  • Slope Chart
  • Clustered Bar Chart
  • Clustered Column Chart
  • Box and Whisker Plot
  • Tornado Chart
  • Waterfall Chart
  • Word Cloud
  • see less

RESOURCES

  • Blog
  • Resources
  • YouTube
SIGN UP FOR UPDATES

We wouldn't dream of spamming you or selling your info.

© 2025 ChartExpo, all rights reserved.