Categories
What are private equity waterfalls, and why do they matter so much in investment deals? These payout structures determine how profits flow between investors and fund managers. They are not optional fine prints—they’re central to how billions are distributed.


Private equity waterfalls aren’t only for large firms; mid-market and growth-stage funds are also used to set fair reward systems. Preferred returns, catch-ups, and carried interest define real outcomes. Fund managers stake their compensation on the precision of these terms as limited partners determine actual returns on investment.
Understanding private equity waterfalls isn’t about decoding jargon. It’s about decision-making. With tools like a chart, stakeholders can visualize how distributions shift at different return levels. It shows what’s happening—not in theory, but in complex numbers.
More firms are adopting finance dashboards in Excel to make these structures transparent. These dashboards support better reports on Financial analysis and give everyone a sharper view of how a deal performs. Transparency doesn’t just help manage funds; it builds trust.
This blog will break down how private equity waterfalls work step by step. We’ll simplify the numbers, trace the flow, and see where each dollar ends.
Definition: In private equity waterfall refers to the method of distributing profits among investors and fund managers. It outlines the order in which cash flows are allocated, starting with returning the initial capital to investors, then providing a preferred return, and finally sharing remaining profits between investors and the fund managers (carried interest). The structure ensures that investors receive their agreed returns before managers earn performance-based compensation.
Private equity distribution waterfalls are important in private equity because they define:
Distribution waterfalls prioritize investors by ensuring they receive their original capital contributions and preferred returns before fund managers share in the profits. This safeguards investor interests and reduces risk.
The structure provides a clear framework for how profits are divided. By outlining the payout sequence in advance, waterfalls eliminate confusion and promote transparency between investors and fund managers.
Because fund managers only earn carried interest after investors achieve agreed returns, their incentives are directly tied to fund performance. This alignment encourages managers to maximize value creation.
A well-structured waterfall assures investors that returns will be distributed fairly and consistently. This builds long-term confidence, making it easier for funds to attract and retain investors.
Clear distribution rules reduce disputes, improve investor relations, and help maintain a healthy balance between rewarding performance and protecting investor capital.
| Feature | European Waterfall | American Waterfall |
| Payout Basis | Fund-as-a-whole – LPs must receive all contributed capital and preferred return across the entire fund before the GP earns carried interest. | Deal-by-deal – GP can take carried interest from each profitable deal once its hurdle rate is met. |
| Investor Protection | More investor-friendly; early profits offset future losses before GP gets paid. | Less investor protection; GP can be paid early, even if later deals lose money. |
| Liquidity for GP | GP receives carried interest later, only after fund-level returns are secured. | GP receives carried interest earlier, as soon as deals are successful. |
| Clawback Risk | Lower risk of clawbacks since payouts are made after the overall fund performance is clear. | Higher risk of clawbacks if GP is overpaid early and later deals underperform. |
| Incentives | Encourages long-term performance and protects LPs. | Incentivizes GPs to pursue quicker exits and profitable deals early. |
In this private equity waterfall example, the private equity fund invests $100 million and earns $160 million in total proceeds. The fund agreement follows a typical waterfall structure for private equity. Here’s how distributions might work:
In this example, the private equity waterfall ensures LPs are fully repaid and receive their promised return before the GP earns carried interest.
Have you ever tried explaining a private equity waterfall with many Excel rows? It’s a headache wrapped in a spreadsheet.
Sure, Excel is excellent for private equity waterfall model analysis and crunching numbers. However, it falls short with data visualization, especially for layered structures. Your charts get messy, hard to read, and even harder to explain.
That’s where ChartExpo steps in. It turns complex data into clean visuals fast. Tools like a Stacked waterfall chart clarify your financial metrics without the need for formatting battles.
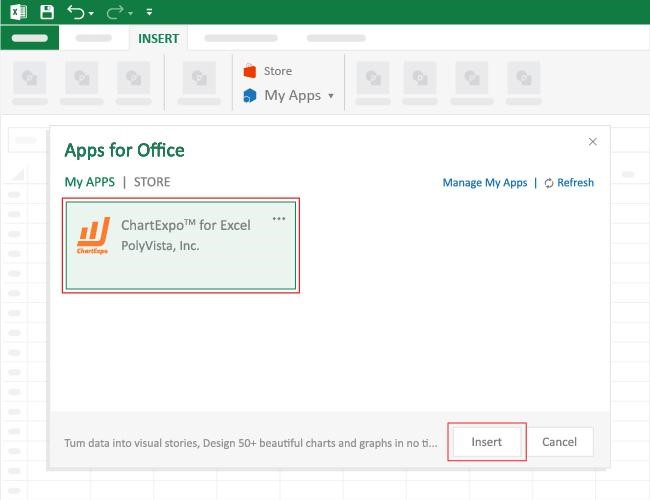
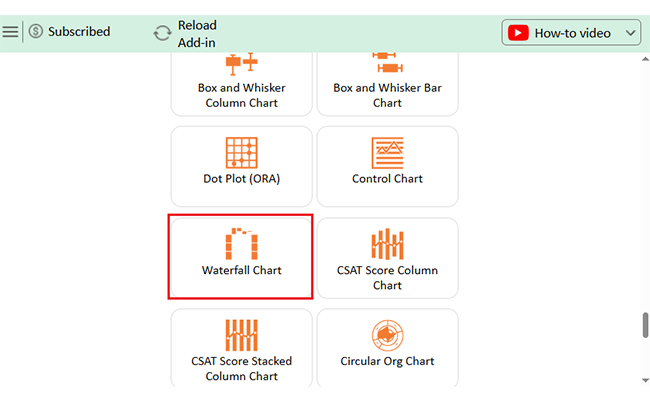
How to Install ChartExpo in Excel?
ChartExpo charts are available both in Google Sheets and Microsoft Excel. Please use the following CTAs to install the tool of your choice and create beautiful visualizations with a few clicks in your favorite tool.
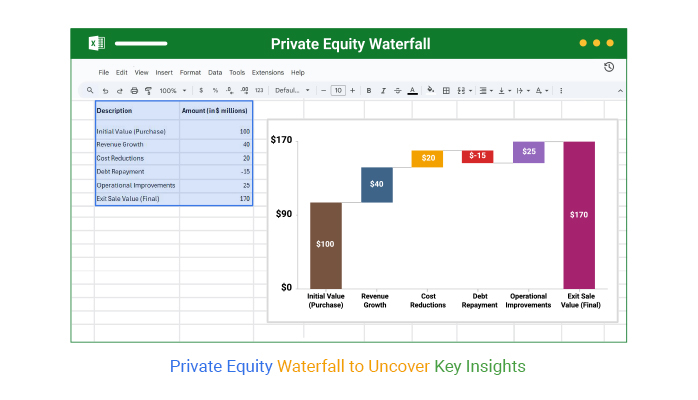
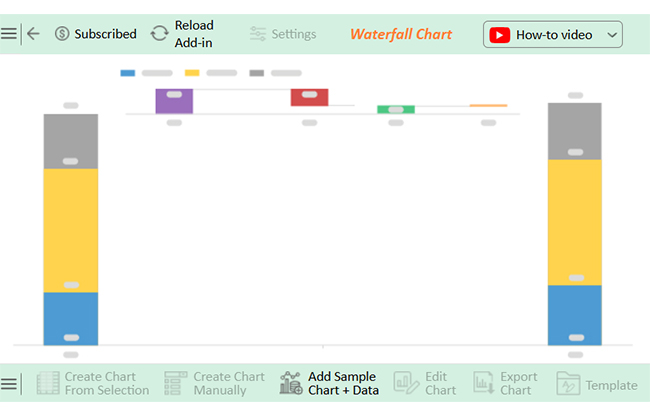
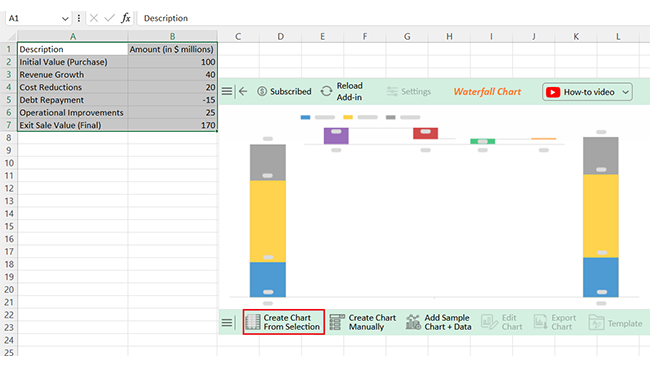
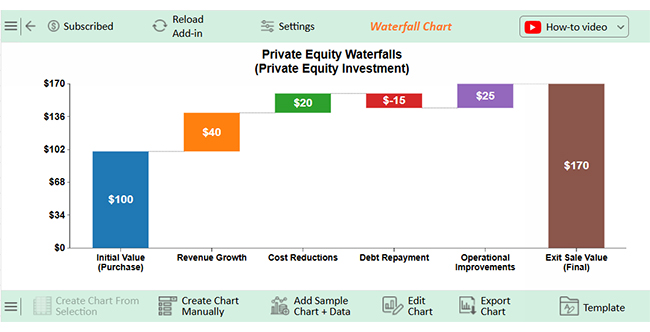
Let’s analyze this sample data in Excel using ChartExpo.
| Description | Amount (in $ millions) |
| Initial Value (Purchase) | 100 |
| Revenue Growth | 40 |
| Cost Reductions | 20 |
| Debt Repayment | -15 |
| Operational Improvements | 25 |
| Exit Sale Value (Final) | 170 |

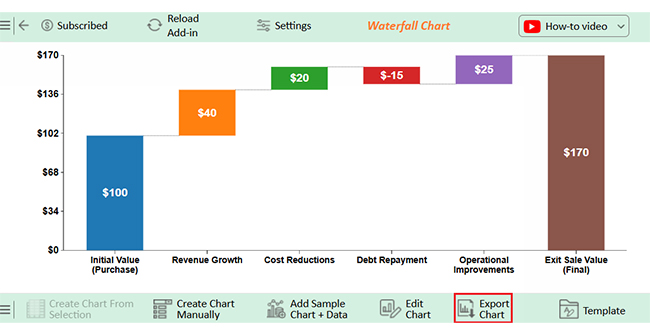


Key value drivers:
When setting up a private equity waterfall, the goal is to ensure everything is clear and aligned with fund objectives. Here are some tips to get the structure right and ensure smooth payouts:
While distribution waterfalls provide a structured way to allocate profits, they also have some limitations:


The waterfall effect shows how profits are shared in stages. It follows a set order; investors are paid first. Then, fund managers. Each step depends on reaching certain returns. It ensures fair and structured payouts.
The American waterfall pays profits deal by deal. Fund managers receive carried interest after each successful exit. Full fund performance isn’t required. It leads to quicker payouts and is popular with General Partners for early reward opportunities.
The first step is the return of capital. Investors get their initial investment back; no profits are split before this. It protects investors, ensuring their capital is recovered before earnings are shared.
A private equity waterfall is more than a payout model. It sets the rules for sharing profits, ensuring investors and fund managers are fairly treated.
Each step has a purpose. Return of capital protects the initial investment. Preferred return rewards patience. Whereas catch-up and profit split motivate fund performance.
Think of it as a structured journey, from invested dollars to shared returns. A good financial performance analysis example will always include this flow. It shows how and when returns are earned.
A monthly finance report helps visualize progress. It shows how close the fund is to meeting its targets. It’s a clear tool for both LPs and GPs.
Private equity waterfall is also connected to long-term thinking. They help align actions with big-picture goals. They’re a solid part of any long-term financial goals in investment planning.
In conclusion, a well-built private equity waterfall drives trust, keeps everyone focused and accountable, and brings structure to a complex financial process. Installing ChartExpo further enhances this by making data visualization and reporting more efficient.
So, do not hesitate. Install ChartExpo today to revolutionize how you work with your financial data.
How much did you enjoy this article?


Calculate accounts receivable turnover ratio to measure credit collection speed, improve cash flow, and strengthen your financial strategy. Read on!

Change Management KPIs are the key to tracking adoption, performance, and ROI during transitions. Find out which metrics matter. Read on!

Data collection methods and techniques determine the quality of every insight you act on. Explore key approaches for gathering reliable data. Read on!


