Categories
A Multiple Bar Graph in Excel is one of the best-suited visualization designs in comparing within-groups and between-groups comparison insights.


The chart is straightforward and easy to read and understand.
Popular and widely used visualization tools, such as Excel, lack ready-made Multiple Bar Charts.
But you can transform the application into a reliable tool by installing third-party add-ins to access visually appealing and ready-to-use Multiple Bar Graph in Excel.
A Multiple Bar Graph is a visualization you can use to compare two or more varying metrics in your data.
The chart is made up of bars with contrasting colors to help you visualize varying data points. Interpreting a Multiple Bar Graph in Excel is similar to a typical Bar Chart.
Yes, you read that right.
If your goal is to display the composition and comparison of key variables in your data, your go-to chart should be a Multiple Bar Graph in Excel, such as a Grouped Bar Chart.
A Multiple Bar Chart is a way of summarizing a set of categorical data (continuous data can be made categorical by auto-binning). Similarly, a Stacked Bar Chart can be used to show how sub-categories contribute to each bar.
A frequency chart in Excel is also useful for visualizing how data is distributed across categories or bins. As it is, a Histogram is used to represent the distribution of continuous data by grouping it into bins and displaying the frequency of each bin.
The height of each bar is proportional to a specific aggregation (for example, the sum of the values in the category it represents). The categories could be something like an age group or a geographical location.
Also, it’s possible to color or split each bar into another categorical column in the data, which enables you to see the contribution from different categories to each bar or group of bars in the bar chart, making it a powerful tool for multivariate analysis. This approach works especially well in a clustered column chart in Excel, where grouped columns make category comparisons clearer and more structured.
Bar graphs are an effective way to compare items between different groups. You can easily compare the data by a quarter on a year-over-year trend, and also see how the annual sales are distributed throughout each year.
Bar graphs are amazingly effective visuals to use in presentations and reports. Also, they’re popular because they allow the reader to recognize patterns or trends far more easily than looking at a table of numerical data
Keep reading because we’ll cover the following in the coming section: when to use a Multiple Bar Graph?
Multiple Bar Charts are effective, especially in comparing key data points. For instance, you can use the chart to compare the performance of strategic metrics, such as profit versus costs.
The visualization design is easy to decode, just like a typical Bar Chart. Besides, you can leverage the charts if your goal is to display the overall patterns and trends.
The charts are tested and proven to be effective in business presentations and reports.
A Multiple Bar Graph, such as a clustered stacked bar chart example, simplifies the data analysis process, especially if your goal is to visualize bulky and complex data sets. Besides, this chart type displays a sizable number of insights, such as relationships, trends, and patterns.
The Multiple Bar Graph example is the go-to visualization design if your goal is to track real-time changes in your data.
Ensure all the bars in the chart originate from a zero-value baseline. And this is because it will increase the reliability of the insights.
You have an option of organizing bars in your chart from the smallest to the largest and vice versa.
Some tools use heavy color bars in a multiple-bar graph or stacked bar diagram in a way that can distract readers or distort insights. Use high-contrast and lighter color shades to communicate comparisons effectively.
Provide your chart with adequate legends on both axes to help your readers establish the context of your data story.
The spaces between each bar should not be bigger than the width, especially when presenting comparative visuals like a percentage bar graph, to keep the chart easy to read and visually balanced.
Keep reading because we’ll cover the following topic in the coming section: How to make a Multiple Bar Graph in Excel?
Excel is one of the most used tools for visualizing data because it’s readily available and easy to use.
However, the application comes with a pretty basic Multiple Bar Graph. And this implies you’ve got to spend extra time and effort editing the chart to align with your requirements.
But this does not mean you should ditch this freemium data visualization tool.
Did you know you can supercharge your add-ins on Excel Mac to access visually stunning and ready-to-go Multiple Bar Charts?
Yes, you can increase the functionality of your tool and access ready-made Multiple Bar Graphs in Excel for your data stories.
The add-in for Excel we recommend you use is ChartExpo.
So, what is ChartExpo?
We recommend this tool (ChartExpo) because it’s ultra-easy to use.
You don’t need to take coding night classes to extract insights from your data. ChartExpo is more of a ‘drag-and-drop tool,’ which means you’ll only need to scroll your mouse, use the Side-By-Side Bar graph in Excel feature, and fill in respective metrics and dimensions in your data.
The Multiple Bar Chart in Excel generator comes with a 7-day free trial period.
ChartExpo produces charts that are incredibly easy to read and interpret. Besides, it allows you to save charts in the world’s most recognized formats, namely PNG and JPG.


This section will use a Grouped Bar Chart (a Multiple Bar Graph variant) to visualize the tabular data below.
| Products | Q1 | Q2 | Q3 |
| Rolex | 500 | 1000 | 1200 |
| Patek Philippe | 400 | 290 | 150 |
| Omega | 470 | 342 | 200 |
| Audemars Piguet | 900 | 622 | 110 |
| Piaget | 430 | 600 | 220 |
| Cartier | 290 | 550 | 900 |
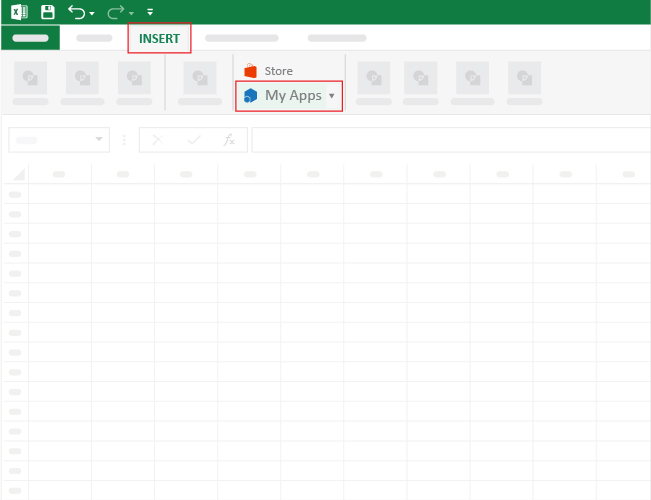
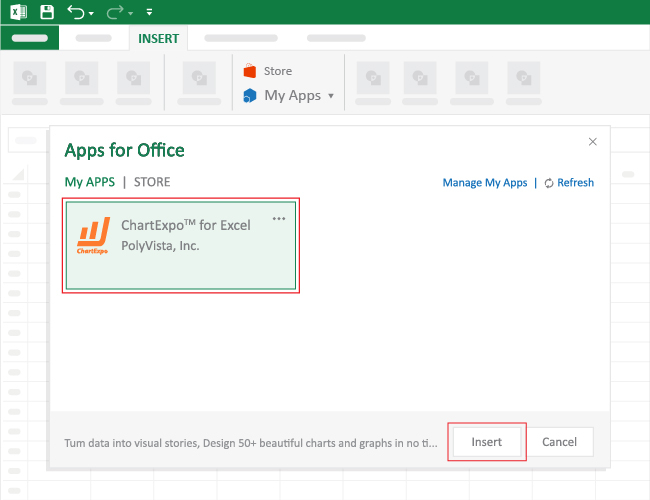
Install the ChartExpo into your Excel by clicking this link to get started.


You can see how well a Bar Chart presents data with 3 variables.
Multiple Bar Charts are effective, especially in comparing key data points. For instance, you can use the chart to compare the performance of strategic metrics, such as profit versus costs.
The visualization design is incredibly easy to decode, just like a typical Bar Chart.
A Multiple Bar Graph is a visualization you can use to compare two or more varying metrics in your data.
The chart is made up of bars with contrasting colors to help you visualize varying data points. Interpreting a Multiple Bar Graph is similar to a typical Bar Chart.


As we said, a Multiple Bar Graph in Excel is one of the best-suited visualization designs for comparing within-group and between-group comparison insights.
The chart is amazingly easy to read and understand.
Popular and widely used visualization tools, such as Excel, lack ready-made Grouped Bar Charts. We’re not recommending you do away with the data visualization application.
So, what’s the solution?
Download and install third-party apps, such as ChartExpo, in Excel to access ready-to-use Grouped Bar Charts.
ChartExpo is an add-in for Excel loaded with insightful and ready-to-go Multiple Bar Graph, plus many more advanced charts. You don’t need programming or coding skills to visualize your data using the Multiple Bar Graph in ChartExpo.
How to make a Multiple Bar Graph in Excel should never be a stressful affair.
Sign up for a 7-day free trial today to access ready-made Multiple Bar Charts that are easy to interpret and visually appealing to your target audience.
How much did you enjoy this article?


Learn how to use sparklines in Excel to quickly visualize trends inside cells. Discover types, creation steps, customization, use cases, benefits, and best practices.

Learn what a confidence interval graph is, how to create it in Excel, and how to interpret results to make more reliable, data-driven decisions.

A correlation matrix in Excel helps identify relationships between variables. Learn how to create, read, and use it for effective data analysis.


