• Home
  • Tools dropdown img
    • Spreadsheet Charts

      • ChartExpo for Google Sheets
      • ChartExpo for Microsoft Excel
    • Power BI Charts

      • Power BI Custom Visuals by ChartExpo
    • Word Cloud

  • Charts dropdown img
    • Chart Category

      • Bar Charts
      • Circle Graphs
      • Column Charts
      • Combo Charts
      • Comparison Charts
      • Line Graphs
      • PPC Charts
      • Sentiment Analysis Charts
      • Survey Charts
    • Chart Type

      • Box and Whisker Plot
      • Clustered Bar Chart
      • Clustered Column Chart
      • Comparison Bar Chart
      • Control Chart
      • CSAT Survey Bar Chart
      • CSAT Survey Chart
      • Dot Plot Chart
      • Double Bar Graph
      • Funnel Chart
      • Gauge Chart
      • Likert Scale Chart
      • Matrix Chart
      • Multi Axis Line Chart
      • Overlapping Bar Chart
      • Pareto Chart
      • Radar Chart
      • Radial Bar Chart
      • Sankey Diagram
      • Scatter Plot Chart
      • Slope Chart
      • Sunburst Chart
      • Tornado Chart
      • Waterfall Chart
      • Word Cloud
    • Google Sheets
      Microsoft Excel
  • Services
  • Pricing
  • Contact us
  • Blog
  • Support dropdown img
      • Gallery
      • Videos
      • Contact us
      • FAQs
      • Resources
    • Please feel free to contact us

      atsupport@chartexpo.com

Categories
All Data Visualizations Data Analytics Surveys
Add-ons/
  • Google Sheets
  • Microsoft Excel
  • Power BI
All Data Visualizations Data Analytics Surveys
Add-ons
  • Google Sheets
  • Microsoft Excel
  • Power BI

We use cookies

This website uses cookies to provide better user experience and user's session management.
By continuing visiting this website you consent the use of these cookies.

Ok

ChartExpo Survey


Home > Blog > Data Analytics

Marginal Cost vs. Marginal Benefit: What’s the Difference?

Imagine this scenario: You are at your favorite pizza shop, contemplating getting another slice. The concept of marginal benefit vs. marginal cost is active in the subconscious.

The extra piece gives a slight advantage by offering satisfaction. On the other hand, the marginal cost reflects the additional cost of producing and selling that particular slice.

marginal benefit vs marginal cost

The maximum price a consumer is willing to pay for an extra unit is known as a marginal benefit. Marginal cost quantifies the change in cost when producing an additional unit of the product or service. These concepts are essential for companies. Why? They help determine the optimal level of production to maximize profits.

Consider this: When marginal benefit equals marginal cost, it signifies market efficiency. However, inefficiency arises when the two don’t align, prompting the need to adjust the quantity produced.

This dynamic relationship extends beyond business and plays a vital role in public policy. Elected officials often grapple with allocating limited resources among various programs. They must assess the marginal benefit of each program to make informed decisions regarding resource allocation. This balancing act is crucial to maximize community benefit and cost management effectively.

Now, let’s explore the complexities of marginal benefit and marginal cost, examining real-life scenarios and practical uses.

Table of Contents:

  1. What is Marginal Cost?
  2. What is Marginal Benefit?
  3. Marginal Benefit vs. Marginal Cost Examples
  4. What is the Difference between Marginal Benefit and Marginal Cost?
  5. How to Calculate Marginal Benefit and Marginal Cost in Power BI?
  6. How to Create Marginal Benefit and Marginal Cost Graph in Power BI?
  7. Wrap Up

First…

What is Marginal Cost?

Definition: Marginal cost is the cost of producing one additional unit of a good or service. It reflects the change in total production costs when output is increased by one unit. This concept is crucial in economics and business decision-making.

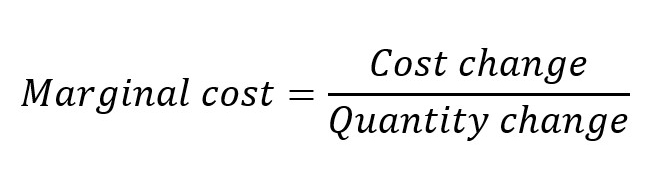
To calculate marginal cost, divide the change in total cost by the change in quantity produced. It helps businesses determine the most efficient level of production. If the marginal cost is lower than the selling price, producing more can be profitable. Conversely, if the marginal cost exceeds the selling price, producing more would lead to losses.

Marginal Cost Formula After Learning Marginal Benefit vs Marginal Cost

Marginal costs can fluctuate based on factors such as production efficiency, resource availability, and economies of scale. Understanding marginal cost aids in pricing strategies, budgeting, and optimizing resource allocation. It ensures companies make informed decisions to maximize profits while managing production costs effectively.

What is Marginal Benefit?

Definition: Marginal benefit is the additional gain from consuming one more unit of a good or service. It measures the value or customer satisfaction gets from an increase in consumption. This concept is key in economics for understanding consumer behavior and decision-making.

To calculate the marginal benefit, assess the change in total benefit when consumption increases by one unit. The marginal benefit often decreases as consumption rises due to the principle of diminishing marginal utility. The first unit consumed typically provides the highest benefit, with each subsequent unit offering less additional satisfaction.

The marginal benefit helps consumers decide how much of a good or service to purchase. It also guides producers in setting prices and production levels.

When marginal benefit equals marginal cost, resources are allocated efficiently, maximizing overall satisfaction. Understanding marginal benefit ensures that consumers and producers make optimal decisions for maximum utility and profit.

Marginal Benefit vs. Marginal Cost Examples

Types of Marginal Cost

Marginal cost can be categorized into several types, each reflecting different aspects of production and business operations:

  • Unit costs: These are the additional costs incurred by producing one more unit of a product. It includes direct materials, direct labor, and variable overheads. Understanding unit costs helps in pricing individual items effectively.
  • Batch costs: These costs are associated with producing a batch of units rather than a single unit. They include setup costs, inspection costs, and transportation costs. Batch costs are important for managing production runs and scheduling.
  • Product costs: These are the costs of producing a specific product line. They encompass market research and development, design, and marketing. Analyzing product costs aids in assessing the profitability of different products.
  • Customer costs: These are the costs of serving a particular customer. They include customer service, returns processing, and personalized services. Customer costs help in understanding customer profitability and tailoring service levels.
  • Organization costs: These costs, often detailed in an expense report for a small business, are incurred to maintain the overall organization. They include administrative expenses, management salaries, and utilities. Organization costs are crucial for assessing the overall efficiency and scalability o

Types of marginal benefits

Marginal benefits can be categorized into several types, reflecting different scenarios of consumption:

  • Positive benefit: This occurs when consuming an additional unit of a good or service increases overall satisfaction or utility. For instance, eating another slice of pizza adds to one’s enjoyment. Positive marginal benefits encourage continued consumption up to a certain point.
  • Negative benefit: This happens when consuming an additional unit decreases overall satisfaction or utility. For example, overeating pizza might lead to discomfort. Negative marginal benefits signal that further consumption is counterproductive.
  • Zero benefits: This is when consuming an additional unit neither increases nor decreases overall satisfaction or utility. At this point, the consumer is fully satisfied, and extra consumption doesn’t add value. Zero marginal benefit indicates that the optimal level of consumption has been reached.

What is the Difference between Marginal Benefit and Marginal Cost?

Marginal benefit vs. marginal cost: Let’s break down their differences:

Aspect Marginal Benefit Marginal Cost
Definition The additional satisfaction or utility gained from consuming one more unit of a good or service. The additional cost incurred from producing one more unit of a good or service.
Focus Consumer perspective – what do I gain from one more unit? Producer perspective – what does it cost to make one more unit?
Measurement Change in total benefit due to an extra unit. Change in total cost due to an extra unit.
Principle Tied to the law of diminishing marginal utility – benefits decrease with each additional unit. Tied to production costs, which can increase or decrease with scale.
Decision-Making Helps consumers decide how much to consume based on added satisfaction. Helps producers decide how much to produce based on cost efficiency.
Optimal Point Consumption continues until marginal benefit equals marginal cost. Production continues until marginal cost equals marginal benefit.

How to Calculate Marginal Benefit and Marginal Cost in Power BI?

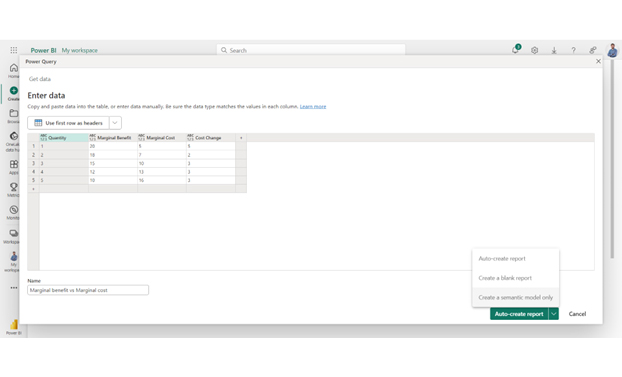
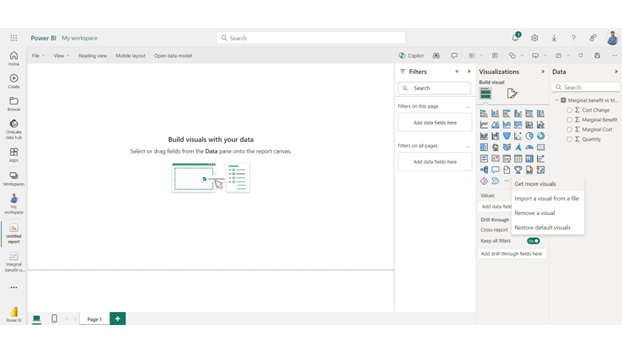
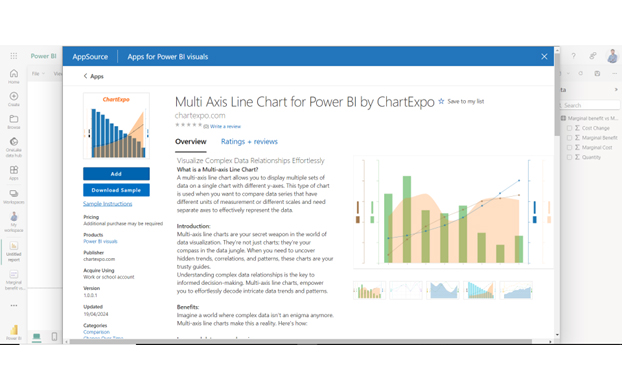
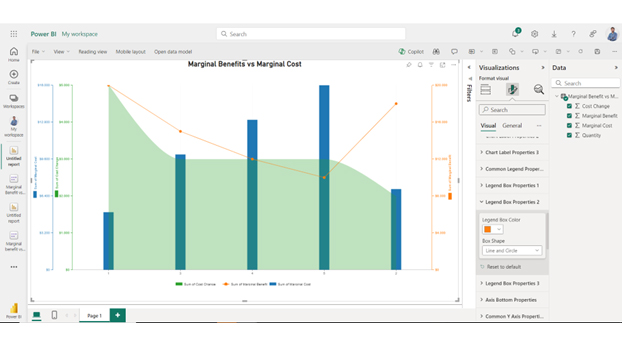
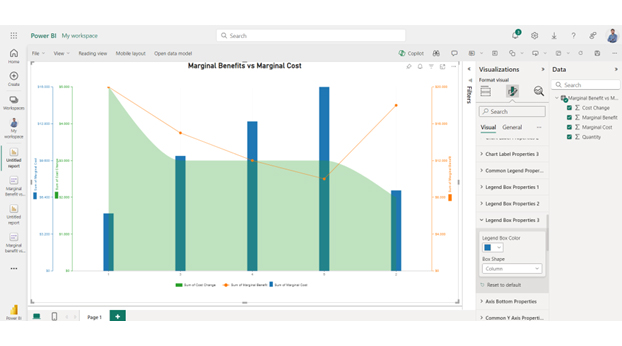
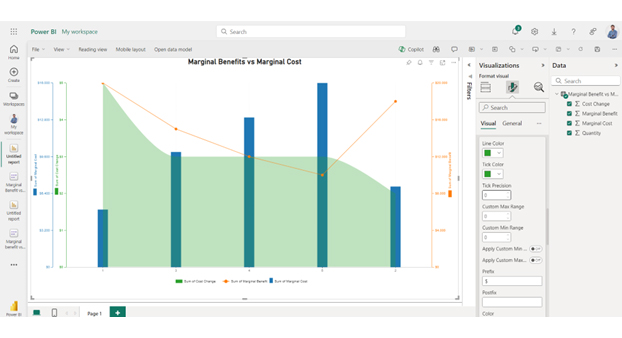
In Power BI, DAX formulas can be utilized to calculate marginal benefit and marginal cost. This is the process broken down into steps:

Marginal Benefit Calculation

Assume you have a table containing columns for Total Benefits and Units Consumed.

  1. Create a new column for Marginal Benefits.
  2. Navigate to the Data View section.
  3. Select your table and then choose the “New Column” option.
  4. Input the DAX formula below:

Marginal Benefit =

VAR CurrentUnit = ‘YourTable'[Units Consumed]

VAR CurrentBenefit = ‘YourTable'[Total Benefit]

VAR PreviousBenefit =

CALCULATE(

MAX(‘YourTable'[Total Benefit]),

FILTER(‘YourTable’, ‘YourTable'[Units Consumed] = CurrentUnit – 1)

)

RETURN

IF(

ISBLANK(PreviousBenefit),

BLANK(),

CurrentBenefit – PreviousBenefit

)

Interpretation:

This DAX formula calculates the change in total benefit between the current and previous units, indicating the marginal benefit.

Marginal Cost Calculation

Assume you have a table with columns for Units Produced and Total Costs.

  1. Create a new column for Marginal Cost.
  2. Go to the Data view.
  3. Select your table and then click “New Column” from the menu.
  4. Input the DAX formula below:

Marginal Cost =

VAR CurrentUnit = ‘YourTable'[Units Produced]

VAR CurrentCost = ‘YourTable'[Total Cost]

VAR PreviousCost =

CALCULATE(

MAX(‘YourTable'[Total Cost]),

FILTER(‘YourTable’, ‘YourTable'[Units Produced] = CurrentUnit – 1)

)

RETURN

IF(

ISBLANK(PreviousCost),

BLANK(),

CurrentCost – PreviousCost

)

Explanation:

This DAX expression determines the marginal cost by finding the total cost variance between the current and preceding units.

How to Create Marginal Benefit and Marginal Cost Graph in Power BI?

Stage 1: Logging in to Power BI

  • Log in to Power BI.
  • Enter your email address and click the “Submit” button.
Enter email to login to Power BI
  • You are redirected to your Microsoft account.
  • Enter your password and click “Sign in“.
Enter Password to login to Power BI
  • You can choose whether to stay signed in.
Click on stay signed in
  • Once done, the Power BI home screen will open.

Stage 2: Creating a Data Set and Selecting the Data Set to Use in Your Chart

  • Go to the left-side menu and click the “Create” button.
  • Select “Paste or manually enter data“.
select Paste or manually enter data in Power BI ce487
  • We’ll use the sample data below for this example.
  • Paste this data table in the Power Query Window.
Quantity Marginal Benefit Marginal Cost Cost Change
1 20 5 5
2 18 7 2
3 15 10 3
4 12 13 3
5 10 16 3
  • Select the “Create a dataset only” option.
Click Create A Dataset Only After Learning Marginal Benefit vs Marginal Cost
  • On the left-side menu, click “Data Hub”.
  • Power BI populates the data set list. (If you have not created a data set, refer to the Error! Reference source not found section).
  • Click on the “Create a report” drop-down.
Click Create A Report After Learning Marginal Benefit vs Marginal Cost
  • After clicking on “Expand All,” you can see your chart metrics:
  • Add the checked dimensions and metrics:
  • Click on “Get more visuals”.
  • You can search ChartExpo and select Multi-Axis Line Chart:
Click Get More Visuals After Learning Marginal Benefit vs Marginal Cost
  • Click the “Add” button.
Click Add Button After Learning Marginal Benefit vs Marginal Cost
  • You can now see the Multi-Axis Line Chart icon in the visualizations list.
Multi Axis Line Chart Icon After Learning Marginal Benefit vs Marginal Cost
  • In visual, click on License Settings and add the key:
  • After adding the key, you can see the Multi-Axis Line Chart:
Add License Key After Learning Marginal Benefit vs Marginal Cost
  • Now you can add the Header text on top of the chart as follows:
Add Chart Header After Learning Marginal Benefit vs Marginal Cost
  • You can add the dollar sign with all values as follows:
Add Prefix After Learning Marginal Benefit vs Marginal Cost
  • Change the Sum of Marginal Cost into Bar as follows:
Change Sum of Marginal Cost After Learning Marginal Benefit vs Marginal Cost
  • Change the legend shape of the Sum of Marginal Benefits into Line and Circle:
Change Legend Shape of Sum of Marginal Benefits After Learning Marginal Benefit vs Marginal Cost
  • Change the legend shape of the Sum of Marginal Cost into Column:
Change Legend Shape of Sum of Marginal Cost After Learning Marginal Benefit vs Marginal Cost
  • Change the precision of all values to zero as follows:
Change Precision of All Zero After Learning Marginal Benefit vs Marginal Cost
  • Your Multi Axis Line Chart final look in Power BI:
Final After Learning Marginal Benefit vs Marginal Cost

Insights

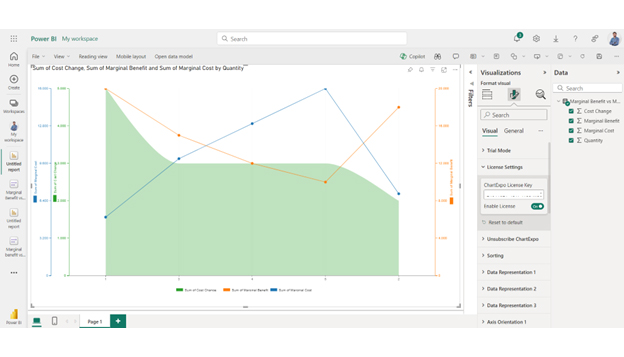
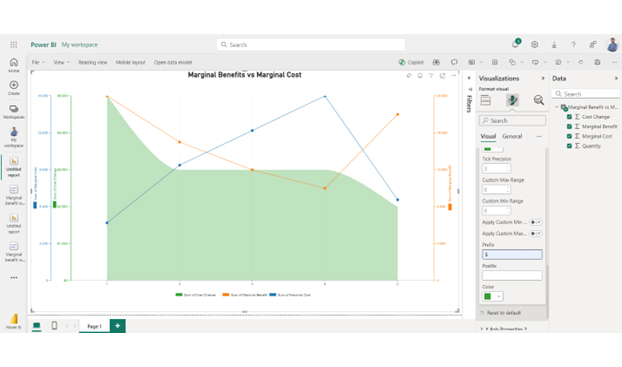
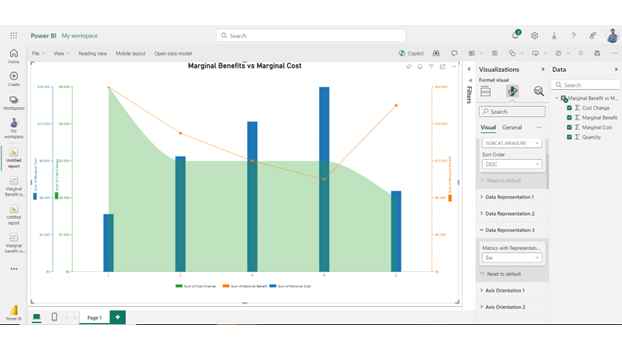
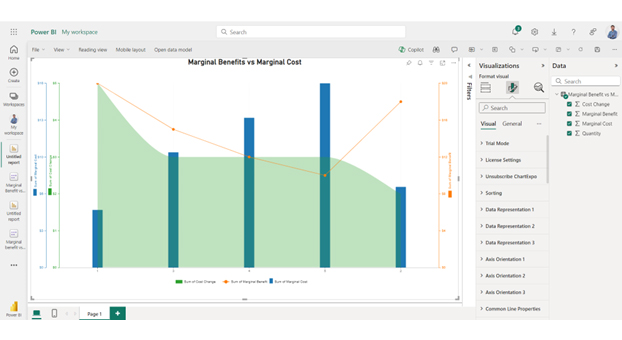
As the quantity increases, the marginal benefits decrease while the marginal costs increase. Initially, the advantages of producing something are greater than the disadvantages, leading to profitability. However, after the third unit, the marginal cost increase outweighs the marginal benefits. This results in lower profits and implies that producing over three units is not economically viable.

Wrap Up

Marginal benefit and marginal cost are essential concepts in economics. They guide decision-making for both consumers and producers. Understanding these concepts helps in optimizing resources.

Marginal benefit is the added satisfaction from consuming one more unit of a good or service. It reflects the consumer’s perspective. As consumption increases, the marginal benefit typically decreases. This is due to the law of diminishing marginal utility.

Marginal cost is the added expense of producing one more unit. It reflects the producer’s perspective. Initially, marginal costs may be low but can increase with higher production levels. This rise can be due to factors like resource limitations.

When marginal benefit exceeds marginal cost, more consumption or production is encouraged. This leads to higher utility or profit. It ensures that resources are used efficiently. However, this balance does not always hold.

As more units are consumed or produced, a marginal benefit often decreases. Meanwhile, marginal costs can rise. Eventually, a point is reached where marginal cost equals marginal benefit. This equilibrium is crucial.

At equilibrium, resources are optimally allocated. Consumers get maximum satisfaction, and producers maximize profit. Beyond this point, increasing consumption or production can lead to inefficiencies. Understanding this balance is key in economics.

In conclusion, marginal benefit and marginal cost are vital in guiding economic decisions. They help determine optimal consumption and production levels. Balancing these concepts helps consumers and producers make informed, efficient choices. This balance ensures the best use of resources, maximizing overall welfare.

How much did you enjoy this article?

PBIAd1
Start Free Trial!
136625

Related articles

next previous
Data Analytics31 min read

Data Analysis Without Nonsense: Fix the Right Problem, Fast

Data analysis can mislead when metrics look right but outcomes fail. Learn how to spot red flags, fix failures, and make better decisions. Read on!

Data Analytics29 min read

Variance Analysis Isn’t a Math Problem, It’s a Trust Problem

Variance analysis helps identify what went wrong, who owns it, and what to do next. Use it to drive decisions, not just reports. Learn more!

Data Analytics10 min read

Supplier Comparison Template: Download It Now

A supplier comparison template streamlines vendor evaluation by comparing cost and quality. Click here to learn its benefits and how to analyze them.

Data Analytics32 min read

Ecommerce Analytics: How to Fix What It Often Gets Wrong

Ecommerce analytics often lead to mixed signals and costly misreads. Fix attribution gaps, align teams, and act on the right data. Get started now!

Data Analytics30 min read

When Sales Funnel Breaks: Failures, Fixes, & Funnel Debt

Is your sales funnel hiding costly gaps? Learn how pipeline stalls, false metrics, and handoff chaos could be draining revenue. Get started now!

ChartExpo logo

Turn Data into Visual
Stories

CHARTEXPO

  • Home
  • Gallery
  • Videos
  • Services
  • Pricing
  • Contact us
  • FAQs
  • Privacy policy
  • Terms of Service
  • Sitemap

TOOLS

  • ChartExpo for Google Sheets
  • ChartExpo for Microsoft Excel
  • Power BI Custom Visuals by ChartExpo
  • Word Cloud

CATEGORIES

  • Bar Charts
  • Circle Graphs
  • Column Charts
  • Combo Charts
  • Comparison Charts
  • Line Graphs
  • PPC Charts
  • Sentiment Analysis Charts
  • Survey Charts

TOP CHARTS

  • Sankey Diagram
  • Likert Scale Chart
  • Comparison Bar Chart
  • Pareto Chart
  • Funnel Chart
  • Gauge Chart
  • Radar Chart
  • Radial Bar Chart
  • Sunburst Chart
  • see more
  • Scatter Plot Chart
  • CSAT Survey Bar Chart
  • CSAT Survey Chart
  • Dot Plot Chart
  • Double Bar Graph
  • Matrix Chart
  • Multi Axis Line Chart
  • Overlapping Bar Chart
  • Control Chart
  • Slope Chart
  • Clustered Bar Chart
  • Clustered Column Chart
  • Box and Whisker Plot
  • Tornado Chart
  • Waterfall Chart
  • Word Cloud
  • see less

RESOURCES

  • Blog
  • Resources
  • YouTube
SIGN UP FOR UPDATES

We wouldn't dream of spamming you or selling your info.

© 2025 ChartExpo, all rights reserved.