• Home
  • Tools dropdown img
    • Spreadsheet Charts

      • ChartExpo for Google Sheets
      • ChartExpo for Microsoft Excel
    • Power BI Charts

      • Power BI Custom Visuals by ChartExpo
    • Word Cloud

  • Charts dropdown img
    • Chart Category

      • Bar Charts
      • Circle Graphs
      • Column Charts
      • Combo Charts
      • Comparison Charts
      • Line Graphs
      • PPC Charts
      • Sentiment Analysis Charts
      • Survey Charts
    • Chart Type

      • Box and Whisker Plot
      • Clustered Bar Chart
      • Clustered Column Chart
      • Comparison Bar Chart
      • Control Chart
      • CSAT Survey Bar Chart
      • CSAT Survey Chart
      • Dot Plot Chart
      • Double Bar Graph
      • Funnel Chart
      • Gauge Chart
      • Likert Scale Chart
      • Matrix Chart
      • Multi Axis Line Chart
      • Overlapping Bar Chart
      • Pareto Chart
      • Radar Chart
      • Radial Bar Chart
      • Sankey Diagram
      • Scatter Plot Chart
      • Slope Chart
      • Sunburst Chart
      • Tornado Chart
      • Waterfall Chart
      • Word Cloud
    • Google Sheets
      Microsoft Excel
  • Services
  • Pricing
  • Contact us
  • Blog
  • Support dropdown img
      • Gallery
      • Videos
      • Contact us
      • FAQs
      • Resources
    • Please feel free to contact us

      atsupport@chartexpo.com

Categories
All Data Visualizations Data Analytics Surveys
Add-ons/
  • Google Sheets
  • Microsoft Excel
  • Power BI
All Data Visualizations Data Analytics Surveys
Add-ons
  • Google Sheets
  • Microsoft Excel
  • Power BI

We use cookies

This website uses cookies to provide better user experience and user's session management.
By continuing visiting this website you consent the use of these cookies.

Ok

ChartExpo Survey


Home > Blog > Microsoft Excel

How to Parse Data in Excel: A Complete Guide

How to parse data in Excel? If you’ve ever opened a messy dataset, you know the struggle. Numbers, text, and symbols are crammed into a single column. Reports with names, dates, and IDs all jumbled together. Sorting through this chaos manually wastes time.

How to parse data in Excel

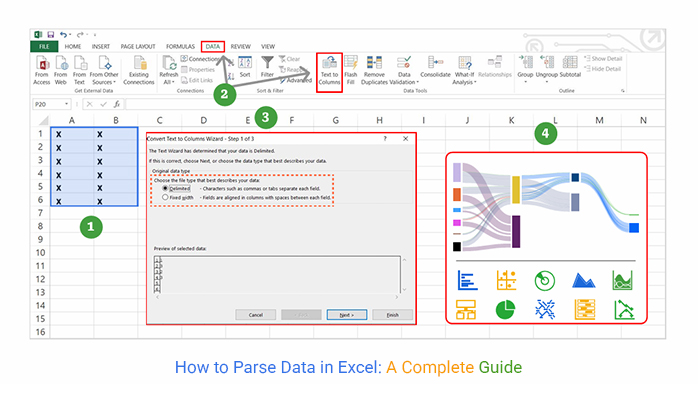
Data parsing helps extract useful information, and businesses rely on it to clean raw data. According to a study by McKinsey, companies that use data-driven decision-making are 23 times more likely to acquire customers. Yet, bad data costs U.S. businesses an estimated $3.1 trillion annually. Excel offers powerful tools to fix these issues.

Parsing data in Excel with formulas automates the process. Functions like TEXT, LEFT, MID, and FIND separate names from email addresses. Flash Fill detects patterns and fills in missing details, whereas Power Query transforms unstructured data into clean tables. These tools help analysts work faster and reduce errors.

Think of customer feedback forms. If names, emails, and comments are stored in one column, extracting key details becomes difficult. Excel splits this information into separate fields, making it easier to analyze. The same applies to sales reports, financial records, and log files.

Learning how to parse data in Excel saves hours of work. Instead of sorting manually, formulas and built-in tools do the job instantly. Whether handling invoices, survey results, or inventory lists, Excel makes data parsing efficient.

How?

Let’s find out…

Table of Contents:

  1. What is Data Parsing in Excel?
  2. Why Parse Data in Excel?
  3. What are Advanced Parsing Techniques in Excel?
  4. How to Parse Data in Excel with Formulas?
  5. How to Parse Data in Excel?
  6. How to Analyze Parsed Data in Excel?
  7. Pros & Cons of Parsing Data in Excel
  8. Tips for Efficient Data Parsing in Excel
  9. Best Practices of Parsing PDF Into Excel
  10. FAQs
  11. Wrap Up

What is Data Parsing in Excel?

Definition: Data parsing in Excel is the process of separating and organizing raw data into meaningful and structured information. It helps extract specific information from messy datasets. Businesses use it to clean reports, filter text, and structure data for analysis. Excel offers functions and tools to automate parsing.

Data transformation in Excel reshapes messy datasets into structured formats. Functions like TEXT, LEFT, and MID automate the process. These tools reduce manual work and prevent errors. Clean data leads to better insights, and mastering parsing techniques saves time and improves data analysis efficiency.

Top 5 Charts You Can Create After Parsing Data in Excel

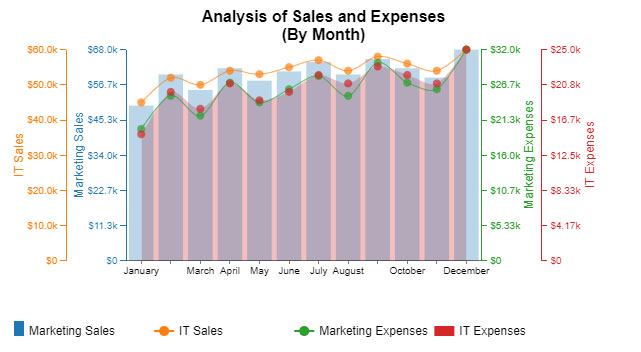
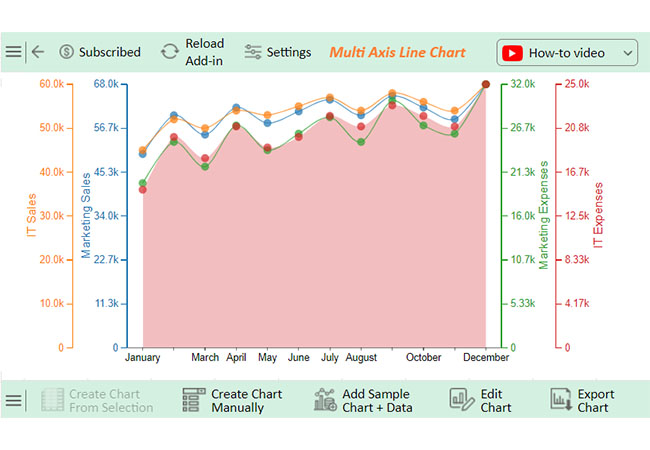
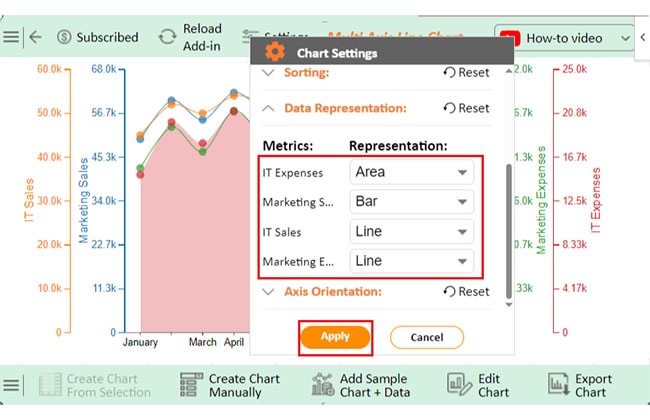
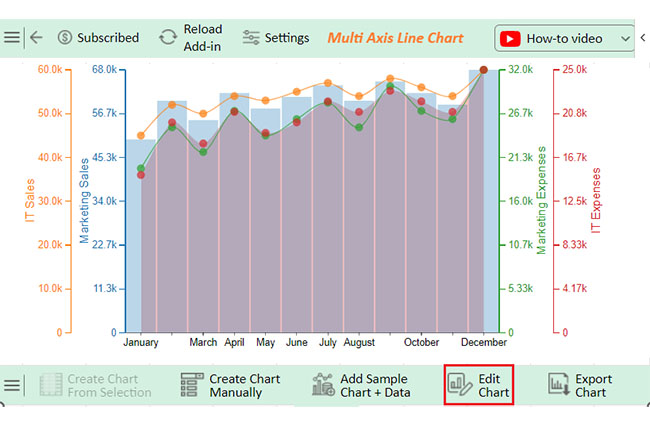
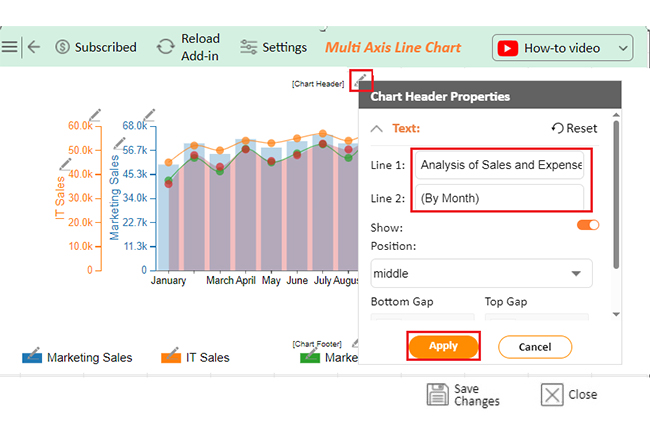
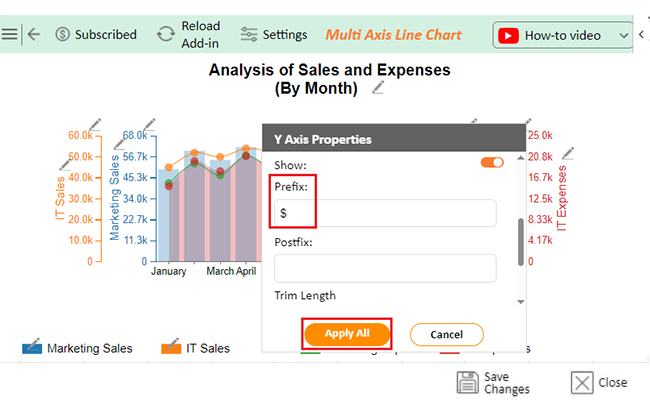
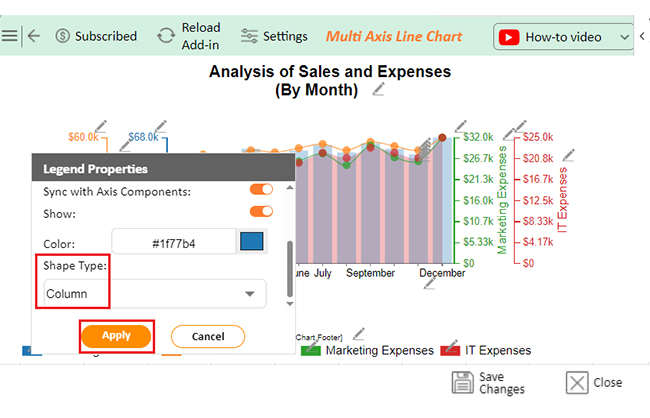
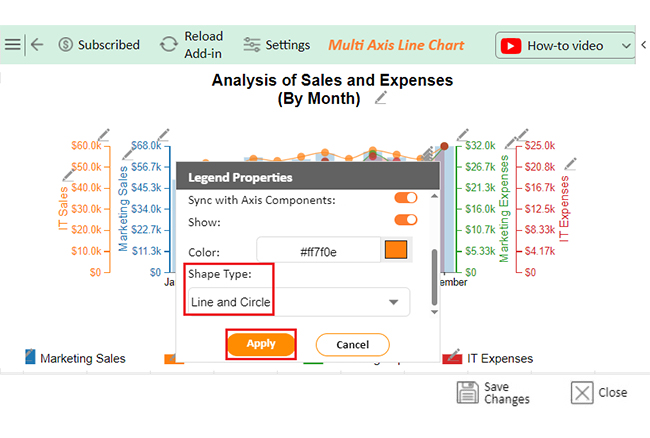
Check out these top five charts to visualize and analyze the data you’ve parsed in Excel. These charts, created using ChartExpo, make insights clearer and decision-making easier.

Multi Axis Line Chart

How to parse data in Excel

Mosaic Plot (aka Mekko)

How to parse data in Excel

Multi-Axis Spider Chart

How to parse data in Excel

Sankey Chart:

How to parse data in Excel

Stacked Waterfall Chart

How to parse data in Excel

Why Parse Data in Excel?

Do you struggle with unsorted data in Excel? This will help you save time and spare yourself the frustration of having to parse through your data manually. You make decisions faster and better by turning messy information into structured, easy-to-analyze formats.

These are the reasons why parsing data in Excel is a game-changer.:

  • Improves data organization: Whether you’re working with dates, names, or transaction IDs, organizing your data into separate columns makes things clearer. This format makes it easy to spot trends and patterns.
  • Enhances data analysis: When parsed, you can use Excel data analysis functions more effectively. You can apply filters, functions, and formulas to get precise insights.
  • Simplifies data cleaning: Parsing helps remove unnecessary characters and correct errors. It eliminates the need for manual corrections, leading to a more polished dataset ready for deeper analysis or reporting.
  • Automates repetitive tasks: You can automate monotonous tasks such as parsing text, dates, or numbers into separate cells. Built-in tools are also available in Excel to help speed up data processing and reduce manual effort. This enables you to work much more efficiently and smoothly.
  • Facilitates better decision-making: Parsed data lets you analyze trends at a high confidence level, predict results, and ensure strategic optimization. The more accurate your data, the better your decisions.

What are Advanced Parsing Techniques in Excel?

Basic parsing isn’t always enough to handle larger, messier datasets. That’s where advanced techniques in Excel can help streamline your workflow and data accuracy:

  1. Power Query (Get & Transform): This function automates cleaning, altering, and reshaping datasets for analysis. It is more helpful for data linking in Excel when merging data from multiple related datasets.
  2. Flash Fill: Flash Fill auto-detects a pattern and quickly completes the rest of the data entry. It can help with charting data by quickly formatting and preparing it for visualization.
  3. Advanced Text Functions: Functions like MID, LEFT, and FIND allow you to extract specific data from text. They are ideal when performing Excel functions for data analysis, as they simplify complex parsing tasks.
  4. Dynamic Arrays for Parsing: Dynamic Arrays let you work with entire columns or rows simultaneously, enabling more efficient parsing. This can be especially useful when preparing data for Excel charts for detailed analysis.
  5. Regular Expressions (Regex in VBA): Regex in VBA allows for complex data extraction and manipulation. It’s perfect for parsing text-heavy datasets, especially when you need to merge or transform data for analysis.

How to Parse Data in Excel with Formulas?

When working with large datasets in Excel, parsing data is essential to make your data easier to analyze and present. Using formulas allows you to extract, clean, and structure your data efficiently, and here’s how you can do it:

  1. Extracting text using LEFT, RIGHT, MID: These functions help isolate specific text parts from a cell. They’re ideal for preparing to create a report in Excel. Why? They allow you to split data into smaller sections for clearer reporting.
  2. Finding positions with FIND, SEARCH: The SEARCH function helps locate the position of specific characters within a string. It’s beneficial when working with Weighted Average in Excel. Why? It allows you to focus on key data points for precise calculations.
  3. Splitting text with TEXTSPLIT (Excel 365): TEXTSPLIT is a powerful tool for dividing data into separate columns or rows. It comes in handy when preparing chart elements in Excel. It ensures each piece of data is organized properly for smooth chart creation.
  4. Combining functions: Sometimes, you need to combine multiple functions to extract the right data. For example, combining SEARCH and MID allows you to pull out specific portions of a text string based on its position. This approach is handy when dealing with large datasets that require multiple transformations.

How to Parse Data in Excel?

Parsing data in Excel is simple. Using the right tools and techniques, you can convert messy datasets into clean, structured information ready for analysis or reporting.

Here is how you can do it swiftly:

  • Using Text to Columns: Text to Columns is one of those very uncomplicated yet powerful Excel features. It allows you to split data into different columns based on a delimiter. This feature helps prepare to create a dashboard using Excel, letting you separate data categories for visualization.
  • Using formulas: Excel formulas such as MID, LEFT, and RIGHT allow you to extract particular text parts from a cell. These are perfect when you need to manipulate or combine data from multiple sources into one.
  • Using Power Query: Power Query automates cleaning and transforming data. It’s an excellent tool for working with large datasets, enabling you to transform data with minimal manual work.
  • Using Flash Fill: Flash Fill is a time-saver for quickly filling data patterns. It automatically completes entries based on your pattern, making chart creation much smoother.

How to Analyze Parsed Data in Excel?

Parsing data is just the first step. The real challenge comes in making sense of it all. However, data analysis can feel like trying to find a needle in a haystack. With endless rows of numbers and information, it’s easy to get lost.

Excel is great for managing data, but it struggles with effective visualization. For example, knowing how to combine two charts in Excel can be a headache. That’s where ChartExpo steps in. It simplifies data visualization, turning your Excel data into clear, insightful charts.

Install ChartExpo and say goodbye to confusion and hello to powerful insights.

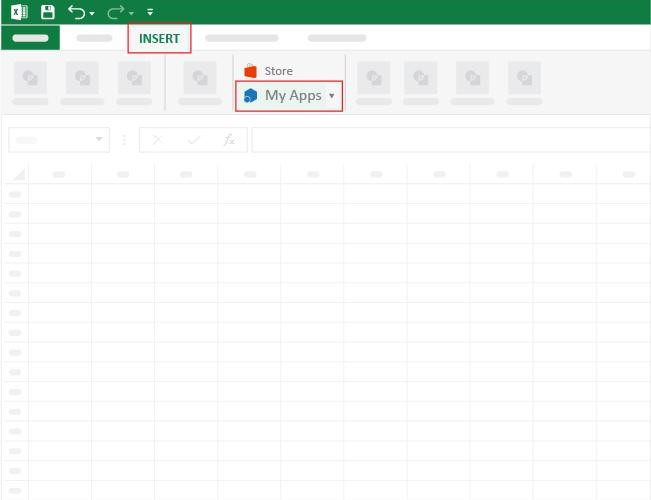
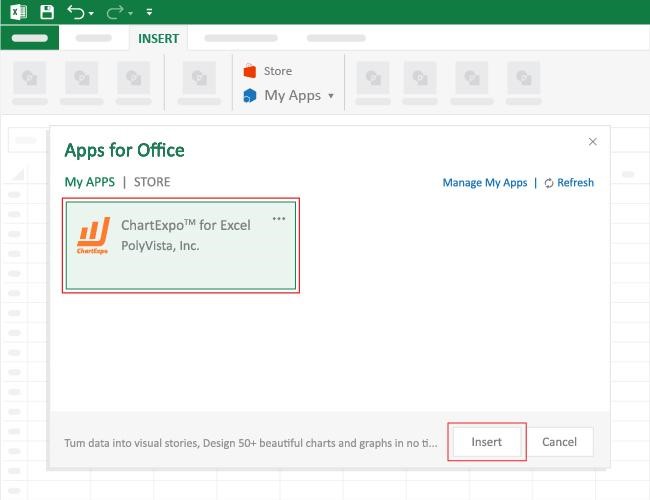
How to Install ChartExpo in Excel?

  1. Open your Excel application.
  2. Open the worksheet and click the “Insert” menu.
  3. You’ll see the “My Apps” option.
  4. In the Office Add-ins window, click “Store” and search for ChartExpo on the My Apps Store.
  5. Click the “Add” button to install ChartExpo in your Excel.

ChartExpo charts are available both in Google Sheets and Microsoft Excel. Please use the following CTAs to install the tool of your choice and create beautiful visualizations with a few clicks in your favorite tool.

Example

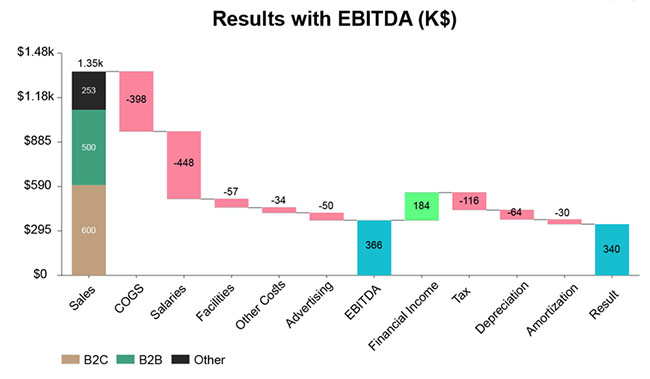
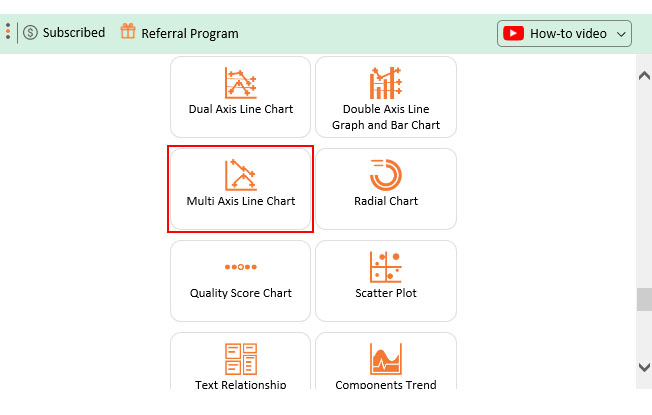
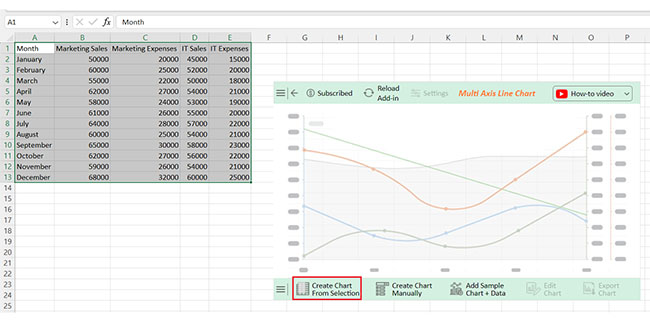
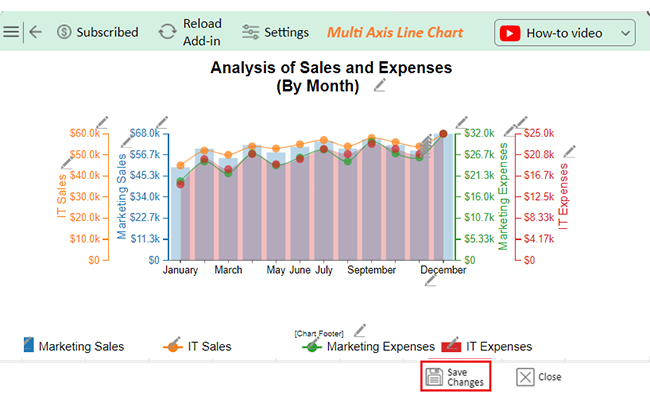
Let’s visualize the sample data below using ChartExpo and glean valuable insights from it:

Month Marketing Sales Marketing Expenses IT Sales IT Expenses
January 50000 20000 45000 15000
February 60000 25000 52000 20000
March 55000 22000 50000 18000
April 62000 27000 54000 21000
May 58000 24000 53000 19000
June 61000 26000 55000 20000
July 64000 28000 57000 22000
August 60000 25000 54000 21000
September 65000 30000 58000 23000
October 62000 27000 56000 22000
November 59000 26000 54000 21000
December 68000 32000 60000 25000
  • To get started with ChartExpo, install ChartExpo in Excel.
  • Now, click on My Apps from the INSERT menu.
How to parse data in Excel
  • Choose ChartExpo from My Apps, then click Insert.
How to parse data in Excel
  • Once it loads, scroll through the charts list to locate and choose the “Multi Axis Line Chart”.
How to parse data in Excel
  • Click the “Create Chart From Selection” button after selecting the data from the sheet, as shown.
How to parse data in Excel
  • ChartExpo will generate the visualization below for you.
How to parse data in Excel
  • Click on Settings and change the “Data Representation” as follows.
How to parse data in Excel
  • If you want to add anything to the chart, click the Edit Chart button:
How to parse data in Excel
  • Click the pencil icon next to the Chart Header to change the title.
  • It will open the properties dialog. Under the Text section, you can add a heading in Line 1 and enable Show.
  • Give the appropriate title of your chart and click the Apply button.
How to parse data in Excel
  • You can add the sign of ($) with all values as follows:
How to parse data in Excel
  • First, enable the Legend Show button as follows:
  • Change the Legend shape of “Marketing Sales” into a Column and click the “Apply” button.
How to parse data in Excel
  • Change the Legend shape of “IT Sales and Marketing Expenses” to Line and Circle, and click the “Apply” button.
How to parse data in Excel
  • Click the “Save Changes” button to persist the changes made to the chart.
How to parse data in Excel
  • Your final Multi Axis Line Chart will look like the one below.
How to parse data in Excel

Insights

  • The data shows seasonal trends with peaks in December for both sales and expenses across departments.
  • Marketing and sales consistently outperform IT, though IT shows stable growth.
  • Higher expenses align with increased sales, indicating resource-driven performance.
  • February and September also show notable activity, suggesting periodic business cycles or campaigns.

Pros & Cons of Parsing Data in Excel

Parsing data in Excel offers a range of benefits, but it also comes with some challenges. Understanding these pros and cons helps you decide when and how to apply these techniques for better results:

Pros

  • Easy to use: Excel’s built-in tools, like Text to Columns, make parsing straightforward. You don’t need advanced knowledge to start.
  • Flexible methods: Whether using Power Query or formulas, you can adapt parsing to your needs. It’s versatile for different tasks.
  • Time-saving: Tools like Flash Fill complete repetitive tasks quickly. This frees up time for more critical work.
  • Improves data accuracy: Proper parsing helps reduce errors. It organizes data, making analysis cleaner and more reliable.
  • Integrates with other tools: Data parsing integrates well with external tools, such as Analysis Toolpak in Excel, enhancing your parsing workflow.

Cons

  • Limited for large datasets: Excel struggles with massive datasets. Parsing becomes slower as data volume increases.
  • Formula complexity: Complex formulas can be complicated to manage. They may lead to errors if not handled properly.
  • Manual adjustments needed: Sometimes, data does not fit neatly into Excel’s parsing methods, so you may have to make adjustments manually.
  • No native regex support: Excel lacks built-in Regex support. Advanced text parsing requires VBA or external tools.

Tips for Efficient Data Parsing in Excel

Efficient data parsing in Excel can save you a lot of time and frustration. You can quickly clean and organize your data for analysis using the right tools and techniques.

Here are some tips to help you parse data more efficiently:

  • Use Text to Columns for simple splitting: Text to Columns is excellent for quick and easy data separation. It’s perfect when working with data merging in Excel.
  • Leverage Power Query for automation: If you’re dealing with repetitive tasks, Power Query is a game-changer. It automates the entire parsing process.
  • Utilize TEXTSPLIT (Excel 365): The TEXTSPLIT function in Excel 365 makes splitting data seamless. It’s ideal for organizing data for creating charts.
  • Combine functions for precision: Combining formulas like MID with SEARCH helps refine your parsed data. It gives you more control over the output.
  • Apply Flash Fill for pattern-based parsing: Flash Fill detects patterns and automatically fills in the gaps. It’s perfect for quick tasks that involve structured data.
  • Use Dynamic Arrays: This function makes parsing easier by automatically adjusting the size of your output. It’s perfect when parsing large amounts of data.
  • Avoid manual work: Automate tasks whenever possible to reduce manual intervention. This speeds up data processing.
  • Test on a sample first: Always test your parsing methods on a small dataset. This helps avoid errors when working with more extensive data.

Best Practices of Parsing PDF Into Excel

Parsing PDF data into Excel can be a game-changer for streamlining your workflow. PDFs often contain valuable information that’s tough to work with directly. However, with the right methods, you can efficiently transfer data into Excel for analysis:

  • Use Power Query for structured PDFs: Let’s say you receive structured PDFs that contain tables. Power Query can help you extract the data efficiently and load it into Excel for your analysis or use. It’s especially useful in cases where you want to combine PDF data with data from elsewhere.
  • Copy-paste in Adobe Acrobat: If the file is a text-based PDF, Adobe Acrobat simplifies copying and pasting in Excel. It’s a brute-force approach for basic tasks.
  • Use converters: Online converters can be helpful for quickly converting PDFs to Excel. They eliminate the need to spend time on larger datasets.
  • Use VBA for automation: VBA allows you to automate the process of parsing PDFs into Excel, especially for repetitive tasks. This works well when you need to parse transformed data from multiple sources.
  • Check formatting after import: Always check the formatting after importing PDF data. This ensures the data is clean and ready for analysis.
  • Use OCR for scanned PDFs: If the PDF is scanned, use OCR (Optical Character Recognition) to extract the text. This works well for converting images to editable data.
  • Verify data accuracy: Always double-check the imported data for accuracy. Errors can creep in when parsing complex documents.

FAQs

How do I parse data in an Excel cell?

To parse data in an Excel cell, use functions like LEFT, RIGHT, and MID to extract specific text. You can also use Text to Columns for quick separation based on delimiters. Power Query offers advanced parsing options.

How do I parse data from text to Excel?

To parse data from text to Excel, use Text to Columns to split data based on delimiters. You can also apply Power Query for more complex parsing tasks. Flash Fill can help automate the process of making quick patterns.

Wrap Up

Parsing data in Excel makes analysis easier. It helps clean, organize, and extract useful information. Without proper parsing, data can be messy and complicated to work with.

Excel offers several tools for parsing. Text to Columns, Power Query, and formulas like LEFT, MID, and RIGHT simplify the process. These methods allow you to structure raw data for better insights.

Once parsed, the data becomes more valuable. It can be merged, transformed, and analyzed with Excel functions for Data Analysis. Parsed data also improves Chart Elements in Excel, making visualizations clearer.

However, Excel has limitations in data visualization. Combining different datasets and charts can be challenging. Learning how to combine two charts in Excel can help, but it requires manual effort.

To overcome Excel’s charting limits, tools like ChartExpo simplify the process. They provide advanced visualization options for better data interpretation. Clear visuals make trends easier to spot and decisions more accurate.

Effective data parsing and visualization lead to better insights. So, do not hesitate. Master the parsing techniques and start using ChartExpo to make your Excel experience smoother and more powerful.

How much did you enjoy this article?

ExcelAd1
Start Free Trial!
151434

Related articles

next previous
Microsoft Excel9 min read

Advanced Excel Charts: Create Impactful Data Visuals

Excel has a wide range of advanced charts and graphs to present your data comprehensively. Learn about top advanced Excel charts and how to create them.

Microsoft Excel13 min read

How to Make Cool Excel Charts & Graphs?

Explore cool Excel charts and graphs that turn your data into engaging visuals. Perfect for making your reports clear, creative, and impactful.

Microsoft Excel9 min read

Workout Tracking Spreadsheet for Smarter Workout Insights

A workout tracking spreadsheet helps record and track your fitness progress. This blog demonstrates how to utilize it, providing tips, templates, and benefits.

Microsoft Excel12 min read

Weighted Average on Excel Simplified for Accurate Analysis

Improve your analysis with the weighted average on Excel. This guide explains how to apply it for more accurate insights in grading, finance, and performance.

Microsoft Excel9 min read

Interpolate in Excel: A Complete Walkthrough

Interpolate in Excel to estimate missing values accurately. This blog shows you how to apply linear interpolation, analyze data, and visualize trends with a chart.

ChartExpo logo

Turn Data into Visual
Stories

CHARTEXPO

  • Home
  • Gallery
  • Videos
  • Services
  • Pricing
  • Contact us
  • FAQs
  • Privacy policy
  • Terms of Service
  • Sitemap

TOOLS

  • ChartExpo for Google Sheets
  • ChartExpo for Microsoft Excel
  • Power BI Custom Visuals by ChartExpo
  • Word Cloud

CATEGORIES

  • Bar Charts
  • Circle Graphs
  • Column Charts
  • Combo Charts
  • Comparison Charts
  • Line Graphs
  • PPC Charts
  • Sentiment Analysis Charts
  • Survey Charts

TOP CHARTS

  • Sankey Diagram
  • Likert Scale Chart
  • Comparison Bar Chart
  • Pareto Chart
  • Funnel Chart
  • Gauge Chart
  • Radar Chart
  • Radial Bar Chart
  • Sunburst Chart
  • see more
  • Scatter Plot Chart
  • CSAT Survey Bar Chart
  • CSAT Survey Chart
  • Dot Plot Chart
  • Double Bar Graph
  • Matrix Chart
  • Multi Axis Line Chart
  • Overlapping Bar Chart
  • Control Chart
  • Slope Chart
  • Clustered Bar Chart
  • Clustered Column Chart
  • Box and Whisker Plot
  • Tornado Chart
  • Waterfall Chart
  • Word Cloud
  • see less

RESOURCES

  • Blog
  • Resources
  • YouTube
SIGN UP FOR UPDATES

We wouldn't dream of spamming you or selling your info.

© 2025 ChartExpo, all rights reserved.