Categories
Energy costs can spiral out of control when you’re flying blind. Organizations that track consumption patterns gain leverage over their utility bills and operational expenses.
Measuring energy use reveals where power gets wasted, which systems hog resources, and how adjustments translate into savings. The practice isn’t about obsessing over monthly statements.
It’s about building visibility into how facilities actually consume power throughout operations. Better measurement equals better decisions, tighter budgets, and clearer paths toward efficiency targets that matter.
Definition: Tracking energy consumption means logging the power drawn by equipment, systems, or entire facilities across specific time windows.
This applies everywhere from homes to factories, each environment showing distinct usage fingerprints. The focus sits on patterns over time rather than random snapshots.
Monitors capture data from individual devices, networked infrastructures, and ongoing processes that pull electricity, gas, or other energy forms.
Organizations that understand how to measure energy use can tie consumption records to efficiency benchmarks, system performance reviews, and resource planning decisions that stick.
Tracking consumption matters for any operation chasing cost control, efficiency gains, or sustainability compliance.
Regular measurement shifts organizations from reactive fire-fighting to strategic energy planning.
Grasping measurement fundamentals makes interpreting readings straightforward and enables meaningful comparisons across devices.
Multiple approaches exist for tracking consumption, each offering different precision levels and implementation complexity.
Combining techniques strengthens reliability when measuring energy consumption across varied systems.
Precise math matters when quantifying power draw for appliances or whole facilities. The process scales from single devices to complex operations.
Following these steps maintains consistency across all devices for which you measure energy consumption.
Real scenarios clarify measuring energy usage concepts. Take a standard household air conditioner running daily.
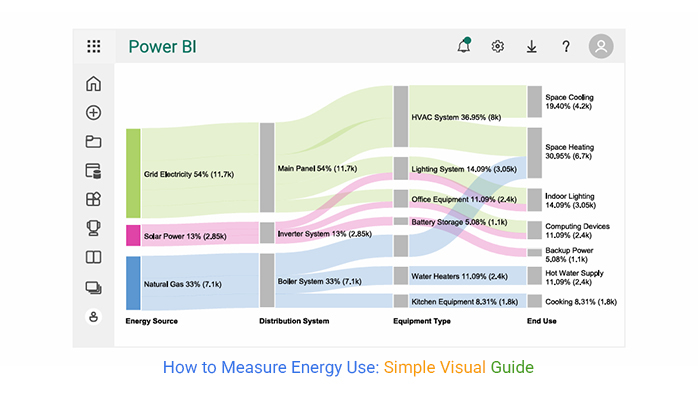
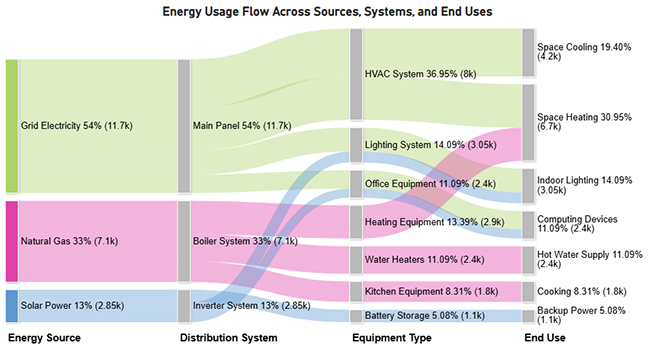
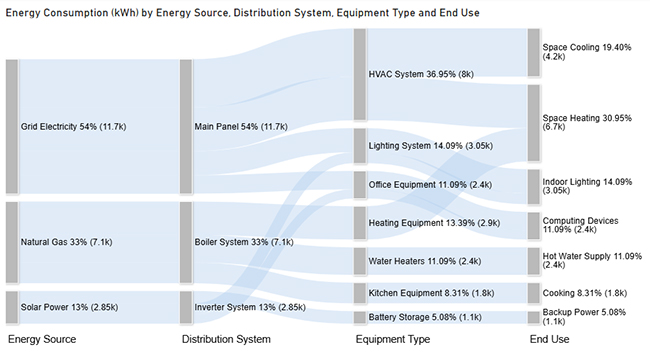
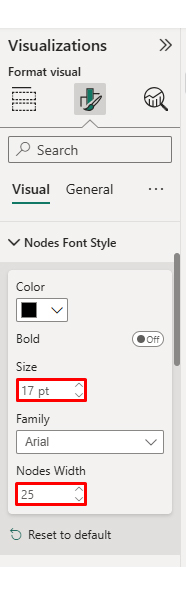
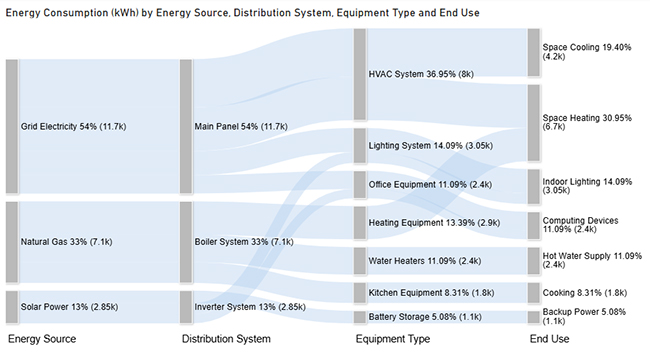
This demonstrates measuring energy consumption using basic inputs. The Sankey chart below traces how energy flows from sources through systems to end applications, spotlighting major consumption zones.
Power BI unlocks structured analysis for teams learning how to measure energy use at enterprise scale.
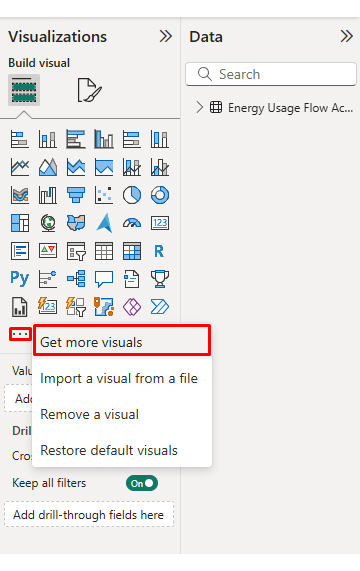
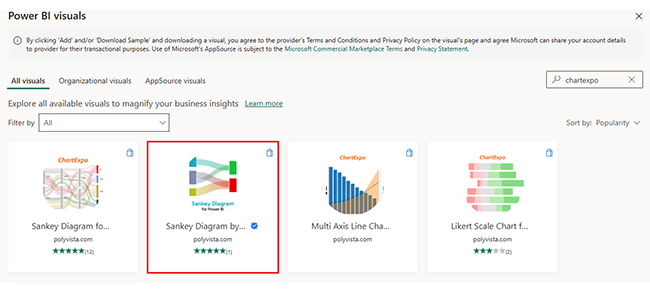
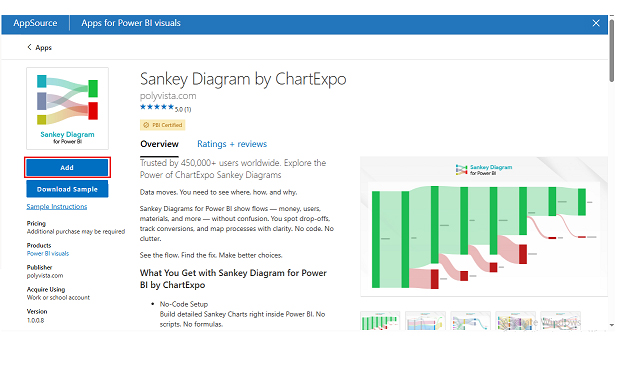
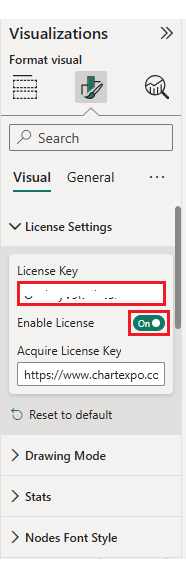
ChartExpo elevates this process by turning intricate energy pathways into interactive Sankey charts. Rather than static reports, analysts present energy flows through dynamic visualizations. Stakeholders catch inefficiencies, losses, and optimization windows faster.
Why use ChartExpo?
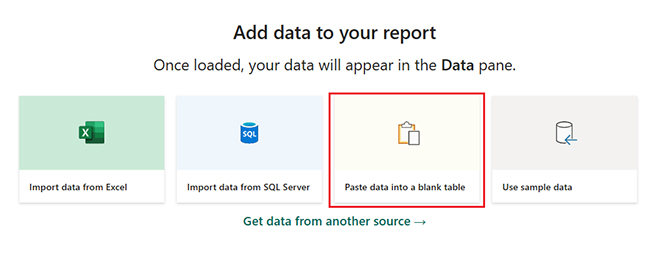
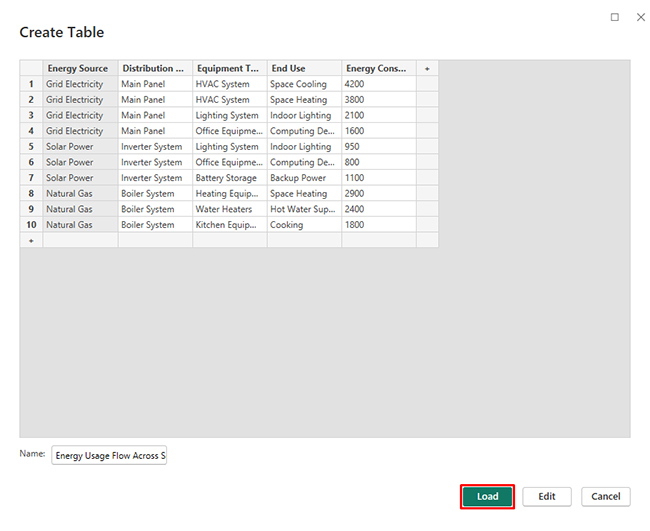
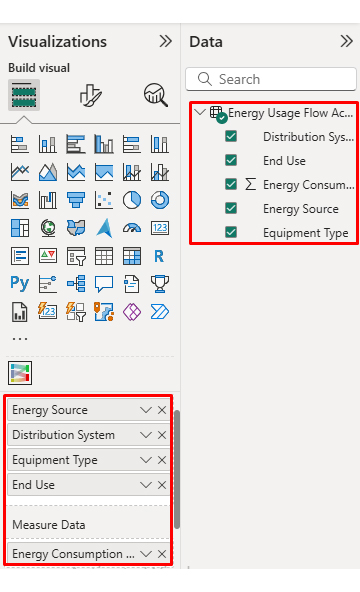
Consider we have the following data for a Sankey Chart.
|
Energy Source |
Distribution System | Equipment Type | End Use |
Energy Consumption (kWh) |
| Grid Electricity | Main Panel | HVAC System | Space Cooling | 4200 |
| Grid Electricity | Main Panel | HVAC System | Space Heating | 3800 |
| Grid Electricity | Main Panel | Lighting System | Indoor Lighting | 2100 |
| Grid Electricity | Main Panel | Office Equipment | Computing Devices | 1600 |
| Solar Power | Inverter System | Lighting System | Indoor Lighting | 950 |
| Solar Power | Inverter System | Office Equipment | Computing Devices | 800 |
| Solar Power | Inverter System | Battery Storage | Backup Power | 1100 |
| Natural Gas | Boiler System | Heating Equipment | Space Heating | 2900 |
| Natural Gas | Boiler System | Water Heaters | Hot Water Supply | 2400 |
| Natural Gas | Boiler System | Kitchen Equipment | Cooking | 1800 |
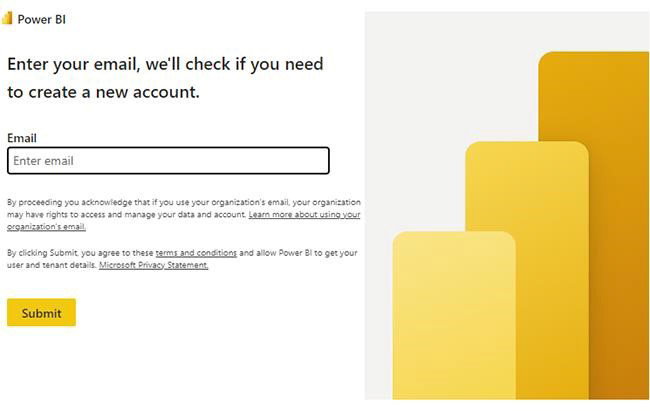
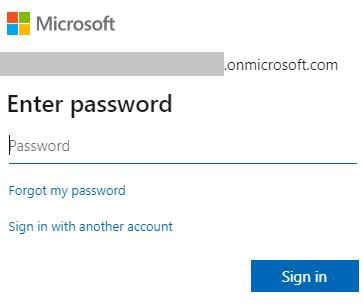
Power BI Login:
Measuring energy usage pays off across financial, operational, and environmental dimensions.
Economic Benefits
Operational Benefits
Environmental & Sustainability Benefits
Visual tools like an energy flow diagram help organizations grasp how power moves across infrastructure. Structured tracking through a Power BI KPIs dashboard supports performance monitoring.
Despite advantages, measuring energy usage brings obstacles.
Multiply kilowatts by hours of operation.
Options include smart meters, plug-in devices, bills, and management platforms.
Absolutely. Insights from measuring energy usage expose inefficiencies that cut costs.
Constant tracking works best, but monthly checks suffice for most situations.
Getting a handle on how to measure energy use turns guesswork into control. When you consistently measure energy consumption, you can spot high-demand systems, validate savings from upgrades, and keep budgets aligned with real operating patterns. It also creates a baseline for audits, benchmarking, and compliance.
Pair meter and sub-meter data with Power BI measures, KPIs, and an energy dashboard to translate readings into decisions. A Sankey view can expose where energy flows and where losses concentrate, so teams prioritize fixes that deliver the fastest impact—lower costs, steadier performance, and clearer sustainability reporting. Trend lines also help forecast demand and prevent surprises on utility bills.
How much did you enjoy this article?


Calculate accounts receivable turnover ratio to measure credit collection speed, improve cash flow, and strengthen your financial strategy. Read on!

Change Management KPIs are the key to tracking adoption, performance, and ROI during transitions. Find out which metrics matter. Read on!

Data collection methods and techniques determine the quality of every insight you act on. Explore key approaches for gathering reliable data. Read on!


