Categories
Energy demands show the total amount of energy required by industries, individuals, and nations to power transportation, homes, infrastructure, and technology. All these help in driving economic growth and daily human activities.
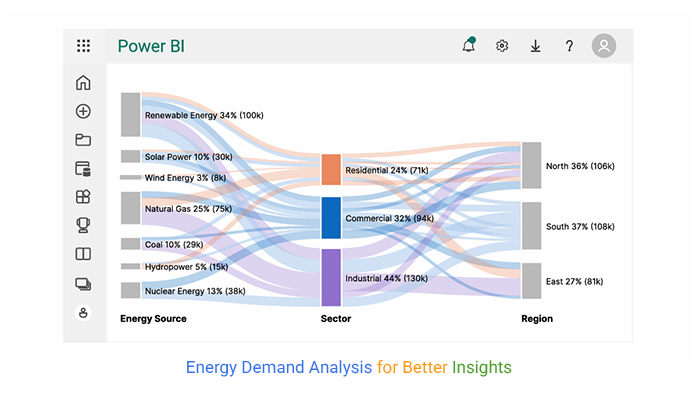


This guide shows you how to trace energy demands using a renewable energy chart, an energy flow diagram, and a Sankey Diagram in Power BI.
Whether you’re a newbie or a veteran analyst, this guide will show you how to use Sankey Diagram and other visualization tools to perform digital analytics.
You’ll also discover the different ways to present electric energy demand and how to use Power BI for energy demand analysis.
Definition: Energy demand is the total amount of energy needed to power multiple activities, including commercial, residential, transportation, and industrial needs.
It shows how much energy is needed over a specific period to support economic development and daily life.
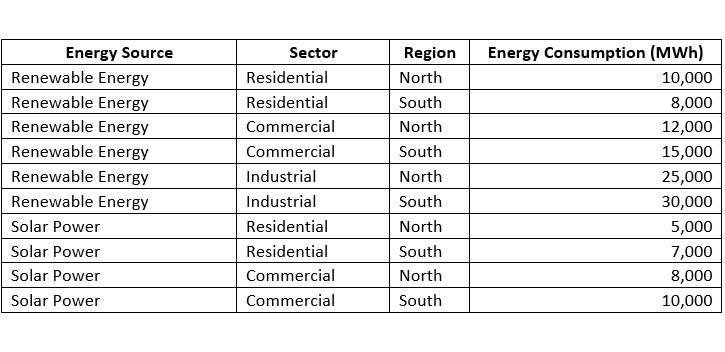
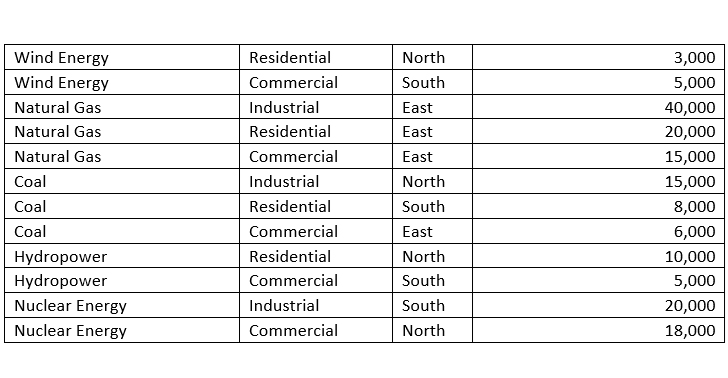
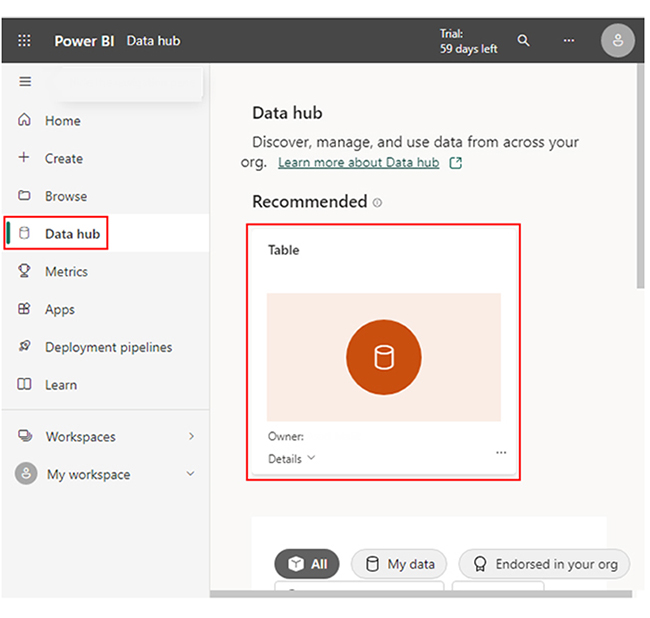
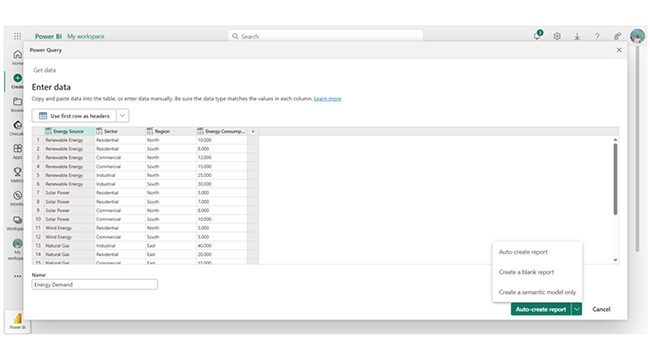
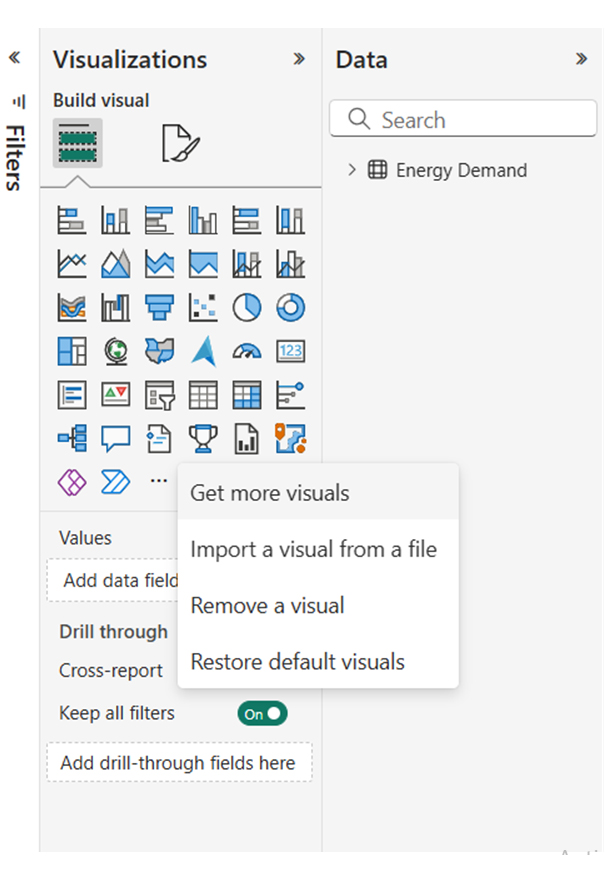
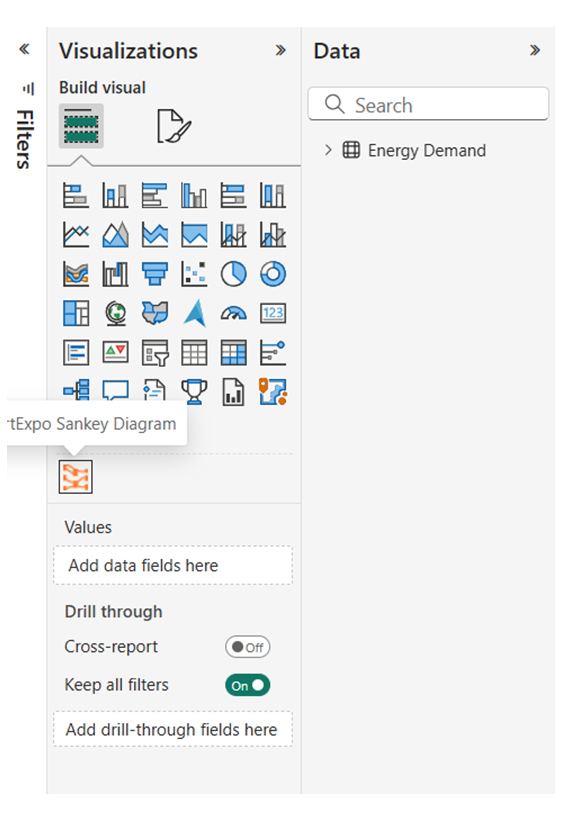
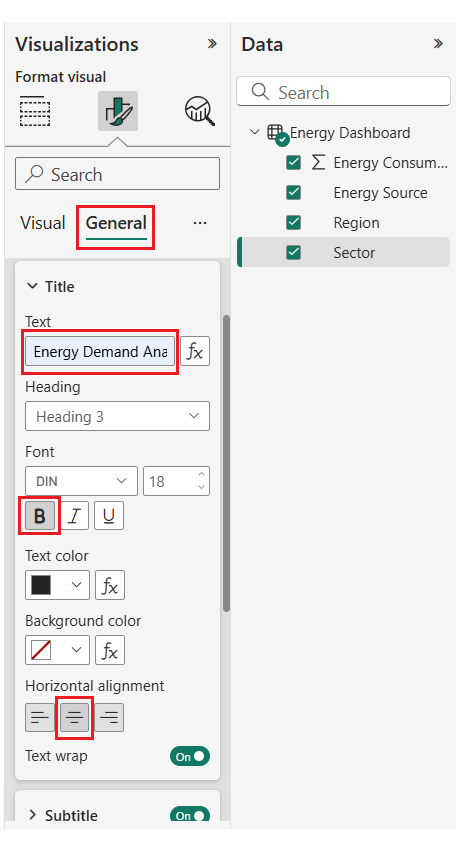
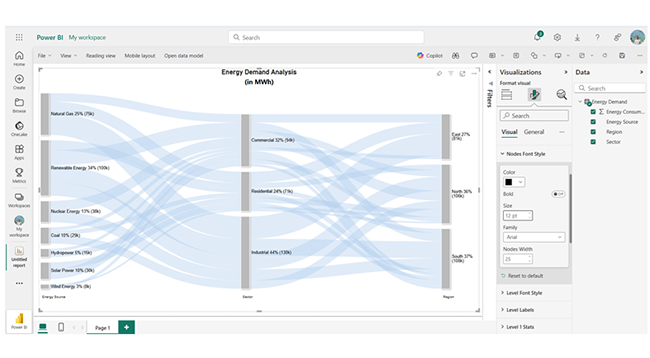
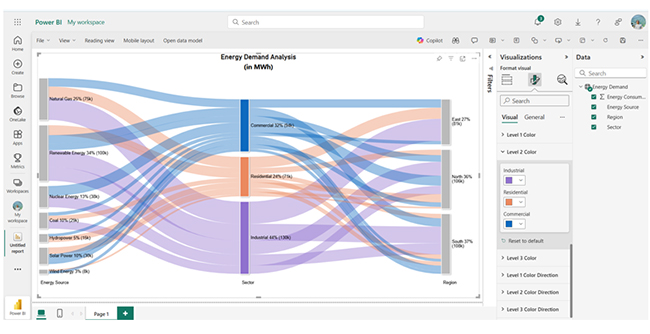
Here are the stages to follow when creating a Sankey Diagram custom visual by ChartExpo.


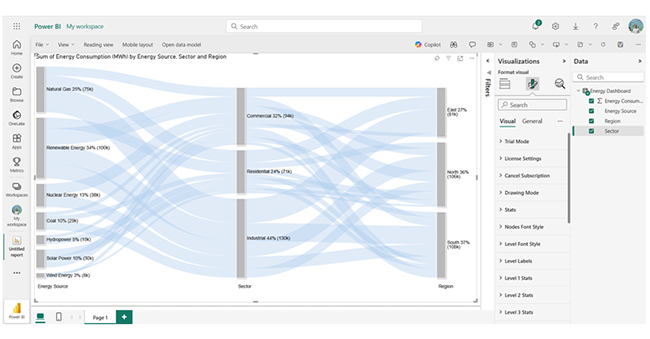

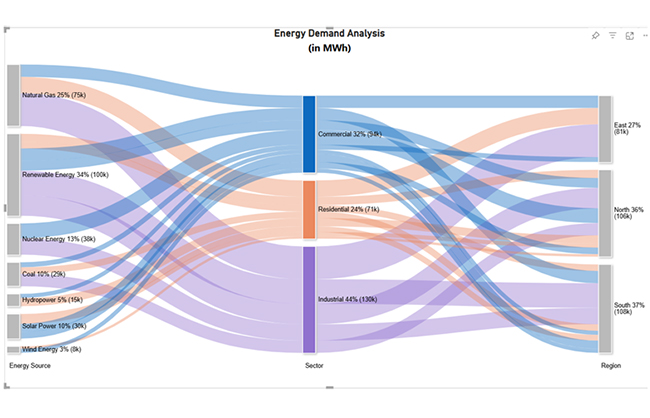
The data shows higher industrial energy consumption from renewable sources and natural gas. Renewable energy dominates in all sectors. Hydropower and nuclear contribute significantly, while the cost is mainly used in the North.
Explore more about the energy flow graph.
Here are the Pros and Cons of calculating world energy demand.
Yes, global energy demand is increasing. And it’s due to industrialization, population growth, and digitalization. The rise is driven by developing nations, but renewable energy and efficiency improvements play a major role in moderating the growth.
Energy demand is influenced by economic development, population growth, technological advancement, urbanization, energy prices, climate, lifestyle changes, and government policies. Industrial activity also influences energy demand. All these factors vary by development stage and region.
The three important determinants of energy demand are economic activity (GDP growth), economic activity, and energy prices. These factors influence how much energy is consumed across industrial, residential, and transport sectors.
Energy demand is the total energy required to power industries, homes, and transportation. Calculating global energy helps guide policy, plan resources, and address environmental concerns.
To get the most out of energy demand and supply, you’ll have to encourage demand response programs, monitor, and adapt. You have to incorporate demand response programs to manage peak load times. These programs incentivize consumers to shift or reduce energy use during high-demand periods, which helps prevent grid overloads and reduce energy costs.
Furthermore, you have to regularly assess energy supply and demand trends to make necessary adjustments. You should consider using real-time data and predictive analytics to optimize energy distribution and spot imbalances.
Now you know what energy demand is, what tool will you use to visualize the energy demand of your organization?
How much did you enjoy this article?


Calculate accounts receivable turnover ratio to measure credit collection speed, improve cash flow, and strengthen your financial strategy. Read on!

Change Management KPIs are the key to tracking adoption, performance, and ROI during transitions. Find out which metrics matter. Read on!

Data collection methods and techniques determine the quality of every insight you act on. Explore key approaches for gathering reliable data. Read on!


