• Home
  • Tools dropdown img
    • Spreadsheet Charts

      • ChartExpo for Google Sheets
      • ChartExpo for Microsoft Excel
    • Power BI Charts

      • Power BI Custom Visuals by ChartExpo
    • Word Cloud

  • Charts dropdown img
    • Chart Category

      • Bar Charts
      • Circle Graphs
      • Column Charts
      • Combo Charts
      • Comparison Charts
      • Line Graphs
      • PPC Charts
      • Sentiment Analysis Charts
      • Survey Charts
    • Chart Type

      • Box and Whisker Plot
      • Clustered Bar Chart
      • Clustered Column Chart
      • Comparison Bar Chart
      • Control Chart
      • CSAT Survey Bar Chart
      • CSAT Survey Chart
      • Dot Plot Chart
      • Double Bar Graph
      • Funnel Chart
      • Gauge Chart
      • Likert Scale Chart
      • Matrix Chart
      • Multi Axis Line Chart
      • Overlapping Bar Chart
      • Pareto Chart
      • Radar Chart
      • Radial Bar Chart
      • Sankey Diagram
      • Scatter Plot Chart
      • Slope Chart
      • Sunburst Chart
      • Tornado Chart
      • Waterfall Chart
      • Word Cloud
    • Google Sheets
      Microsoft Excel
  • Services
  • Pricing
  • Contact us
  • Blog
  • Support dropdown img
      • Gallery
      • Videos
      • Contact us
      • FAQs
      • Resources
    • Please feel free to contact us

      atsupport@chartexpo.com

Categories
All Data Visualizations Data Analytics Surveys
Add-ons/
  • Google Sheets
  • Microsoft Excel
  • Power BI
All Data Visualizations Data Analytics Surveys
Add-ons
  • Google Sheets
  • Microsoft Excel
  • Power BI

We use cookies

This website uses cookies to provide better user experience and user's session management.
By continuing visiting this website you consent the use of these cookies.

Ok

ChartExpo Survey


Home > Blog > Power BI

Carbon Footprint Calculations Made Simple with Visual

Carbon footprint calculations show the total greenhouse gas emissions from activities. It helps assess and reduce the environmental impact of these greenhouse gas emissions.

Carbon footprint calculations

In this guide, you’ll discover what a carbon footprint is, what is meant by the term carbon footprint, and why carbon footprint calculations are important for business.

You’ll also discover things to consider when calculating your carbon footprint, carbon footprint calculation methods, and how to calculate your carbon footprint with examples.

This guide will introduce you to data visualization tools like the Sankey diagram in Power BI, and how to perform data analysis with the tool.

Table of Contents:

  1. What is a Carbon Footprint?
  2. What is Meant by the Term Carbon Footprint?
  3. Why are Carbon Footprint Calculations Important for Businesses?
  4. What types of Things to Consider When Calculating Your Carbon Footprint?
  5. What are the Carbon Footprint Calculation Methods?
  6. How to Calculate Your Carbon Footprint with Example?
  7. How to do Carbon Footprint Analysis in Power BI?
  8. How to Use Your Carbon Footprints?
  9. What are the Ways to Reduce Your Carbon Footprint?
  10. Benefits of Decreasing Carbon Emissions
  11. FAQs
  12. Wrap Up

What is a Carbon Footprint?

Definition: A carbon footprint is the total amount of greenhouse gases (like carbon dioxide) emitted by human activities. It measures the environmental impact of individuals, products, or organizations. Carbon footprint is expressed in terms of equivalent carbon dioxide (CO2e).

What is Meant by the Term Carbon Footprint?

Carbon footprint refers to the total amount of greenhouse gases (GHGs) emitted into the atmosphere due to human activities. It’s measured in terms of carbon dioxide equivalents (CO2e) to account for various GHGs (like nitrous oxide and methane) that contribute to global warming.

Why are Carbon Footprint Calculations Important for Businesses?

  1. Enhance sustainability: Reduction of carbon footprint aligns with the corporate social responsibility (CSR) initiatives, and that appeals to environmentally conscious consumers.
  2. Cost-savings: Reducing waste and optimizing energy use tend to lead to cost reductions.
  3. Comply with regulations: Many regions are introducing carbon-related legislation, and that requires businesses to track and reduce emissions.
  4. Reputation and branding: Businesses perceived to be environmentally responsible attract customers and investors who prioritize sustainability.

What types of Things to Consider When Calculating Your Carbon Footprint?

  1. Energy Consumption: It accounts for the energy used in buildings, offices, or factories. These include electricity, cooling, and heating. It could be direct and indirect energy sources.
  2. Transportation: It includes all modes of transport like company vehicles, employee commutes, air travel, and shipping logistics. You should also factor in fuel consumption and emissions.
  3. Waste Generation: Consider the amount of waste produced and how it is disposed of. After all, waste management processes can release greenhouse gases.
  4. Raw Materials and Supply Chain: It includes emissions from the sourcing, production, and transportation of products and materials.

What are the Carbon Footprint Calculation Methods?

  1. Greenhouse Gas (GHS) Protocol: Emissions are categorized into three scopes — Scope 1 (direct emissions), Scope 2 (indirect emissions from purchased electricity), and Scope 3 (indirect emissions from the supply chain and other activities). It offers a structured approach for businesses.
  2. Life Cycle Assessment (LCA): It’s a comprehensive method that evaluates the environmental impact of a product (or service) from cradle to grave.
  3. Energy-Based Method: With this method, emissions are calculated based on energy consumption, and conversion factors are used to estimate CO2 equivalents.
  4. Carbon Footprint Calculators: It’s the systematic tracking of emissions across operations using data on transportation, waste, and energy.

How to Calculate Your Carbon Footprint with Example?

Here are the steps to calculate your carbon footprint:

  • Energy Consumption: Estimate the amount of energy you use. For instance, if you use 500 kWh of electricity per month, use an emission factor (usually 0.233 kg CO2 per kWh) to calculate:

500 kWh x 0.233 kg CO2/kWh = 116.5 kg CO2.

  • Transportation: Calculate emissions from your car travel. For instance, if you drive 1,000 miles per month in a vehicle emitting 0.411 kg CO2 per mile, the emissions would be:

1,000 miles x 0.411 kg CO2/mile = 411 kg CO2.

  • Waste Generation: Estimate emissions from waste disposal. For instance, if you dispose of 100 kg of waste per month, and the waste disposal generates 0.5 kg CO2 per kg of waste, you’ll have:

100 kg x 0.5 kg CO2 = 50 kg CO2.

  • Total Carbon Footprint: Add up all emissions:

116.5 + 411 + 50 = 577.5 KG CO2 per month.

How to do Carbon Footprint Analysis in Power BI?

This section focuses on the Power BI service, and how to use Power BI. You’ll discover how to perform a thorough data presentation using the Power BI datasets. Furthermore, there are some Power BI design ideas, and Power BI report examples for you to explore in this section.

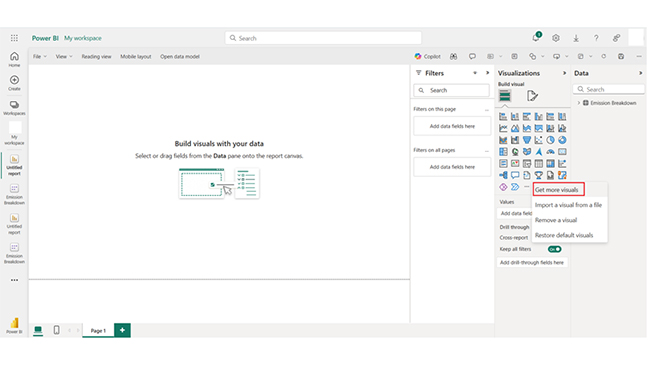
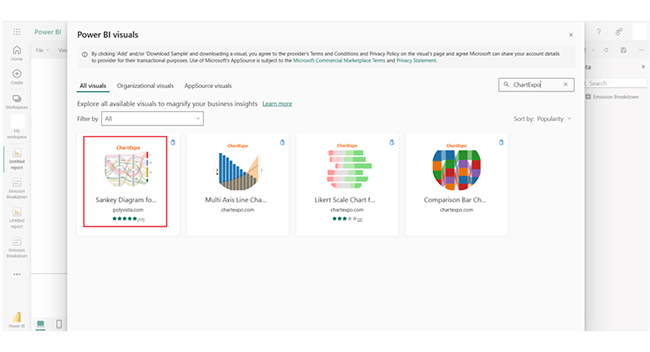
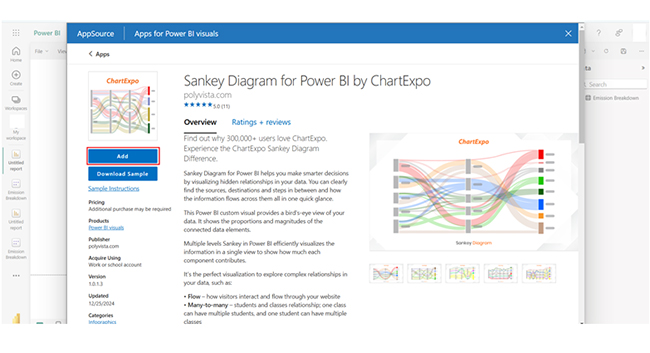
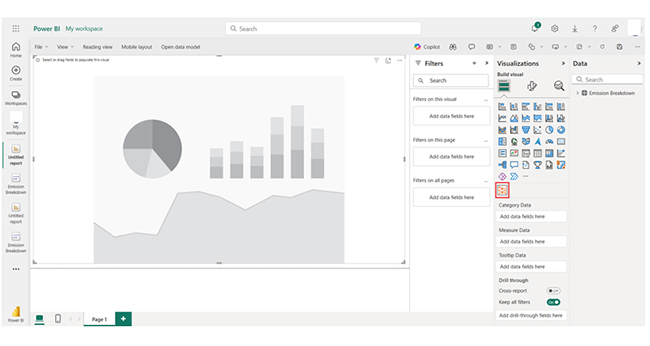
Here are the steps to help you perform thorough data visualizations in Power BI.

  • Stage 1: Log into Power BI, enter your email, and click the “Submit” button.
Carbon footprint calculations
  • You’ll be redirected to a Microsoft account. Enter your password, and click “Sign in.”
Carbon footprint calculations
  • You can opt to stay signed in.
Carbon footprint calculations
  • Stage 2: Create a Data Set and Select the Data Set to Use in the Sankey Chart.
  • Navigate to the left-side menu, and click on the “Create” option. After that, select “Paste or manually enter data.”
Carbon footprint calculations
  • Use the following Emission breakdown data for this illustration.
Carbon footprint calculations
  • Paste the data table above into the “Power Query” window. After that, select the “Create a dataset only” option.
Carbon footprint calculations
  • Navigate to the left-side menu, and click on the “Data Hub” option. Power BI populates the data set list. If no data set has been created, you’ll get an error message.
Carbon footprint calculations
  • Click on the “Create report” dropdown.
Carbon footprint calculations
  • To add the Power BI Sankey Diagram Extension by ChartExpo, you’ll have to use an add-in (or Power BI visual) from AppSource. First, navigate to the right side of the Power BI dashboard, and open the Power BI Visualizations panel. Click the ellipsis symbol (…) to import the Power BI Sankey Diagram extension by ChartExpo.
  • In the menu that opens, select the “Get more visuals” option.
Carbon footprint calculations
  • In the following window that opens, enter “ChartExpo” in the highlighted search box. You’ll see the “Sankey Diagram for Power BI by ChartExpo.”
Carbon footprint calculations
  • After that, click on the Sankey Diagram and also click the highlighted “Add” button.
Carbon footprint calculations
  • Power BI will add the “Sankey Diagram for Power BI by ChartExpo” icon in the visualization panel.
Carbon footprint calculations
  • To draw a Sankey Diagram with ChartExpo’s Power BI extension, select the “Sankey Diagram for Power BI by ChartExpo” icon in the visualization panel. A window similar to the one below opens in the report section of your dashboard. You’ll have to select the fields to use in the Sankey chart.
Carbon footprint calculations
  • You’ll have to provide your email address or a ChartExpo license key. Add the key under the Visual section. After that, you’ll see the Sankey Chart.
Carbon footprint calculations
  • You can add the top header text in the chart under the General section.
Carbon footprint calculations
  • You can add the header text at the top of the chart.
Carbon footprint calculations
  • You can disable the Numbers.
Carbon footprint calculations
  • You can add the colors of all Nodes.
Carbon footprint calculations
  • You can set the color direction as follows:
Carbon footprint calculations
  • Here’s the final look at the Emission breakdown analysis dashboard in Power BI using ChartExpo.
Carbon footprint calculations

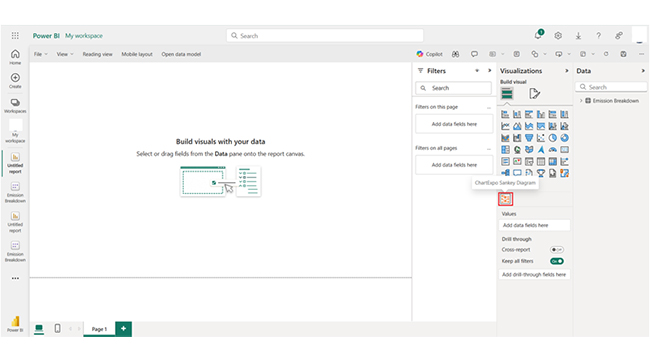
Note: As a Power BI user, you should consider exploring some Power BI advanced features like the filters in Power BI. But the features you’ll be using should be dependent on the Power BI data model you’re working on.

Insights:

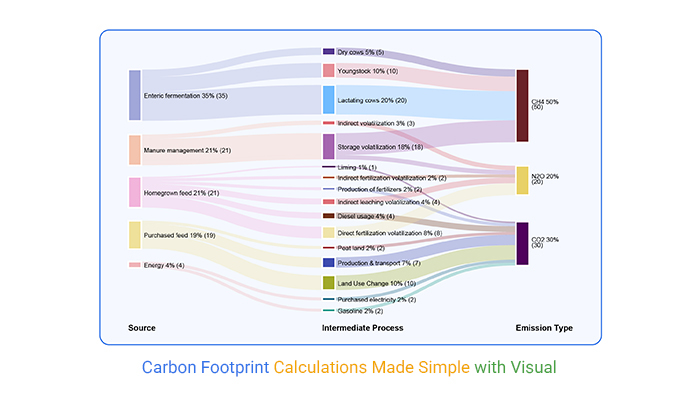
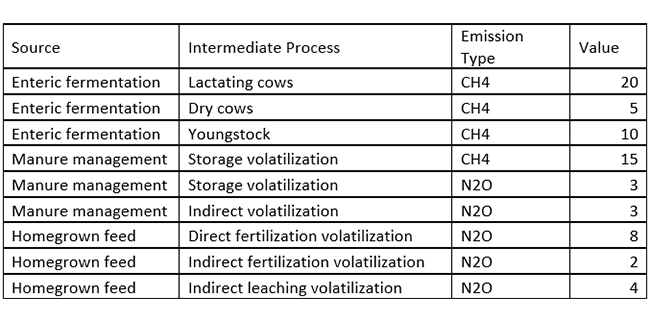
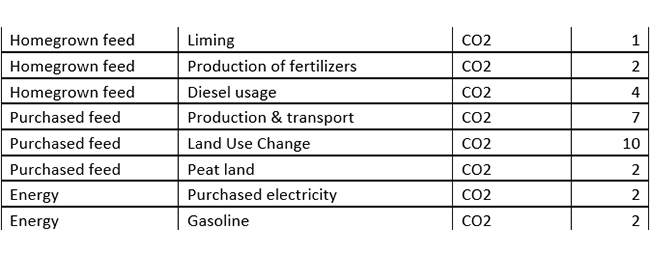
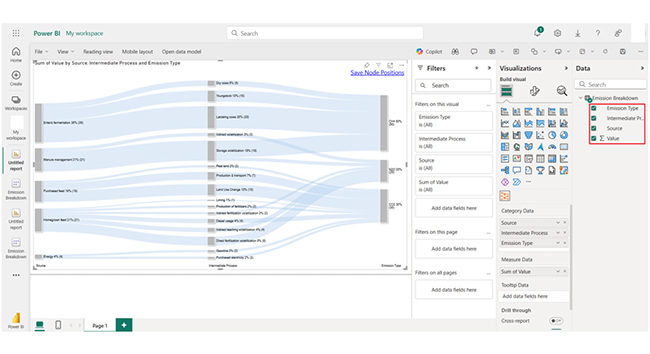
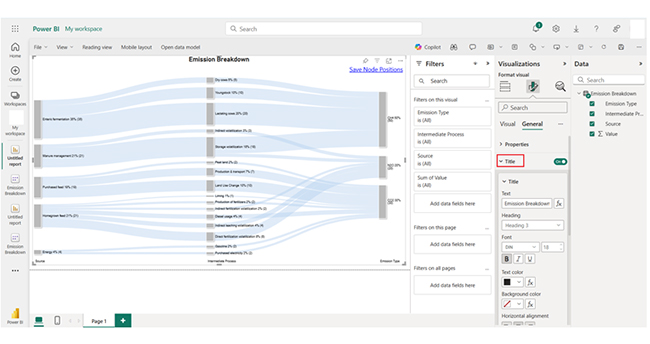
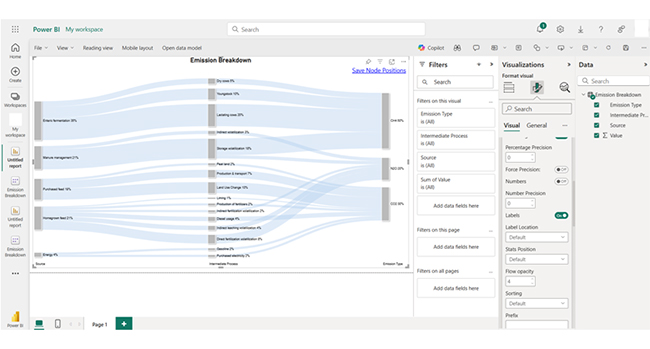
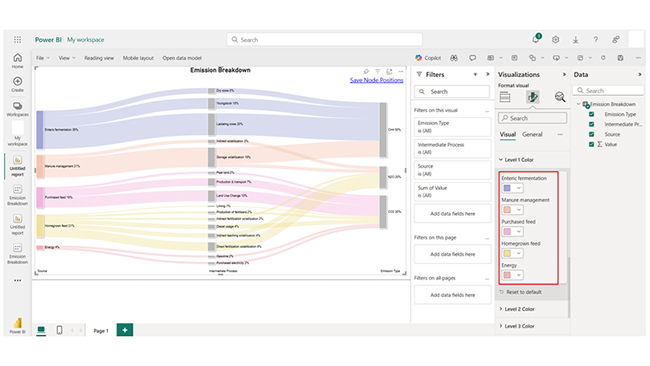
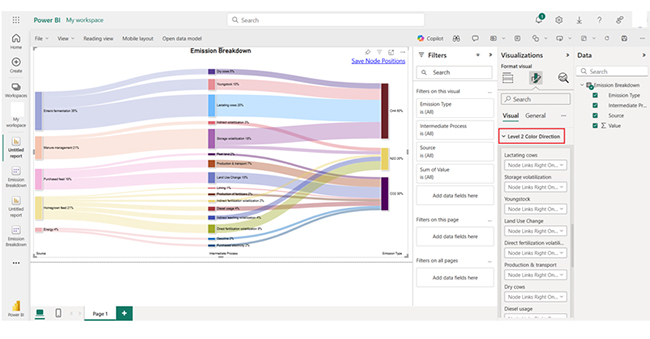
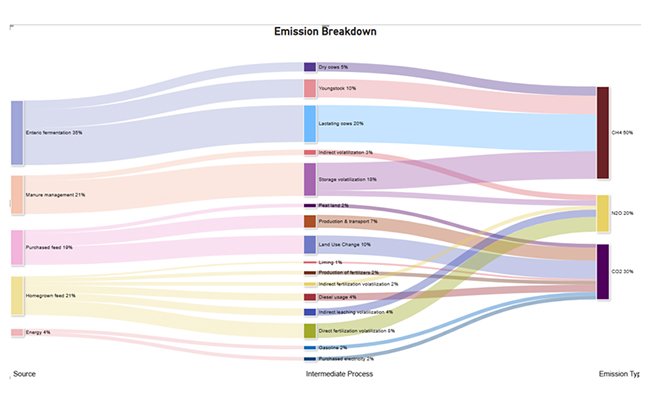
The data shows emissions from energy and agricultural activities. CH4 dominates from enteric fermentation and manure. N2O on the other hand, arises from fertilizer use. CO2 plays a vital role in feed production, energy, and transport. Managing these emissions helps in reducing environmental impact.

How to Use Your Carbon Footprints?

  1. Identify Emission Hotspots: Review the carbon footprint data to identify activities that contribute the most to emissions.
  2. Set Reduction Goals: Use the data from your analysis to set realistic targets for reducing the carbon footprint.
  3. Implement Efficient Measures: Take action to reduce emissions. These could be switching to renewable energy sources, opting for electric vehicles, or improving energy efficiency.
  4. Track Progress: Always monitor your carbon footprint to see how the reduction efforts are impacting emissions. Tools like Power BI or Carbon calculators can help you measure ongoing progress.
  5. Offset Emissions: Invest in carbon offset programs (like supporting renewable energy projects or planting trees).

What are the Ways to Reduce Your Carbon Footprint?

  • Use Renewable Energy: Switch to wind, solar, or other renewable energy sources.
  • Reduce Car Travel: Walk, bike, carpool, or use public transport to minimize emissions from personal vehicles.
  • Offset Emissions: Invest in carbon offset programs to neutralize emissions.
  • Adopt Electric Vehicles: You should consider switching to electric (or hybrid) cars).

Benefits of Decreasing Carbon Emissions

  1. Mitigates Climate Change: It reduces the impact of global warming, and helps in preventing extreme weather events. It also prevents rising sea levels and biodiversity loss.
  2. Improves Air Quality: It decreases pollutants like particulate matter and nitrogen oxide. This will, in turn, lead to cleaner air and better health outcomes.
  3. Saves Energy and Costs: Energy efficiency measures help in reducing operational costs for households and businesses.
  4. Boosts Health: It reduces cardiovascular and respiratory diseases linked to pollution.

FAQs

What is the most accurate carbon footprint calculator?

The most accurate carbon footprint calculators are usually those based on detailed data like Carbon Trust and EPA’s Carbon Footprint Calculator.

How do you calculate carbon footprint per person?

To calculate carbon footprint per person, track individual activities like transportation, food consumption, energy use, and waste generation. You also need to apply relevant emission factors to estimate CO2 emissions per person over a period.

Wrap Up

Carbon footprint measures the total greenhouse gas emissions from human activities. It helps businesses track emissions so as to comply with regulations, enhance sustainability, reduce costs, and improve reputation with consumers.

But why should you focus on decreasing carbon emissions? It mitigates climate change and improves air quality. Reducing emissions reduces the impact of global warming, and it helps prevent extreme weather events. It also plays a role in preventing biodiversity loss and rising sea levels.

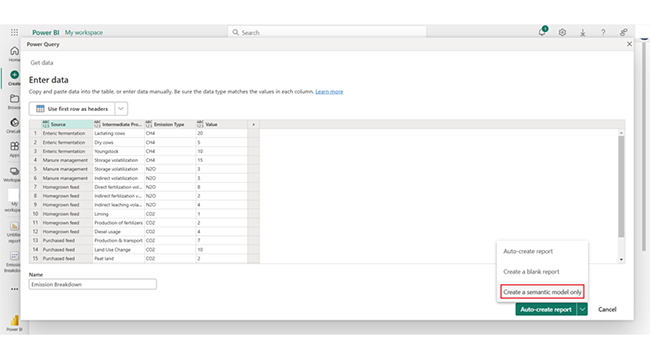
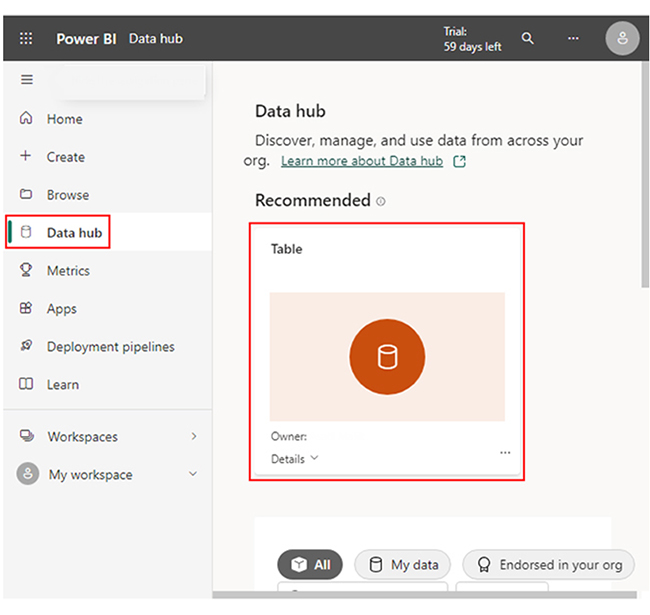
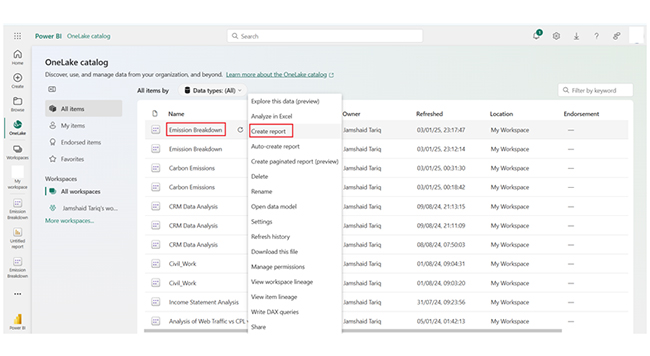
You can create a dashboard in Power BI, and use visualizations like the Sankey chart to represent total greenhouse gas emissions.

One way to get the most out of your visualizations is to incorporate data storytelling into it. And that involves incorporating it into both self-service analytics and the overall data analytics process. All these aid in the effective data evaluation of greenhouse gas emissions.


How much did you enjoy this article?

PBIAd1
Start Free Trial!
148587

Related articles

next previous
Power BI12 min read

Power BI Group By Guide for Effective Data Insights

Learn how Power BI Group By helps you aggregate data, clarify trends, and create reports by grouping values to make large datasets manageable & insightful.

Power BI12 min read

How to Create Sankey Diagram in Microsoft Power BI?

Learn How to Create Sankey Diagram in Microsoft Power BI using Desktop & Web Service. What they are and how to use them effectively.

Power BI8 min read

Power BI Artificial Intelligence: Insights Using Visuals

Discover all there is to know about the Power BI artificial intelligence. You'll also discover how AI is used in Power BI, and how to use it for analysis and more.

Power BI9 min read

Budgeting in Healthcare: Use Visuals to Spot Budget Gaps

This guide helps you discover what budgeting in healthcare is. You'll also discover the factors that affect hospital budgets and types of budgeting in healthcare.

Power BI9 min read

Predictive Analytics in Power BI for Making Insightful Visuals

This guide shows you everything you need to know about Predictive Analytics in Power BI. It also shows you how it works, and how to interpret the results.

ChartExpo logo

Turn Data into Visual
Stories

CHARTEXPO

  • Home
  • Gallery
  • Videos
  • Services
  • Pricing
  • Contact us
  • FAQs
  • Privacy policy
  • Terms of Service
  • Sitemap

TOOLS

  • ChartExpo for Google Sheets
  • ChartExpo for Microsoft Excel
  • Power BI Custom Visuals by ChartExpo
  • Word Cloud

CATEGORIES

  • Bar Charts
  • Circle Graphs
  • Column Charts
  • Combo Charts
  • Comparison Charts
  • Line Graphs
  • PPC Charts
  • Sentiment Analysis Charts
  • Survey Charts

TOP CHARTS

  • Sankey Diagram
  • Likert Scale Chart
  • Comparison Bar Chart
  • Pareto Chart
  • Funnel Chart
  • Gauge Chart
  • Radar Chart
  • Radial Bar Chart
  • Sunburst Chart
  • see more
  • Scatter Plot Chart
  • CSAT Survey Bar Chart
  • CSAT Survey Chart
  • Dot Plot Chart
  • Double Bar Graph
  • Matrix Chart
  • Multi Axis Line Chart
  • Overlapping Bar Chart
  • Control Chart
  • Slope Chart
  • Clustered Bar Chart
  • Clustered Column Chart
  • Box and Whisker Plot
  • Tornado Chart
  • Waterfall Chart
  • Word Cloud
  • see less

RESOURCES

  • Blog
  • Resources
  • YouTube
SIGN UP FOR UPDATES

We wouldn't dream of spamming you or selling your info.

© 2025 ChartExpo, all rights reserved.