• Home
  • Tools dropdown img
    • Spreadsheet Charts

      • ChartExpo for Google Sheets
      • ChartExpo for Microsoft Excel
    • Power BI Charts

      • Power BI Custom Visuals by ChartExpo
    • Word Cloud

  • Charts dropdown img
    • Chart Category

      • Bar Charts
      • Circle Graphs
      • Column Charts
      • Combo Charts
      • Comparison Charts
      • Line Graphs
      • PPC Charts
      • Sentiment Analysis Charts
      • Survey Charts
    • Chart Type

      • Box and Whisker Plot
      • Clustered Bar Chart
      • Clustered Column Chart
      • Comparison Bar Chart
      • Control Chart
      • CSAT Survey Bar Chart
      • CSAT Survey Chart
      • Dot Plot Chart
      • Double Bar Graph
      • Funnel Chart
      • Gauge Chart
      • Likert Scale Chart
      • Matrix Chart
      • Multi Axis Line Chart
      • Overlapping Bar Chart
      • Pareto Chart
      • Radar Chart
      • Radial Bar Chart
      • Sankey Diagram
      • Scatter Plot Chart
      • Slope Chart
      • Sunburst Chart
      • Tornado Chart
      • Waterfall Chart
      • Word Cloud
    • Google Sheets
      Microsoft Excel
  • Services
  • Pricing
  • Contact us
  • Blog
  • Support dropdown img
      • Gallery
      • Videos
      • Contact us
      • FAQs
      • Resources
    • Please feel free to contact us

      atsupport@chartexpo.com

Categories
All Data Visualizations Data Analytics Surveys
Add-ons/
  • Google Sheets
  • Microsoft Excel
  • Power BI
All Data Visualizations Data Analytics Surveys
Add-ons
  • Google Sheets
  • Microsoft Excel
  • Power BI

We use cookies

This website uses cookies to provide better user experience and user's session management.
By continuing visiting this website you consent the use of these cookies.

Ok

ChartExpo Survey


Home > Blog > Microsoft Excel

Excel Automation: Turning Data into Insights Faster

Excel automations. Is this where spreadsheets think and work for you?

Excel Automation

This blog will help you find out.

But first, let’s lay the foundations. Every day, professionals spend hours clicking, dragging, and repeating the same tasks. Now imagine reclaiming that lost time. With Excel automations, you cut repetitive work in half and let Excel handle the details. This gives you the time to focus on higher-value strategic activities.

Excel automations also scale with your needs. It doesn’t matter whether you are dealing with 10 rows or 10,000. What once took hours now takes minutes, freeing your team to do more impactful work. How? Automations handle repetitive calculations, update dashboards, and trigger alerts automatically.

And Excel isn’t standing still. With more users exploring Artificial Intelligence in Excel, automations are getting smarter. Trends are getting predicted, outliers flagged, and insights presented to you in plain sight.

Are you trying to understand what Excel software is used for in modern offices? This guide is your starting point. I will explain it to you, showing how automation plays a key role.

Or are you looking to learn how to add Data Bars in Excel for clearer visuals? You’ll see how automation helps make that process smoother, too.

Without further ado, let’s dive in and boost your Excel workflow…

Table of Contents:

  1. What is Excel Automation?
  2. Why Do We Automate Excel?
  3. What Kind of Excel Tasks Can Be Automated?
  4. Describe Excel Automation Examples
  5. How to Perform Excel Automations (Methods)?
  6. How to Automate Excel Reports?
  7. How to Analyze Automated Spreadsheets?
  8. Benefits of Excel Automation
  9. Limitations of Excel Automation
  10. Improve Efficiency with Excel Automation
  11. FAQs
  12. Wrap Up

What is Excel Automation?

Definition: Excel automations let Excel handle repetitive tasks, reducing errors and saving time. With tools like formulas, macros, or rules, you set instructions once and let Excel do the rest. Grouping data in Excel becomes much quicker, allowing you to focus on more important work.

It’s not just about speed. Consistency is also part of the game. Once automated, tasks like data entry, sorting, or report generation follow the same logic every time, ensuring reliable results. That means fewer mistakes, less manual effort, and more room for analysis and data-driven decision-making.

Why Do We Automate Excel?

Imagine having an assistant who never gets tired, never makes mistakes, and loves spreadsheets. That’s the magic of Excel automation. From speeding up tasks to cutting out errors, it’s changing how people work with data. Here are some of the reasons why more users are ditching the manual grind:

  • Increased efficiency: Automation removes repetitive steps. Instead of spending hours updating rows, Excel handles it instantly.
  • Improved accuracy: Manual work can lead to errors. On the other hand, automation keeps your formulas and data consistent every time.
  • Templates and reports standardization: I know you are tired of every report looking different. Automating templates keeps your layouts clean and makes data easy to compare.
  • Scalability: Dealing with large data sets by hand is tough. With automation, Excel handles thousands of entries as easily as ten.
  • High-complexity business support: Modern businesses juggle complex models and fast-changing data. Excel automation helps teams stay accurate, fast, and in control.
  • Enhanced productivity: Less time cleaning data means more time analyzing it. Automation frees teams to focus on insights, not inputs.

What Kind of Excel Tasks Can Be Automated?

Excel can do more than store data. It can move, clean, combine, and communicate—without you lifting a finger every time. Here’s what Excel automations can handle for you:

  • Data cleaning and transformation: No more deleting blank rows or fixing weird date formats one by one. Automation allows you to clean and reshape your data fast and accurately.
  • Generation of monthly or weekly report: Set it once, and let Excel build the reports on schedule. Charts, totals, and highlights appear automatically.
  • Combining multiple sheets or files: Manually copying from different sheets is time-consuming. Automations can pull and merge data from multiple sources in seconds.
  • Sending email reports directly using Excel: With one click, Excel can send reports straight to your team. Automation eliminates manual exporting, attachments, and extra steps.
  • Using conditional formatting and data validation: Let Excel flag problems or highlight wins for you. This makes adding data bars in Excel or setting rules for clean inputs easier than ever.
  • Exporting and importing data: Connect Excel to other tools. Bring in sales data, or export to a dashboard without retyping anything.
  • Performing what-if analysis: Want to change a few numbers and see new results instantly? Automate What-If analysis in Excel to test scenarios faster than your coffee brews.

Describe Excel Automation Examples

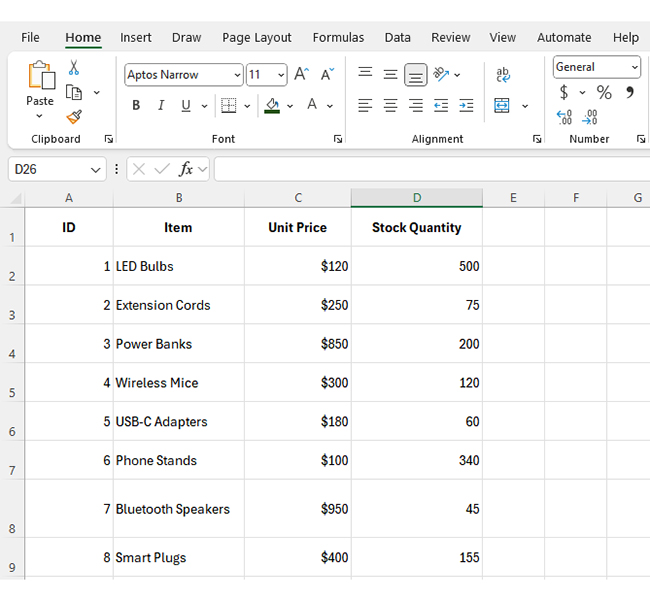
Manual reporting eats up valuable time and increases the risk of errors. That’s why more teams are turning to Excel automation. It streamlines workflows, reduces redundancy, and frees up bandwidth for high-value tasks.

Here are three real examples where Excel steps up and takes the wheel:

  • Sales report automation: Excel pulls the data, updates charts, and highlights top-performing products, all in seconds. You get fresh insights every day, with no extra work involved.
  • Inventory tracker: No more guessing if the stock is low. Excel tracks what’s in, out, and highlights when it’s time to reorder using grouping tools and automated alerts.
  • Customer feedback parser: Got hundreds of survey responses? Excel can scan comments, flag keywords, and summarize sentiment. Pair that with how to parse data in Excel tools and turn messy feedback into clear action.

How to Perform Excel Automations (Methods)?

Have you ever dreamed of Excel doing the boring stuff while you sip your coffee? That’s not a fantasy. It’s Excel automation in action. With a few tools and tricks, you can turn manual chores into one-click tasks or even fully hands-off systems. Here’s how to make it happen:

  1. Macros and VBA: These let you record actions or write scripts to repeat tasks. They are perfect for automating repetitive chores like formatting, copying, or cleaning.
  2. Functions and formulas: These built-in features tackle logic, lookups, and math. They make What-If Analysis in Excel simple and powerful.
  3. Power Query: This tool helps clean and combine messy data. It merges files, reshapes columns, and preps data. All this without altering the source.
  4. Conditional Formatting: This feature lets Excel visually respond to your data by setting rules to highlight trends, errors, or key values. It’s also where you’ll learn how to add data charts in Excel for quick visuals.
  5. Data validation: Keep spreadsheets clean by controlling input. Prevent typos and keep your work in Excel reliable.
  6. Power Automate (Microsoft Power Platform): This service connects Excel with dozens of apps to enable automation, such as sending emails or alerting your team.
  7. Office scripts (Excel on web): This option lets you use JavaScript to automate tasks directly in the browser. It’s fast, cloud-based, and great for repeated actions across workbooks.
  8. Automate Tab: This tab serves as your launchpad for automation. From recording macros to managing scripts, it brings all your automation tools into one centralized place.

How to Automate Excel Reports?

With automation, Excel can remember your steps and do them every time. Whether you’re tracking sales, reviewing budgets, or managing client updates, automation saves time and cuts out human error. Here’s how to do it step-by-step. Don’t worry if you’ve never used a macro before. Just follow these steps:

Step 1: To start fresh, go to File and choose New Blank Workbook. If you’re using an existing report, double-click to open it.

Excel Automation

Step 2: Add your data. Make sure column headings are clear and consistent. What you enter now is what Excel will use in automation.

Excel Automation

Step 3: Turn on the Developer tab. It’s hidden by default but gives you access to powerful tools like macros and VBA.

Excel Automation

The Developer tab should now be on your ribbon.

Excel Automation

Step 4: Click Record Macro in the Developer tab. A small dialog box will pop up.

Excel Automation

Step 5: Name your macro with something clear (e.g., “SalesReportMacro”). Add a shortcut if you like, and store the macro in This Workbook.

Excel Automation

Step 6: Do the tasks you want to automate. Excel records every action—clicks, keystrokes, even formatting.

Excel Automation

Step 7: When you’re done, go back to Developer and click Stop Recording.

Excel Automation

Step 8: Save your file as a macro-enabled workbook. Choose File > Save As, then change the file type to .xlsm. Give it a name, choose a location, and hit Save.

Excel Automation

How to Analyze Automated Spreadsheets?

Let’s be honest. Excel automations save time by reducing manual tasks and fixing formulas. But when it comes to uncovering real insights, Excel’s basic charts often fall short. This limits us because data visualization is essential for spotting trends and making smart decisions.

But don’t worry; we have ChartExpo. This Excel add-in bridges the gap and delivers clearer charts and faster, deeper insights. It turns raw data into actionable decisions that Excel’s built-in tools can’t match.

Try ChartExpo today and see the difference for yourself.

How to Install ChartExpo in Excel?

  1. Open your Excel application.
  2. Open the worksheet and click the “Insert” menu.
  3. You’ll see the “My Apps” option.
  4. In the Office Add-ins window, click “Store” and search for ChartExpo on my Apps Store.
  5. Click the “Add” button to install ChartExpo in your Excel.

ChartExpo charts are available both in Google Sheets and Microsoft Excel. Please use the following CTAs to install the tool of your choice and create beautiful visualizations with a few clicks in your favorite tool.

Example

Let’s analyze the Excel automations sample data below using ChartExpo.

Source Channel

Campaign Type Product Category Region

Conversions

Social Media Awareness Electronics North America 120
Social Media Awareness Electronics Europe 90
Social Media Retargeting Accessories Asia 75
Email Marketing Retargeting Electronics North America 60
Paid Ads Awareness Fashion Asia 110
Paid Ads Conversion Fashion North America 130
Paid Ads Conversion Accessories Europe 85
Organic Search Awareness Fashion Europe 95
Email Marketing Conversion Electronics Asia 70
Organic Search Retargeting Accessories North America 55
  • To get started with ChartExpo, install ChartExpo in Excel.
  • Now, click on My Apps from the INSERT menu.
Excel Automation
  • Choose ChartExpo from My Apps, then click Insert.
Excel Automation
  • Once it loads, choose the “Sankey Chart” from the charts list.
Excel Automation
  • Click the “Create Chart From Selection” button after selecting the data from the sheet, as shown.
Excel Automation
  • ChartExpo will generate the visualization below for you.
Excel Automation
  • If you want to have the chart’s title, click Edit Chart, as shown in the above image.
  • Click the pencil icon next to the Chart Header to change the title.
  • It will open the properties dialog. Under the Text section, you can add a heading in Line 1 and enable Show.
  • Give the appropriate title of your chart and click the Apply button.
Excel Automation
  • You can add the color in Nodes and set the direction as follows:
Excel Automation
  • You can increase font size for better readability as follows:
Excel Automation
  • Click the “Save Changes” button to persist the changes.
Excel Automation
  • Your final chart will appear as follows.
Excel Automation

Insights

  • Paid Ads is the top source channel, contributing 36.52% of total conversions.
  • Social Media follows closely with 32.02% contribution.
  • Awareness campaigns drive the most conversions, accounting for 47% (415 conversions).
  • Electronics and fashion are the leading product categories, with 38% of total conversions.
  • North America is the strongest market, contributing 41% (365 conversions).
  • The most effective sales flow seems to be: Paid Ads → Awareness → Fashion → North America.

Benefits of Excel Automation

Drowning in spreadsheets? You’re not the only one. The endless tabs, the copy-paste chaos—it adds up fast. But here’s the good news: Excel automation can clear the clutter. It handles the repetitive stuff so you can focus on what actually moves the needle.

Here’s what you gain when Excel starts pulling its weight:

  • Time savings: No more clicking through the same steps over and over. Automation handles the routine so you can focus on results.
  • Better accuracy: Automating steps reduces manual input, and with it, the risk of errors. Excel follows the same logic every time, with zero guesswork.
  • Consistency: Reports, formats, and calculations stay the same across files and teams. Everything looks cleaner and more professional.
  • Smarter workflows: Combine tasks using Power Query, Formulas, or even What-If Analysis in Excel. The result? Less effort, and better insights.
  • Data integration: Automations make it easier to interpolate in Excel, import fresh data, or connect with other tools. All this without redoing everything.

Limitations of Excel Automation

Excel automation feels like magic. You set it up, press a button, and things mostly work. But let’s be real: Excel has limits. And if you’re not careful, those limits can sneak up on you.

Here’s where Excel automation can hit a wall:

  • Learning curve: Macros and VBA aren’t always beginner-friendly. One wrong line of code can break your “magic”.
  • Performance drops with big data: Excel can slow down or crash when handling massive datasets. It’s great for thousands of rows, not millions.
  • Fragile workflows: If you change a sheet name or move a column, your macro might stop working. Automation isn’t always flexible.
  • No real-time updates: Automation doesn’t adapt on the fly. Not unless you’re using external tools or artificial intelligence in Excel.
  • Lacks advanced visuals: Even with automation, Excel’s charting is basic. Want dynamic, beautiful visuals? You’ll need tools like ChartExpo to fill the gap.

Improve Efficiency with Excel Automation

Excel can finish your work before your coffee gets cold. It’s not just a wish. It’s the beauty of Excel automation. Automation cuts out repetitive tasks, freeing you up to focus on what really matters. Here’s how it gives your efficiency a real boost:

  • One click, many tasks: Instead of repeating steps daily, automate them once and let Excel handle the rest. Macros can run a whole process while you check your emails.
  • Cleaner data, faster decisions: With tools like Power Query, you can clean, merge, and organize data in seconds. No more hours wasted scrolling and fixing.
  • Visuals that tell a story: Set up auto-refreshing dashboards. Combine it with how to add data bars in Excel, and you get reports that speak for themselves.
  • No more “oops” moments: Automated checks using data validation catch errors before they mess things up. That alone saves hours of cleanup.

FAQs

Can you do automations in Excel?

Yes. You can automate tasks in Excel using tools like Macros, VBA, and Power Query. These methods help with formatting, calculations, and data imports. Excel automation saves time, reduces errors, and improves workflow efficiency.

Which tool is best for Excel automation?

Choosing the best tool depends on your needs. While Macros are simple for beginners, consider VBA or Power Query for more advanced tasks. If you’re working online, Office Scripts works well. For integration with other apps, Microsoft Power Automate is powerful.

Which Excel feature allows you to automate?

In addition to these tools, several Excel features support automation. For example, Macros record and replay actions, and VBA lets you write custom code. Power Query cleans and transforms data. And it doesn’t stop here. Conditional Formatting and Data Validation automate parts of your workflow without coding.

Wrap Up

Excel automation is changing the game. From generating reports to building dashboards, Excel now does more with less manual effort. It’s faster, cleaner, and simply smarter.

And what is MS Excel used for in business? Pretty much everything. Companies across finance, marketing, and operations rely on it to track, analyze, and visualize data. Excel often powers the processes you don’t even see.

Here’s where it gets better—automation. But first, know your basics: Excel workbook vs worksheet. A workbook is the entire file, and each worksheet is a tab inside it. Automation connects them all—no jumping between tabs or copying formulas.

If you’ve ever wondered how to parse data in Excel, automation makes it effortless. Instead of sorting line by line, use tools like Power Query or simple scripts to extract just the data you need. Clean, fast, and on point.

The bottom line? Automation doesn’t replace you—it empowers you. How? It ensures less clicking and more thinking. So, let Excel do the busywork so you can focus on strategy, insights, and decision-making.

Want to take your data visuals to the next level? Pair Excel with ChartExpo for clear, compelling dashboards that speak volumes.

How much did you enjoy this article?

ExcelAd2
Start Free Trial!
157475

Related articles

next previous
Microsoft Excel13 min read

Excel Template for Job Tracking: A Complete Guide

An Excel template for job tracking helps organize tasks and progress. This guide shows how to use it and boost results with smart tips and tools.

Microsoft Excel12 min read

Audit Dashboard in Excel: A Complete Walkthrough

An audit dashboard in Excel tracks audits and risks using clear visuals. Learn how to build, use, and improve dashboards with charts and practical tips.

Microsoft Excel11 min read

How to Create a Matrix in Excel: Core Insights

Learn how to create a matrix in Excel to organize and analyze data. This guide shares simple steps, smart tips, and how to use visual tools like ChartExpo.

Microsoft Excel13 min read

How to Make a Template in Excel: A Simple Guide

Discover how to make a template in Excel for faster, cleaner work. Here, you’ll learn steps, examples, and how ChartExpo enhances your data and more.

Microsoft Excel9 min read

How to Compare Columns in Excel for Clear Insights

Learn how to compare columns in Excel using simple tools and formulas. This guide helps you spot differences, analyze data, and improve accuracy.

ChartExpo logo

Turn Data into Visual
Stories

CHARTEXPO

  • Home
  • Gallery
  • Videos
  • Services
  • Pricing
  • Contact us
  • FAQs
  • Privacy policy
  • Terms of Service
  • Sitemap

TOOLS

  • ChartExpo for Google Sheets
  • ChartExpo for Microsoft Excel
  • Power BI Custom Visuals by ChartExpo
  • Word Cloud

CATEGORIES

  • Bar Charts
  • Circle Graphs
  • Column Charts
  • Combo Charts
  • Comparison Charts
  • Line Graphs
  • PPC Charts
  • Sentiment Analysis Charts
  • Survey Charts

TOP CHARTS

  • Sankey Diagram
  • Likert Scale Chart
  • Comparison Bar Chart
  • Pareto Chart
  • Funnel Chart
  • Gauge Chart
  • Radar Chart
  • Radial Bar Chart
  • Sunburst Chart
  • see more
  • Scatter Plot Chart
  • CSAT Survey Bar Chart
  • CSAT Survey Chart
  • Dot Plot Chart
  • Double Bar Graph
  • Matrix Chart
  • Multi Axis Line Chart
  • Overlapping Bar Chart
  • Control Chart
  • Slope Chart
  • Clustered Bar Chart
  • Clustered Column Chart
  • Box and Whisker Plot
  • Tornado Chart
  • Waterfall Chart
  • Word Cloud
  • see less

RESOURCES

  • Blog
  • Resources
  • YouTube
SIGN UP FOR UPDATES

We wouldn't dream of spamming you or selling your info.

© 2025 ChartExpo, all rights reserved.