Categories
Picture yourself sitting at an office desk, surrounded by stacks of data sheets, feeling overwhelmed. You’ve been tasked with conducting a descriptive research design analysis and are unsure where to start.


Don’t worry, dear analyst – Excel is here to save the day. With powerful features and a user-friendly interface, Excel is determined to simplify your life.
But how do you analyze data for a descriptive research design in Excel?
Keep reading as I take you on an exhilarating data analysis journey. We’ll explore the depths of Excel’s functions to unearth hidden patterns, trends, and insights from your data.
With a few clicks, you’ll transform that jumbled mess of information into a symphony of insights. It’s like watching a beautifully choreographed dance of numbers unfold before your eyes.
Excel will be your knight in shining armor, from organizing and cleaning data to generating comprehensive reports.
Let’s get started on this thrilling adventure.
Definition: Descriptive research is a method used to systematically describe and analyze a subject without manipulating variables. It focuses on gathering detailed information about a phenomenon, population, or situation to identify patterns, trends, and relationships.
This research type is commonly used in Surveys, case studies, and observational studies to provide a clear and accurate representation of real-world conditions.
Definition: Descriptive research design aims to describe and analyze the characteristics of a particular phenomenon or group. It collects data to provide a detailed picture of the subject under study, much like what a data analyst does when examining data to uncover patterns and insights.
This design does not involve manipulating variables or establishing cause-effect relationships. Instead, it observes and measures variables to summarize and describe them objectively. Simply, it helps answer the questions of what, when, where, and how.
Descriptive research design refers to a structured methodology used to systematically collect, analyze, and present data about a subject without influencing it. It aims to describe the characteristics, trends, or behaviors of a population or phenomenon in a detailed and factual manner.
Common methods include surveys, observations, and case studies, making it ideal for identifying patterns and drawing insights without establishing causal relationships.
Descriptive research design helps in capturing real-world data without manipulation, ensuring an accurate reflection of a subject or phenomenon.
It allows researchers to analyze behaviors, trends, and characteristics, making it valuable for market research, social studies, and business analysis.
By offering factual insights, descriptive research helps businesses, policymakers, and organizations make informed decisions based on observed data.
It lays the groundwork for exploratory or experimental research by identifying key variables and relationships for deeper investigation.
Descriptive research provides a clear and structured understanding of a subject, helping researchers communicate findings effectively.
Use descriptive research when analyzing consumer behavior, preferences, and trends to make data-driven business decisions.
It helps in identifying demographic, behavioral, and psychographic characteristics of a specific group.
Ideal for surveys and questionnaires to gather opinions on products, services, or social issues.
When researchers need to study behaviors or events without interference, such as customer interactions or natural occurrences.
Useful for collecting initial data before conducting experimental or correlational research for deeper insights.
Let’s explore the characteristics that make descriptive research design a valuable tool in research.
Descriptive research design encompasses various types that you can employ depending on the research objectives and context. Here are the six common types of descriptive research designs:
These designs involve the detailed examination and description of an individual or a series of cases. They provide in-depth insights into a specific phenomenon or condition.
Normative research establishes benchmarks or standards by studying a population’s characteristics, behaviors, or attitudes. It helps in establishing norms and guidelines for comparison or evaluation.
This design involves administering surveys or questionnaires to collect data on specific variables from a representative sample. It provides a snapshot of the characteristics or opinions of the target population at a particular point.
Correlative surveys aim to identify relationships or associations between variables. They collect data on multiple variables and analyze their interrelationships through statistical analysis. As a result, determine the strength and direction of associations.
Cross-sectional studies gather data from a specific population or sample at a single point in time. By employing techniques like cross-tabulation, they help in describing the prevalence, distribution, and relationships between variables within the population at that moment.
Comparative studies involve comparing different groups or populations to identify similarities, differences, or patterns of interest. These studies seek to understand variations across different groups and explore potential factors influencing those variations.
| Aspect | Descriptive Research | Experimental Research |
| Purpose | Describes characteristics, behaviors, or trends without manipulation. | Tests cause-and-effect relationships by manipulating variables. |
| Control Over Variables | No control over variables; observes naturally occurring data. | Controls and manipulates independent variables to measure effects. |
| Data Collection | Surveys, observations, case studies. | Experiments, controlled trials, lab tests. |
| Outcome | Provides a detailed snapshot of a situation. | Determines causality and relationships between variables. |
| Example | Studying customer preferences in a market. | Testing how a new drug affects patient recovery. |
This method involves collecting data by watching and recording behaviors, events, or conditions as they naturally occur. It is commonly used in psychology, social sciences, and market research.
Surveys use questionnaires or interviews to gather data from a large sample. This method is widely used in business, healthcare, and social research to understand opinions, preferences, or behaviors.
A detailed examination of a single subject, organization, or event. This method provides deep insights but may not be generalizable to a larger population.
This method collects data at a single point in time to analyze patterns, trends, and relationships among variables. It is useful in market research and public health studies.
Data is collected over an extended period to observe changes and trends over time. It is commonly used in medical research, education, and behavioral studies.
A company surveys to measure customer satisfaction with its products and services. The collected responses help in identifying trends and areas for improvement.
A school analyzes students’ test scores over a semester to understand academic performance and identify factors affecting learning outcomes.
A business collects data on consumer preferences, purchasing behavior, and competitor pricing to determine market trends and adjust marketing strategies accordingly.
A hospital examines patient records to assess the prevalence of certain diseases and identify risk factors in different demographics.
Let’s unravel the enigma of how to conduct a descriptive research design survey like true data detectives.
Clearly articulate what you aim to achieve through the survey. A well-defined objective ensures a focused and effective research design.
Identify the specific group or demographic that represents your research focus, such as customers, employees, or a particular interest group.
Choose a sampling technique that best fits your research goals, such as random sampling, stratified sampling, or convenience sampling, ensuring a representative sample.
Design a survey or questionnaire that aligns with your research objectives. Ensure the questions are clear, concise, and relevant to the data you need.
Conduct a small-scale test with a sample similar to your target audience. Identify and correct any unclear or ambiguous questions before full deployment.
Distribute the survey using the chosen data collection method, ensuring ethical considerations and accuracy in data collection.
Use statistical tools or qualitative methods to examine responses, identify patterns, and draw meaningful insights from the collected data.
Present the results in an organized manner using charts, tables, or narrative summaries, ensuring clarity and alignment with the initial research objectives.
Are you tired of staring blankly at those endless rows and columns in Microsoft Excel? Wondering why it doesn’t “Excel” in data visualization?
Well, fear not, because we’ve got the perfect solution for you.
Introducing ChartExpo, the ultimate tool to transform your data into insightful, appealing visual representations. With ChartExpo, you can analyze your data for descriptive research design and create eye-catching visualizations effortlessly.
Plus, if you’re looking to streamline your data collection process, you can use a survey template in Excel to gather responses efficiently. These visualizations will make your data come alive and offer valuable insights.
Benefits of Using ChartExpo
How to Install ChartExpo in Excel?
ChartExpo charts are available both in Google Sheets and Microsoft Excel. Please use the following CTA’s to install the tool of your choice and create beautiful visualizations in a few clicks in your favorite tool.
Let’s say your company has sent an online survey to recent customers to gather feedback. Below are examples of descriptive research questions in the survey.
You are expecting one of the following responses for each question.
Assume your survey yields the data table below.
| Do you agree the price of our product is affordable? | Do you agree the quality of the product is better than others? | Do you agree our product is available in all stores in your city? |
| Strongly Agree | Neither agree nor disagree | Strongly Disagree |
| Neither agree nor disagree | Strongly Agree | Agree |
| Strongly Agree | Neither agree nor disagree | Strongly Agree |
| Neither agree nor disagree | Disagree | Agree |
| Disagree | Strongly Disagree | Strongly Disagree |
| Strongly Agree | Agree | Strongly Agree |
| Agree | Strongly Disagree | Agree |
| Neither agree nor disagree | Agree | Disagree |
| Agree | Strongly Agree | Strongly Agree |
| Strongly Agree | Strongly Agree | Strongly Agree |
| Strongly Disagree | Neither agree nor disagree | Disagree |
| Strongly Agree | Strongly Agree | Strongly Disagree |
| Neither agree nor disagree | Strongly Disagree | Disagree |
| Strongly Agree | Strongly Agree | Strongly Agree |
| Agree | Agree | Agree |
| Strongly Disagree | Neither agree nor disagree | Disagree |
| Strongly Agree | Strongly Agree | Strongly Agree |
| Strongly Agree | Disagree | Strongly Agree |
| Disagree | Strongly Disagree | Strongly Agree |
| Strongly Disagree | Disagree | Disagree |
This table contains example data. Expect many responses and questions in real life.


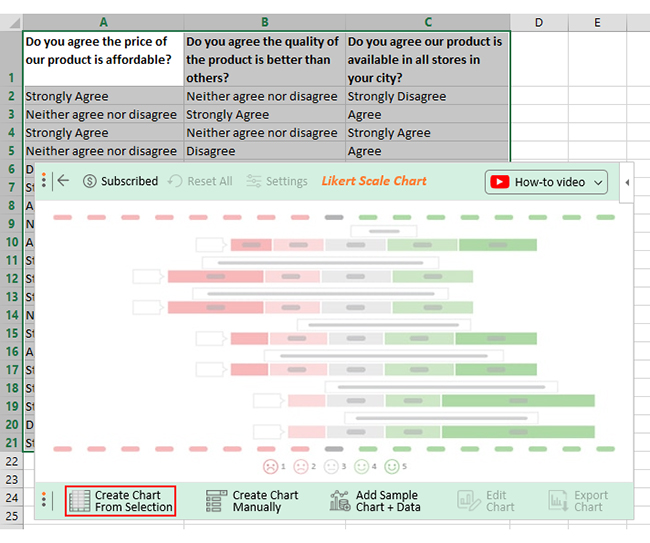
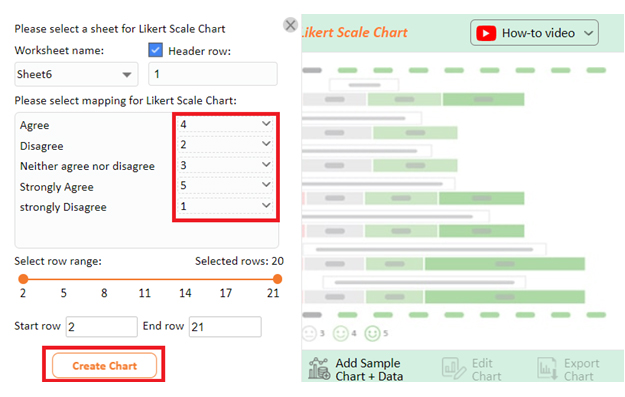

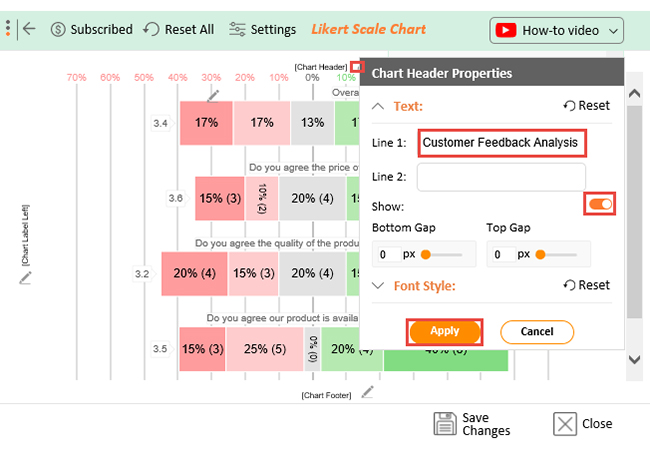
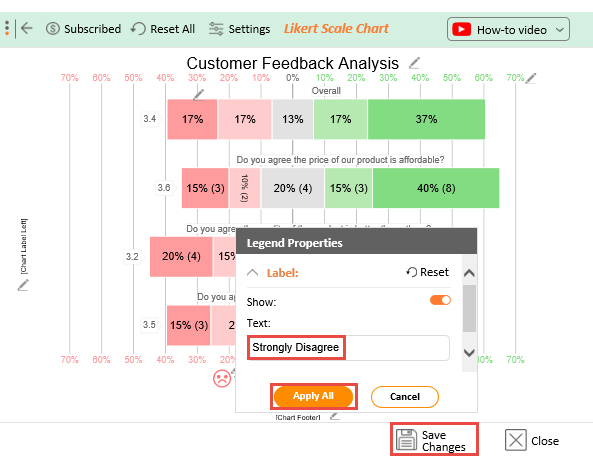
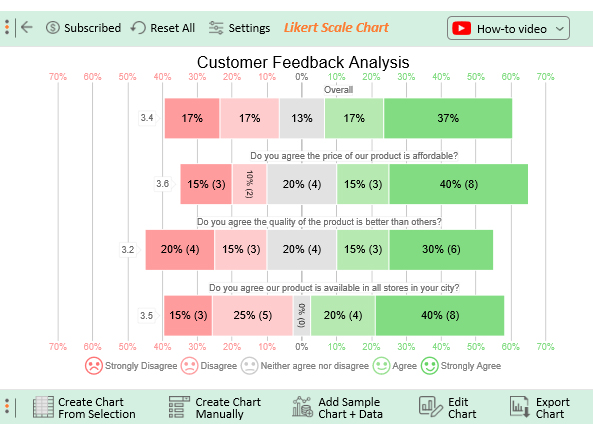
The following video will help you to create a Likert Scale Chart in Microsoft Excel.
Descriptive research captures real-world data as it exists, ensuring an accurate and detailed representation of the subject being studied.
By analyzing collected data, researchers can recognize trends, correlations, and recurring patterns, aiding in decision-making.
Organizations and researchers use descriptive research findings to make informed decisions based on factual data rather than assumptions.
Descriptive research can be conducted through surveys, observations, case studies, and other methods, making it highly flexible.
Compared to experimental research, descriptive research is often less expensive and quicker to conduct, making it accessible for various industries.
Descriptive research only explains what is happening but does not determine why it happens, as it does not establish cause-and-effect relationships.
Researcher or respondent bias can influence data collection and interpretation, leading to skewed results.
Since descriptive research observes data as it exists, researchers have little to no control over external factors that may affect results.
Collecting and analyzing large amounts of data can take significant time, especially when using surveys or observational methods.
Since the research focuses on describing rather than analyzing deeply, there is a risk of drawing incorrect conclusions from the data.
Clearly outline the research goals to ensure data collection aligns with the purpose and avoids unnecessary information.
Select appropriate methods such as surveys, case studies, or observations to gather accurate and relevant data.
Ensure objectivity by using neutral language in surveys, training researchers properly, and avoiding leading questions.
Ensure credibility by collecting data from verified sources and using standardized measurement tools.
Use statistical tools and software to organize, interpret, and present data effectively for meaningful insights.
Descriptive research design aims to describe and summarize characteristics, behaviors, or phenomena. It involves collecting and analyzing data systematically and objectively. Consequently, providing a snapshot or overview of the subject of study.
Data in descriptive research design is collected through surveys, observations, and existing records or documents. Surveys involve administering questionnaires or interviews to gather information directly from participants. Observations involve systematically recording behaviors or phenomena. Furthermore, you can analyze existing records or documents to extract relevant data.
Descriptive research design aims to describe and summarize characteristics or phenomena. In contrast, experimental research design seeks to establish cause-and-effect relationships between variables through controlled manipulation. Furthermore, descriptive research observes existing variables, while experimental research involves the intentional manipulation of variables.
Analyzing data for descriptive research design in Excel offers a powerful and accessible approach to uncovering insights. Leveraging Excel’s data analysis tools gives you a comprehensive understanding of the data and draw meaningful conclusions.
Import the data into Excel and organize it in a structured format. Then use Excel’s built-in functions and formulas to perform calculations, generate summary statistics, and create derived variables.
With the data prepared, utilize ChartExpo to create visually appealing and interactive charts, graphs, and visualizations.
ChartExpo offers a wide range of customizable chart types and templates to communicate descriptive findings effectively. Use features like color coding, labels, and annotations to highlight key insights and patterns. Furthermore, ChartExpo’s interactive capabilities enable drill-downs and filtering options to explore the data further.
Combining Excel’s analytical power and ChartExpo’s visual impact enables effective analysis and presentation of research findings. This helps stakeholders understand data better and make informed decisions based on insights from the analysis.
Don’t just visualize your data; chart-tactically conquer it with ChartExpo.
How much did you enjoy this article?


Google Forms to Google Sheets keeps your data organized and current with every submission. Learn the steps, methods, and tips now!

Product survey questions reveal what customers truly think. Learn how to ask the right ones and act on the survey results. Read on!

Learn how the 5-Point Performance Rating Scale improves employee evaluations with clear, consistent, and fair performance reviews across teams.


