• Home
  • Tools dropdown img
    • Spreadsheet Charts

      • ChartExpo for Google Sheets
      • ChartExpo for Microsoft Excel
    • Power BI Charts

      • Power BI Custom Visuals by ChartExpo
    • Word Cloud

  • Charts dropdown img
    • Chart Category

      • Bar Charts
      • Circle Graphs
      • Column Charts
      • Combo Charts
      • Comparison Charts
      • Line Graphs
      • PPC Charts
      • Sentiment Analysis Charts
      • Survey Charts
    • Chart Type

      • Box and Whisker Plot
      • Clustered Bar Chart
      • Clustered Column Chart
      • Comparison Bar Chart
      • Control Chart
      • CSAT Survey Bar Chart
      • CSAT Survey Chart
      • Dot Plot Chart
      • Double Bar Graph
      • Funnel Chart
      • Gauge Chart
      • Likert Scale Chart
      • Matrix Chart
      • Multi Axis Line Chart
      • Overlapping Bar Chart
      • Pareto Chart
      • Radar Chart
      • Radial Bar Chart
      • Sankey Diagram
      • Scatter Plot Chart
      • Slope Chart
      • Sunburst Chart
      • Tornado Chart
      • Waterfall Chart
      • Word Cloud
    • Google Sheets
      Microsoft Excel
  • Services
  • Pricing
  • Contact us
  • Blog
  • Support dropdown img
      • Gallery
      • Videos
      • Contact us
      • FAQs
      • Resources
    • Please feel free to contact us

      atsupport@chartexpo.com

Categories
All Data Visualizations Data Analytics Surveys
Add-ons/
  • Google Sheets
  • Microsoft Excel
  • Power BI
All Data Visualizations Data Analytics Surveys
Add-ons
  • Google Sheets
  • Microsoft Excel
  • Power BI

We use cookies

This website uses cookies to provide better user experience and user's session management.
By continuing visiting this website you consent the use of these cookies.

Ok

ChartExpo Survey


Home > Blog > Microsoft Excel

Data Modeling in Excel for Effective Insights

What is data modeling in Excel? How about turning raw data into insights with just a few clicks? This is the magic of Excel data modeling. This feature simplifies how businesses work with information.

The data pool is almost infinite, and companies generate piles of information every day. According to IBM, 2.5 quintillion bytes of data are produced daily, that’s a staggering amount! Excel enables data modeling that helps sift through this information overload.

Data modeling involves creating a structured data representation in Excel for analysis and interpretation. It includes arranging data in a table, building relations, and calculating fields for more detailed analysis.

Data Modeling in Excel

Why is this important? A Forrester Research survey found that 60% of businesses need help with data quality. To avoid such challenges, employ data modeling in Excel. Why? It displays a neat and organized data structure.

Data modeling also allows for some powerful analysis. You can build pivot tables, graphs, and dashboards to see trends or patterns. A visual perspective on your data analysis facilitates faster and more intelligent decisions.

As businesses rely on data for their decisions, how we model that information is also becoming more important. So, we’ll look at data modeling in Excel to give you a valuable skill in high demand across industries.

Table of Contents:

  1. What is Data Modeling in Excel?
  2. Why is Using Data Modeling in Excel Important?
  3. What are the Key Components of Data Modeling in Excel?
  4. When to Use a Data Model in Excel?
  5. How to Manage Data Model in Excel?
  6. How to Create a Data Model in Excel?
  7. 10 Different Use Cases Visualizing in Sankey Diagram
  8. How to Visualize Results in Excel?
  9. Wrap Up

First…

What is Data Modeling in Excel?

Definition: Data modeling in Excel is the process of organizing and structuring data to make it easier to analyze. It involves creating relationships between different datasets to ensure accurate insights.

Excel allows you to manage large amounts of data. Data models help in building reports, dashboards, charts, and graphs efficiently. They eliminate the need for complex formulas by automating connections between tables.

This approach simplifies decision-making and improves the accuracy of data analysis.

Why is Using Data Modeling in Excel Important?

Data modeling in Excel goes beyond basic spreadsheets. It transforms how you handle, analyze, and present data. Whether working with small datasets or large amounts of information makes a big difference.

  • Better data management: Data modeling organizes your data efficiently. It creates a structured system that’s easier to manage and update.
  • Improved decision-making: It connects different datasets to offer accurate insights, helping you make informed, data-driven decisions.
  • Efficiency and automation: Data modeling automates tasks like linking tables and updating figures. It eliminates the need for complex manual formulas, saving time.
  • Advanced analytics: It enables advanced features like pivot tables and Power Pivot, which help to analyze data more profoundly and spot trends.
  • Scalability: Excel’s model can scale as data grows, ensuring smooth performance.
  • Data integrity: With data modeling, you reduce the risk of errors. It ensures consistency and accuracy across linked datasets.

What are the Key Components of Data Modeling in Excel?

Data modeling in Excel simplifies how you work with data. It turns scattered information into structured, meaningful insights.

Here are the key components that make this possible:

  1. Tables: Tables organize your data in a structured way. They act as the foundation of your data model.
  2. Relationships: Relationships link different tables, allowing them to interact and share information seamlessly.
  3. Primary keys: These are unique identifiers for each row in a table. They ensure every data point is distinct.
  4. Foreign keys: Foreign keys connect tables by referencing primary keys in related tables, forming relationships.
  5. Data types: Defining the correct data types, like text, number, or date, ensures accuracy in calculations and analysis.
  6. Calculated columns: These are custom columns created using formulas. They help derive new data from existing values.
  7. Measures: In reports and pivot tables, measures are formulas used to calculate values, like sums or averages.
  8. Power Pivot: Power Pivot enables the creation of complex data models. It helps you manage large datasets and relationships.
  9. Pivot tables: Pivot tables summarize your data, making it easier to analyze trends and patterns.
  10. Visualizations: Charts and graphs bring your data to life. They help you present your findings clearly and visually.

When to Use a Data Model in Excel?

Excel isn’t just for simple spreadsheets. A data model can make all the difference when your data grows complex. Here’s when to use one:

  • Multiple tables: If your data is spread across several tables, use a data model. Why? To connect them and analyze everything in one place.
  • Large datasets: A data model helps you manage massive amounts of data efficiently without slowing down Excel.
  • Advanced analysis: For detailed reports or complex calculations, data modeling enables you to use advanced tools like Power Pivot and pivot tables.

How to Manage Data Model in Excel?

Managing a data model in Excel ensures smooth analysis and accurate insights. Here’s how you can stay organized and efficient with your data.

  • Create and organize tables: Start by structuring your data into well-organized tables. This forms the foundation of your model.
  • Establish relationships and define data types: Link tables using relationships and ensure data types are correctly set. This makes your data model function seamlessly.
  • Use Power Pivot and refresh data: Power Pivot allows you to manage complex models and handle large datasets. Refresh your data regularly to keep everything up-to-date.
  • Optimize performance and document the model: Keep your model running smoothly by optimizing performance. Document it to ensure others can understand and use it.

How to Create a Data Model in Excel?

Creating a data model in Excel transforms raw data into meaningful insights. It’s easy to set up and enhances your analysis.

Here’s how to get started:

  1. Prepare your data: Ensure your data is clean and organized in tables. This sets the stage for a smooth modeling process.
  2. Load data into the data model: Import your tables into Excel’s data model to connect and work with them seamlessly.
  3. Establish relationships: Link related tables by creating relationships. This allows you to analyze data across different sources.
  4. Create calculated columns and measures: Add custom calculations to your model. Use calculated columns and measures to derive new insights.
  5. Analyze data with Pivot Tables: Use pivot tables to summarize and explore your data. This makes it easier to spot trends and patterns.
  6. Visualize results: Create charts and graphs to present your findings. Visualizations bring your data model to life.

10 Different Use Cases Visualizing in Sankey Diagram

Use Case 1

Use Case 1 After Doing Data Modeling in Excel

Use Case 2

Use Case 2 After Doing Data Modeling in Excel

Use Case 3

Use Case 3 After Doing Data Modeling in Excel

Use Case 4

Use Case 4 After Doing Data Modeling in Excel

Use Case 5

Use Case 5 After Doing Data Modeling in Excel

Use Case 6

Use Case 6 After Doing Data Modeling in Excel

Use Case 7

Use Case 7 After Doing Data Modeling in Excel

Use Case 8

Use Case 8 After Doing Data Modeling in Excel

Use Case 9

Use Case 9 After Doing Data Modeling in Excel

Use Case 10

Use Case 10 After Doing Data Modeling in Excel

How to Visualize Results in Excel?

Have you ever stared at an Excel spreadsheet and felt your eyes glaze over? You’re not alone.

Data visualization is the superhero of data analysis, transforming dull numbers into dazzling insights. But Excel? It’s more like the sidekick who tries hard but often falls short. Its chart options can leave you feeling stuck in the 90s.

Enter ChartExpo. This add-on swoops in to save you from Excel’s limited visual repertoire. It’s here to turn your data into eye-catching, informative charts faster than you can say “pivot table.”

With ChartExpo, you’re no longer confined to Excel’s basic bar charts and pie charts. It’s time to give your data the red-carpet treatment it deserves.

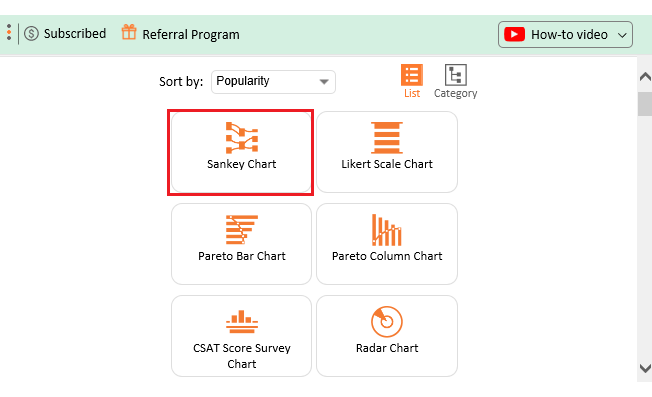
Let’s learn how to install ChartExpo in Excel.

  1. Open your Excel application.
  2. Open the worksheet and click the “Insert” menu.
  3. You’ll see the “My Apps” option.
  4. In the Office Add-ins window, click “Store” and search for ChartExpo on my Apps Store.
  5. Click the “Add” button to install ChartExpo in your Excel.

ChartExpo charts are available both in Google Sheets and Microsoft Excel. Please use the following CTAs to install the tool of your choice and create beautiful visualizations with a few clicks in your favorite tool.

Example

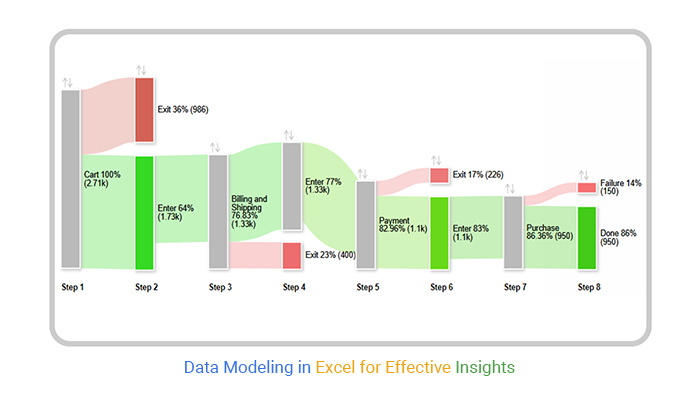
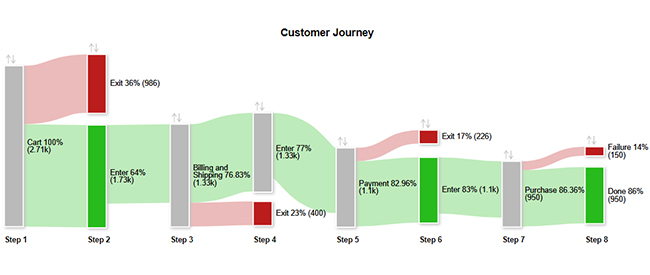
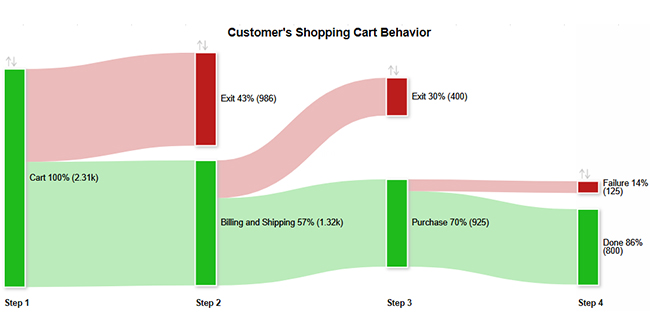
Let’s visualize the data modeling sample data below in Excel using ChartExpo.

Step 1 Step 2 Step 3 Step 4 Step 5 Step 6 Step 7 Step 8 Users
Cart Exit 986
Cart Enter 1726
Billing and Shipping Exit 400
Enter Billing and Shipping Enter 1326
Payment Exit 226
Enter Payment Enter 1100
Purchase Failure 150
Enter Purchase Done 950
  • To get started with ChartExpo, install ChartExpo in Excel.
  • Now Click on My Apps from the INSERT menu.
insert chartexpo in excel
  • Choose ChartExpo from My Apps, then click Insert.
open chartexpo in excel
  • Once it loads, choose the “Sankey Chart” from the charts list.
search sankey chart in excel
  • Click the “Create Chart From Selection” button after selecting the data from the sheet, as shown.
Click Create Chart From Selection After Doing Data Modeling in Excel
  • ChartExpo will generate the visualization below for you.
Initial Visual After Doing Data Modeling in Excel
  • If you want to have the chart’s title, click Edit Chart, as shown in the above image.
  • Click the pencil icon next to the Chart Header to change the title.
  • It will open the properties dialog. Under the Text section, you can add a heading in Line 1 and enable Show.
  • Give the appropriate title of your chart and click the Apply button.
Add Chart After Doing Data Modeling in Excel
  • Let’s give colors to the nodes. Click the pencil icon at the top of the nodes and go to “Node“. Select the color and click the “Apply” button to save all changes.
Give Color to Node After Doing Data Modeling in Excel
  • Click the “Save Changes” button to persist the changes.
Click Save Changes After Doing Data Modeling in Excel
  • Your final chart will appear below.
Final Data Modeling in Excel

Insights

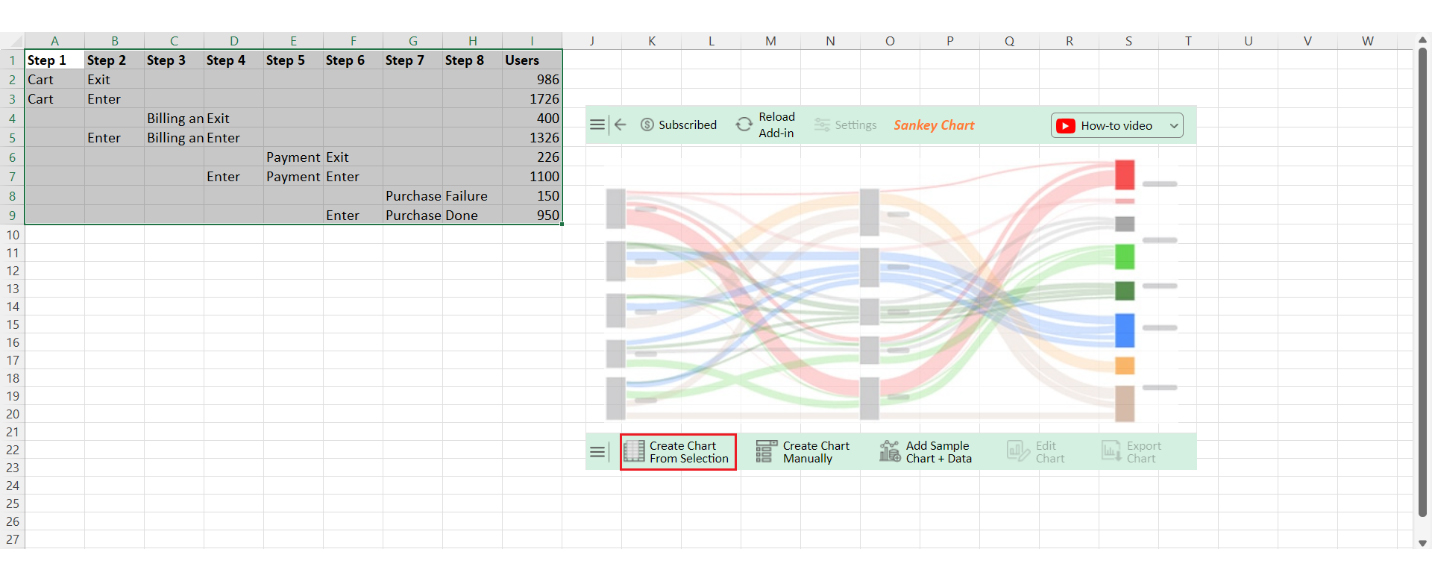
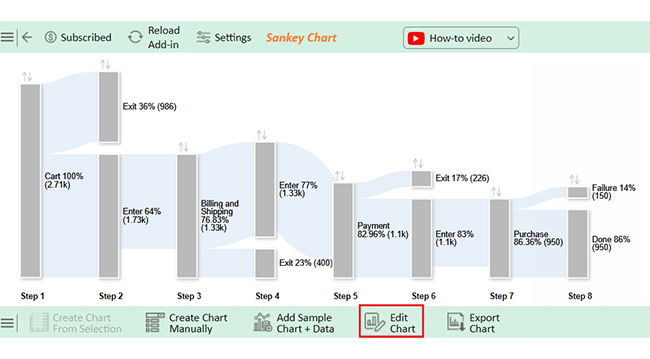
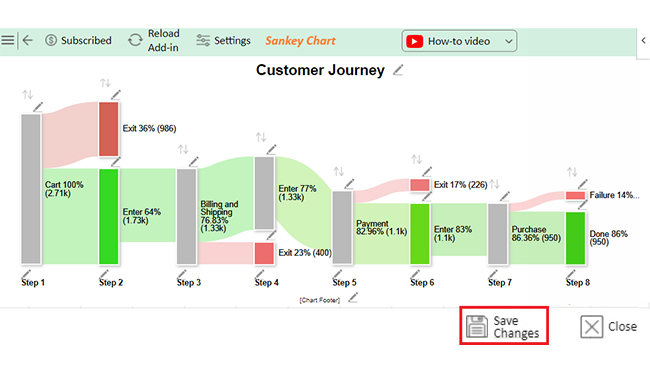
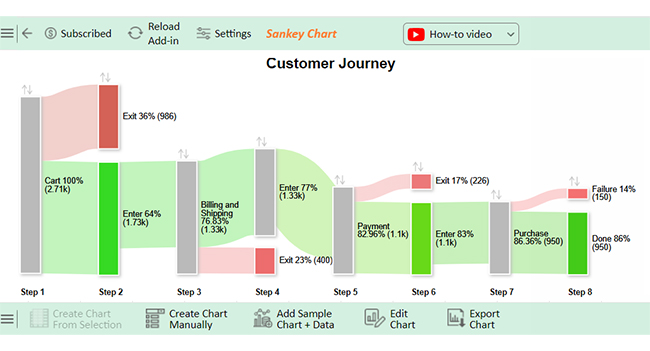
This data tracks user behavior through the purchase funnel.

  • 1,726 users entered the cart.
  • 950 users completed the purchase.
  • There were significant drop-offs at the billing/shipping and payment stages.
  • There are potential areas for improving the checkout process.

Drive Accuracy in Data Modeling with Charts in Microsoft Excel:

  1. Open your Excel Application.
  2. Install ChartExpo Add-in for Excel from Microsoft AppSource to create interactive visualizations.
  3. Select the Sankey Chart from the list of charts.
  4. Select your data.
  5. Click on the “Create Chart from Selection” button.
  6. Customize your chart properties to add header, axis, legends, and other required information.

The following video will help you create a Sankey Chart in Microsoft Excel.

FAQs

Can I create interactive charts using data modeling in Excel?

Yes, you can create interactive charts in Excel using data modeling. Use features like PivotTables, Power Query, and Power Pivot. These tools help visualize complex data. Also, add slicers and timelines for interactivity, making data analysis more engaging and insightful.

What types of charts can be generated from a data model in Excel?

Excel can generate various charts from a data model, including line, bar, column, pie, and scatter charts. You can also create PivotCharts, histograms, and waterfall charts. Each chart type helps visualize different data patterns and trends effectively.

What is the role of relationships in Excel data modeling?

Relationships in data modeling connect tables using standard fields, allowing Excel to combine and analyze related data. Data modeling enables accurate data aggregation and reporting across multiple tables. Moreover, it supports complex calculations and creates dynamic, interactive reports or charts in Excel.

Can I import data from external sources into Excel for data modeling?

You can import data from external sources into Excel for data modeling. Power Query connects to databases, web pages, CSV files, and more. This lets you combine, clean, and shape data for analysis and visualization.

Wrap Up

Data modeling in Excel transforms how you organize and analyze information. It creates a structured way to manage large datasets with ease. By connecting tables and defining relationships, it simplifies complex data tasks.

One significant benefit is improved data management. With everything organized, updates and changes become easier to handle. Data modeling reduces errors and keeps your data accurate.

Data modeling also supports better decision-making. It helps you analyze data quickly and uncover trends or insights. Pivot tables and charts make it even simpler to conclude.

A huge advantage of using a data model is efficiency. It eliminates manual work by automating calculations and relationships, saving time and streamlining workflow.

Another key feature is scalability. As your data grows, Excel’s data model can still manage it smoothly. You won’t face slowdowns or performance issues.

Conclusively, data modeling in Excel is a powerful tool. It improves data accuracy, saves time, and enhances your ability to analyze and make informed decisions.

How much did you enjoy this article?

ExcelAd2
Start Free Trial!
141628

Related articles

next previous
Microsoft Excel9 min read

KPI Dashboard in Excel: A Complete Guide

A KPI dashboard in Excel helps track key metrics and streamline data visualization. Discover how to create, analyze, and use it with clear guides and examples.

Microsoft Excel11 min read

How to Plot a Speedometer Chart in Excel?

Create a Speedometer Chart in Excel to track KPIs, goals, and performance metrics visually. Explore templates, examples, and step-by-step instructions for better dashboards.

Microsoft Excel13 min read

Excel for Teachers for Insightful Preparation

Excel for teachers simplifies grading, tracks attendance, and organizes data. Find its key features, expert tips, and how ChartExpo enhances data visualization.

Microsoft Excel14 min read

How to Make a Cash Flow Diagram in Excel?

Learn how to make a Cash Flow Diagram in Excel. It will help you learn to visualize and analyze inflows and outflows of your business cash flow.

Microsoft Excel11 min read

Succession Planning Template for Long-Term Success

Succession Planning Templates help businesses prepare for leadership changes. Learn to create, analyze, and use them for seamless transitions and growth.

ChartExpo logo

Turn Data into Visual
Stories

CHARTEXPO

  • Home
  • Gallery
  • Videos
  • Services
  • Pricing
  • Contact us
  • FAQs
  • Privacy policy
  • Terms of Service
  • Sitemap

TOOLS

  • ChartExpo for Google Sheets
  • ChartExpo for Microsoft Excel
  • Power BI Custom Visuals by ChartExpo
  • Word Cloud

CATEGORIES

  • Bar Charts
  • Circle Graphs
  • Column Charts
  • Combo Charts
  • Comparison Charts
  • Line Graphs
  • PPC Charts
  • Sentiment Analysis Charts
  • Survey Charts

TOP CHARTS

  • Sankey Diagram
  • Likert Scale Chart
  • Comparison Bar Chart
  • Pareto Chart
  • Funnel Chart
  • Gauge Chart
  • Radar Chart
  • Radial Bar Chart
  • Sunburst Chart
  • see more
  • Scatter Plot Chart
  • CSAT Survey Bar Chart
  • CSAT Survey Chart
  • Dot Plot Chart
  • Double Bar Graph
  • Matrix Chart
  • Multi Axis Line Chart
  • Overlapping Bar Chart
  • Control Chart
  • Slope Chart
  • Clustered Bar Chart
  • Clustered Column Chart
  • Box and Whisker Plot
  • Tornado Chart
  • Waterfall Chart
  • Word Cloud
  • see less

RESOURCES

  • Blog
  • Resources
  • YouTube
SIGN UP FOR UPDATES

We wouldn't dream of spamming you or selling your info.

© 2025 ChartExpo, all rights reserved.