Categories
Every new hire carries a price tag before day one. Cost Per Hire turns that price tag into a number you can track across roles and time. When you measure it, you see which parts of the recruiting drive spend and which parts deliver results.
That clarity helps HR and finance speak the same language. It also creates a baseline you can compare month to month and team to team.
In this guide, you will break costs into internal and external buckets, run a simple calculation, and review examples. You will also learn a spreadsheet workflow that highlights cost drivers without losing detail.
Definition: Cost Per Hire is the total recruiting spend required to add one employee. It rolls internal labor, recruiting tools, and third-party fees into one figure for a set period. Posting costs, assessment fees, and background checks often belong in the same bucket.
A cost per hire calculation does more than sum invoices. It sets clear rules for which expenses belong to recruiting and which do not, so teams compare results fairly. When you track the metric each period, you can compare roles, channels, and processes, and see whether the unit cost is moving up or down.
Hiring affects budgets and operations, not only headcount. Tracking this metric shows where money goes and where the process most needs change first.
Recruiting costs shift with role demands, tools, and market conditions.
Main drivers include these:
A standard equation keeps hiring cost reporting consistent across teams and time. It connects recruiting expenses to outcomes, so leaders can compare programs without guessing at scale.
Use this equation as your core metric today:
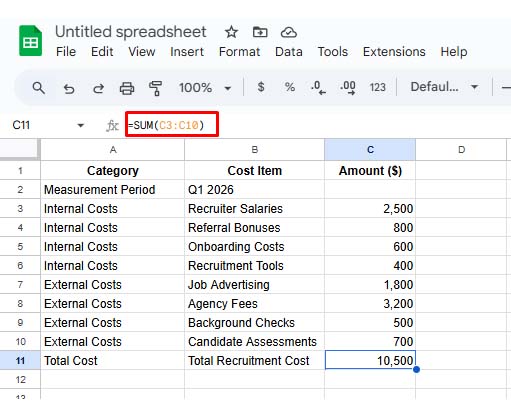
First total internal and external recruiting expense for the period. Then divide that sum by the number of people who accepted offers and started. The result is your per-hire cost for that window.
Follow a process so you capture all costs and avoid gaps. Each step narrows the data until you reach one number per hire.
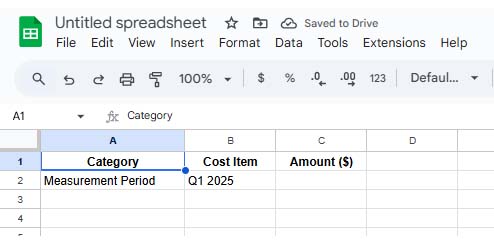
Pick a timeframe, such as a month or quarter, and use the window for costs and hires.
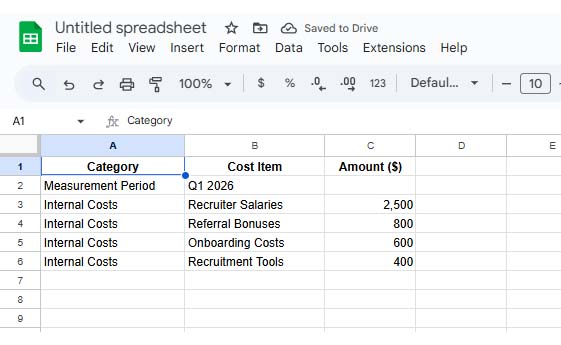
List in-house expenses, including recruiter pay, referral payouts, and the tools used to manage applicants.
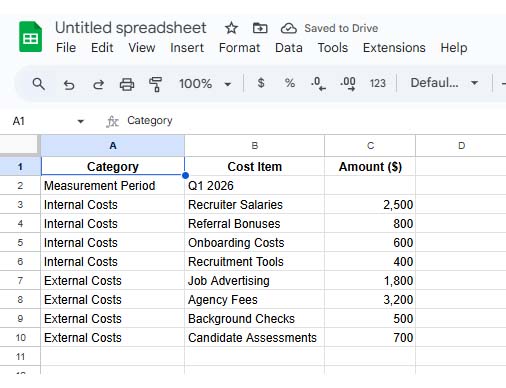
Record outside spending, such as ads, agency fees, assessments, and background checks for candidates.
Add internal and external totals together to get the full recruiting spend for the measurement period.
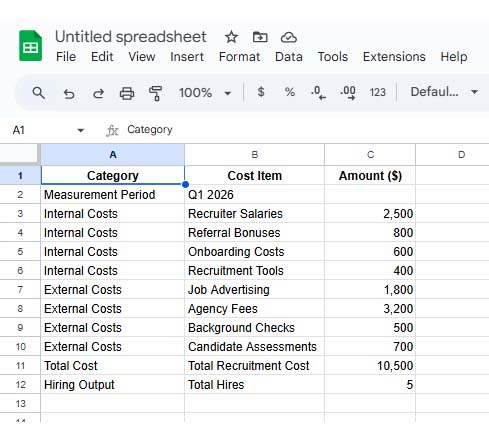
Count how many hires started during that timeframe and confirm dates.
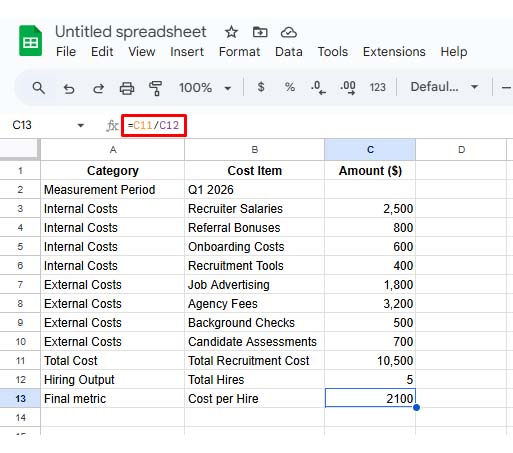
Divide total recruiting costs by hires to compute your final cost per person hired.
Examples make the metric easier to interpret across teams. The patterns usually reflect hiring models, not mistakes in context.
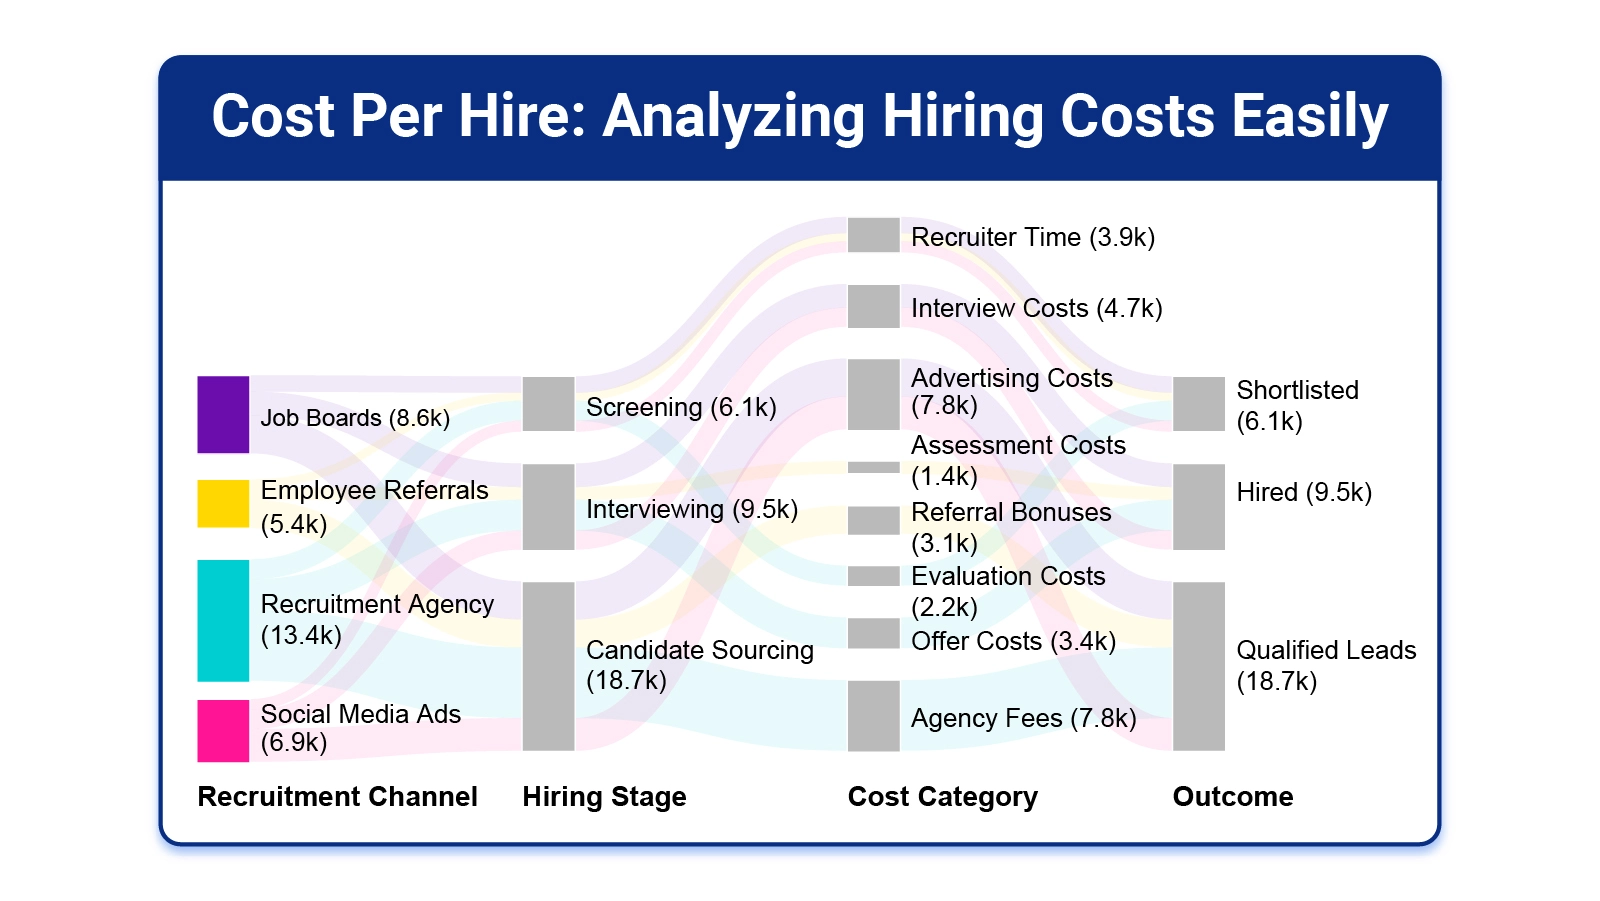
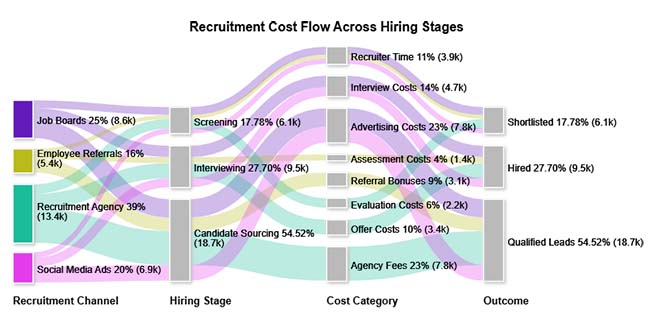
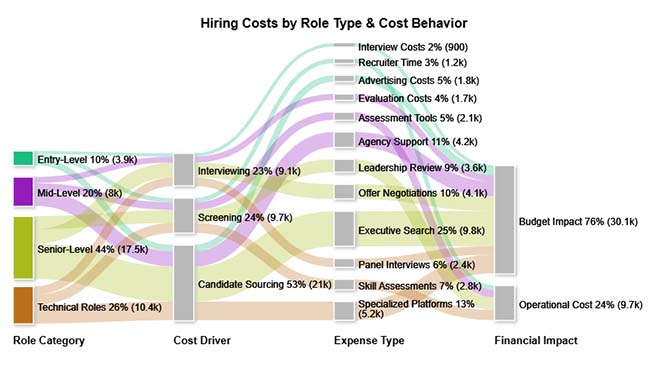
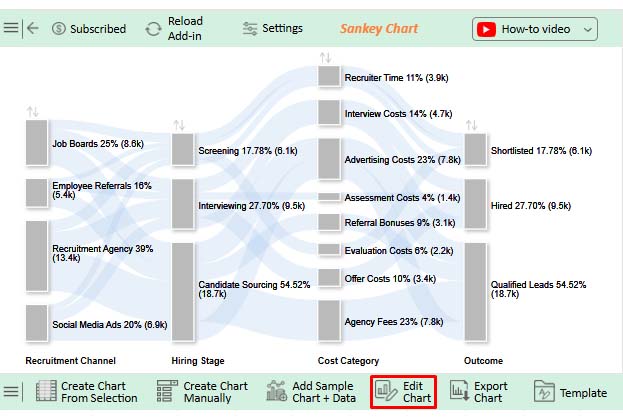
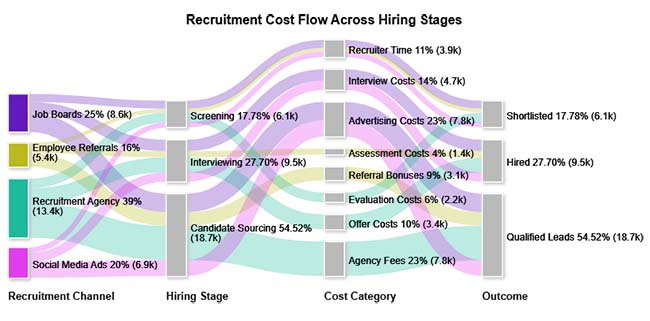
This view maps where recruiting dollars move across stages and sources, so you can see which channel dominates total spend.
This breakdown compares costs for role groups and highlights how senior or specialist searches raise sourcing and interview expenses. It also shows which channels create the largest share of hiring spend.
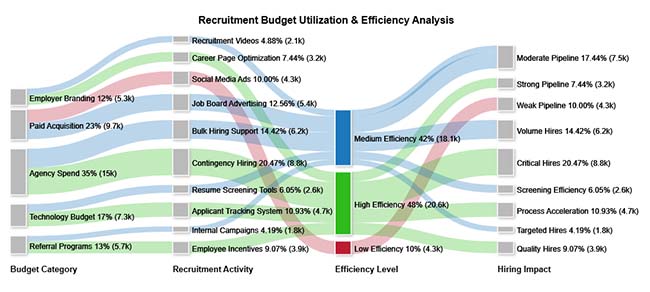
This analysis links budget allocation to results, showing which spending areas deliver hires and which drain funds without impact in your chosen period.
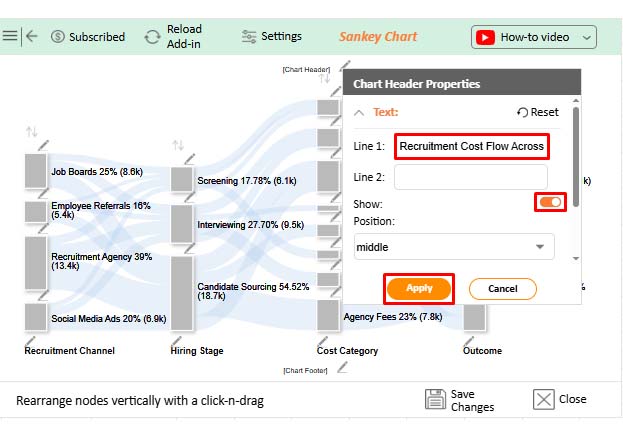
A cost per hire calculation in Excel helps turn raw recruiting expenses into a trackable metric. A layout makes trends easy to review and share.
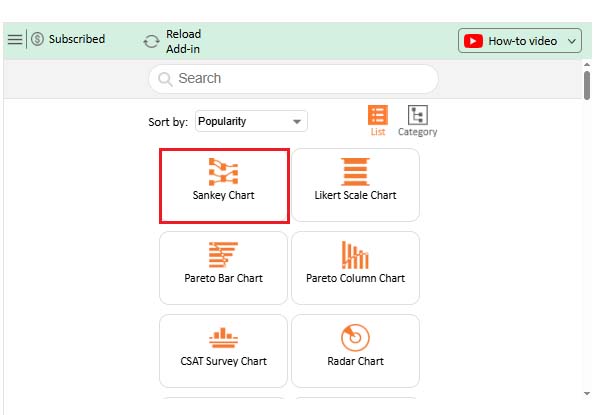
Why Use ChartExpo?
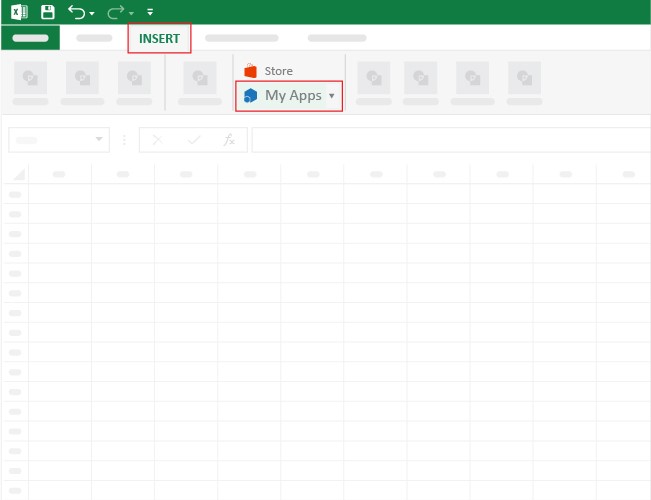
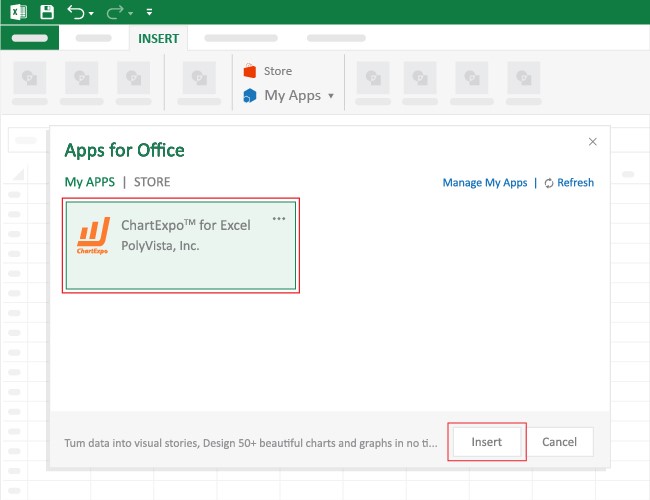
How to Install ChartExpo in Excel?
ChartExpo can be used with both Google Sheets and Microsoft Excel. Follow the CTAs to install your favorite tool and create a beautiful visualization with just a few clicks directly on your favorite platform.
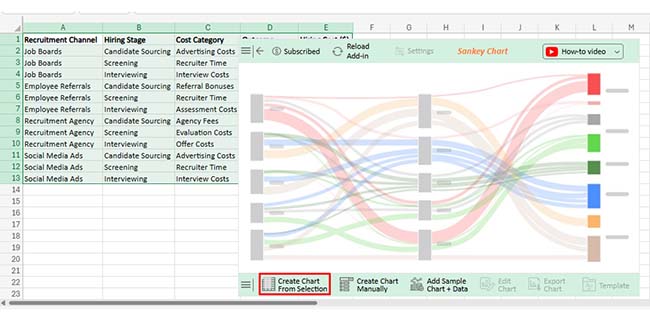
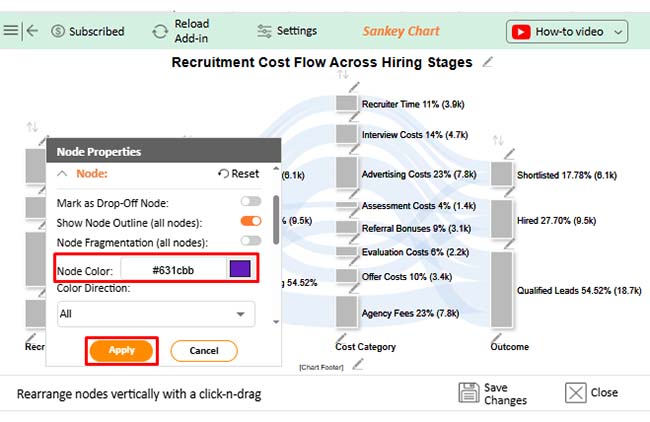
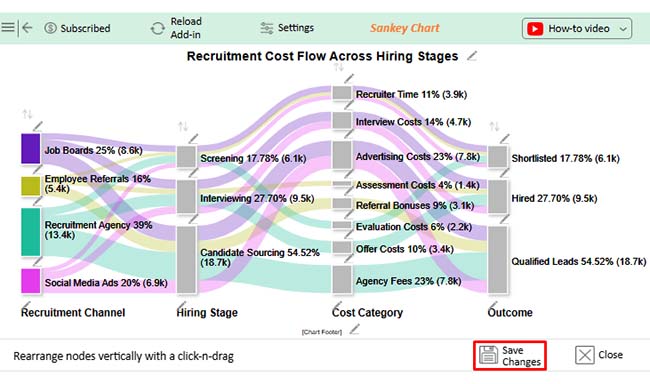
Consider we have the following data for a Sankey Chart.
|
Recruitment Channel |
Hiring Stage | Cost Category | Outcome |
Hiring Cost ($) |
| Job Boards | Candidate Sourcing | Advertising Costs | Qualified Leads | 4200 |
| Job Boards | Screening | Recruiter Time | Shortlisted | 1800 |
| Job Boards | Interviewing | Interview Costs | Hired | 2600 |
| Employee Referrals | Candidate Sourcing | Referral Bonuses | Qualified Leads | 3100 |
| Employee Referrals | Screening | Recruiter Time | Shortlisted | 900 |
| Employee Referrals | Interviewing | Assessment Costs | Hired | 1400 |
| Recruitment Agency | Candidate Sourcing | Agency Fees | Qualified Leads | 7800 |
| Recruitment Agency | Screening | Evaluation Costs | Shortlisted | 2200 |
| Recruitment Agency | Interviewing | Offer Costs | Hired | 3400 |
| Social Media Ads | Candidate Sourcing | Advertising Costs | Qualified Leads | 3600 |
| Social Media Ads | Screening | Recruiter Time | Shortlisted | 1200 |
| Social Media Ads | Interviewing | Interview Costs | Hired | 2100 |
Regular tracking keeps hiring budgets disciplined and ties recruiting choices to measurable cost outcomes for leadership.
Benefits include these:
Lowering hiring costs works best when you remove friction, not when you cut needed steps or quality.
Try these moves:
Add every recruiting expense for a set period, then divide by hires made in that same period. Keep internal and external costs defined the same way each time consistently.
Compare it across the same role type, department, or time window. Hold cost rules constant, because hiring volume and seniority can change the reference point materially.
Cut time between steps, boost referrals, and drop weak paid channels. Use templates and automation for scheduling, so recruiter hours fall each month.
Cost Per Hire becomes useful when everyone counts the same costs and measures the same time window. With clean inputs, you can explain where recruiting dollars go, compare channels, and plan headcount with fewer surprises. Use the formula, track components, and review results after each cycle.
Once you know the drivers, test targeted changes instead of broad cuts. Shift spend toward referrals, tighten screening, and shorten handoffs between reviewers. Automation for scheduling and updates can reduce recruiter hours. Recalculate monthly, share the trend with finance, and document what changed so the metric stays comparable across roles, quarters, and hiring campaigns.
How much did you enjoy this article?


Calculate accounts receivable turnover ratio to measure credit collection speed, improve cash flow, and strengthen your financial strategy. Read on!

Change Management KPIs are the key to tracking adoption, performance, and ROI during transitions. Find out which metrics matter. Read on!

Data collection methods and techniques determine the quality of every insight you act on. Explore key approaches for gathering reliable data. Read on!


