• Home
  • Tools dropdown img
    • Spreadsheet Charts

      • ChartExpo for Google Sheets
      • ChartExpo for Microsoft Excel
    • Power BI Charts

      • Power BI Custom Visuals by ChartExpo
    • Word Cloud

  • Charts dropdown img
    • Chart Category

      • Bar Charts
      • Circle Graphs
      • Column Charts
      • Combo Charts
      • Comparison Charts
      • Line Graphs
      • PPC Charts
      • Sentiment Analysis Charts
      • Survey Charts
    • Chart Type

      • Box and Whisker Plot
      • Clustered Bar Chart
      • Clustered Column Chart
      • Comparison Bar Chart
      • Control Chart
      • CSAT Survey Bar Chart
      • CSAT Survey Chart
      • Dot Plot Chart
      • Double Bar Graph
      • Funnel Chart
      • Gauge Chart
      • Likert Scale Chart
      • Matrix Chart
      • Multi Axis Line Chart
      • Overlapping Bar Chart
      • Pareto Chart
      • Radar Chart
      • Radial Bar Chart
      • Sankey Diagram
      • Scatter Plot Chart
      • Slope Chart
      • Sunburst Chart
      • Tornado Chart
      • Waterfall Chart
      • Word Cloud
    • Google Sheets
      Microsoft Excel
  • Services
  • Pricing
  • Contact us
  • Blog
  • Support dropdown img
      • Gallery
      • Videos
      • Contact us
      • FAQs
      • Resources
    • Please feel free to contact us

      atsupport@chartexpo.com

Categories
All Data Visualizations Data Analytics Surveys
Add-ons/
  • Google Sheets
  • Microsoft Excel
  • Power BI
All Data Visualizations Data Analytics Surveys
Add-ons
  • Google Sheets
  • Microsoft Excel
  • Power BI

We use cookies

This website uses cookies to provide better user experience and user's session management.
By continuing visiting this website you consent the use of these cookies.

Ok

ChartExpo Survey


Home > Blog > Data Analytics

Business Intelligence in Healthcare Industry: A Visual Approach

Who uses business intelligence in the healthcare industry? The answer might surprise you. From hospitals to insurance companies, data is shaping decisions every day.

Business Intelligence in Healthcare Industry

BI in healthcare turns raw data into real solutions. Healthcare analytics helps providers improve patient outcomes and operational efficiency. Hospital administrators use it to cut costs. Better data analysis helps reduce unnecessary tests, avoid duplicate procedures, and improve efficiency.

Pharmaceutical companies depend on it for drug development. Finding the proper treatment used to take years. Now, data-driven models can analyze millions of chemical compounds in days, speeding up research and bringing new medicines faster. Healthcare dashboard examples help visualize drug trial success rates and monitor side effects.

Insurance companies analyze patient trends to set fairer pricing. Fraud detection algorithms flag suspicious claims, preventing losses. BI for retail has transformed pricing strategies in commerce, and now, similar techniques help insurers optimize healthcare plans.

Even patients benefit. Wearable devices track heart rates, blood pressure, and oxygen levels. Intelligent analytics can warn you early of a potential health issue before it becomes acute.

Intelligence is not simply a tool for healthcare; it is revolutionizing how healthcare operates. From preserving lives to preserving costs, data-based decisions are shaping the future of medicine.

The question isn’t who uses it — who doesn’t?

Let’s find out…

Table of Contents:

  1. What is Healthcare Business Intelligence?
  2. Who Uses Business Intelligence in the Healthcare Industry?
  3. How Many Types of Healthcare Business Intelligence?
  4. What are the Healthcare BI Tools?
  5. What are Healthcare Business Intelligence Components?
  6. How to Visualize Healthcare Business Intelligence in Excel?
  7. What is the Use of Business Analytics in the Healthcare Industry?
  8. Use Cases of BI in the Healthcare Industry
  9. Benefits of Healthcare BI
  10. FAQs
  11. Wrap Up

What is Healthcare Business Intelligence?

Definition: Healthcare Business Intelligence turns data into actionable insights. It helps hospitals, clinics, and insurers make smarter decisions.

Patient records, treatment plans, and costs generate massive data. Without analysis, valuable patterns go unnoticed. BI tools organize, analyze, and visualize this information. They predict patient risks, reduce costs, and improve care quality.

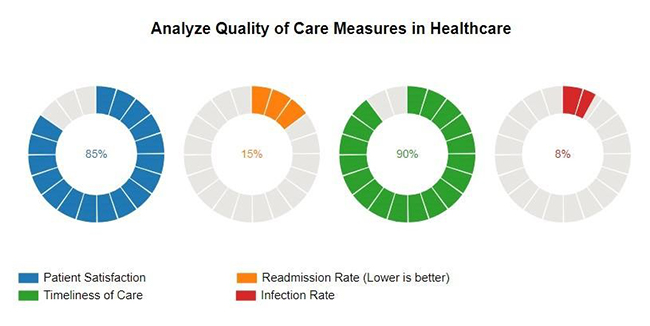
Hospitals use BI and KPIs to track performance and improve. Quality of care measures in healthcare help providers assess treatment effectiveness, patient satisfaction, and safety standards. With healthcare business intelligence, data drives better outcomes and improves efficiency and patient care.

Top 5 Charts in Excel using ChartExpo for Healthcare Business Intelligence

Multi-Axis Line Chart

Business Intelligence in Healthcare Industry

Progress Circle Chart

Business Intelligence in Healthcare Industry

Sankey Chart

Business Intelligence in Healthcare Industry

Likert Scale Chart

Business Intelligence in Healthcare Industry

Comparison Bar Chart

Business Intelligence in Healthcare Industry

Who Uses Business Intelligence in the Healthcare Industry?

Business Intelligence (BI) is transforming healthcare. It enhances decision-making, improves care, and reduces costs. Digital analytics helps track patient trends and optimize resources. But who benefits most?

  • Healthcare providers (hospitals & clinics): Doctors and nurses use BI to monitor patient outcomes, track treatment effectiveness, and adjust care plans in real-time. It also helps hospitals manage resources, reduce wait times, and improve efficiency.
  • Healthcare executives & decision-makers: Executives rely on BI to analyze performance, manage budgets, and identify growth opportunities. Data-driven insights support strategic decisions that improve patient care and financial health.
  • Insurance companies & payers: BI helps insurers detect fraud, assess risks, and improve claims processing. It also enables them to design more effective coverage plans by understanding patient behaviors and healthcare costs.
  • Pharmaceutical & research organizations: Pharma companies use BI to monitor clinical trials, predict drug demand, and accelerate development. Researchers can uncover patterns in data to discover new treatments and improve patient outcomes.
  • Government and regulatory bodies: Regulators utilize business intelligence (BI) to track public health trends, manage disease outbreaks, and allocate resources efficiently. Data insights help shape healthcare policies and improve population health.

How Many Types of Healthcare Business Intelligence?

Healthcare runs on data, but raw data alone isn’t enough. Business Intelligence (BI) turns that data into meaningful insights, helping healthcare professionals make smarter decisions. But not all BI is the same. Let’s explore the five main types of healthcare BI:

  1. Descriptive business intelligence: This analyzes past data to show trends and patterns. Hospitals use it to track admissions, treatment success rates, and financial performance over time.
  2. Diagnostic business intelligence: It explains why specific trends or issues occur. For example, if patient wait times increase, it identifies whether staff shortages or process inefficiencies are the cause.
  3. Predictive business intelligence: Predicts future events through historical patterns. It helps predict disease outbreaks, patient surges, and possible equipment failures.
  4. Prescriptive business intelligence: It predicts future outcomes and provides the best course of action. Hospitals use it to better staff their institutions, identify treatment plans, and cut costs.
  5. Real-time business intelligence: This type offers insights from live data. ER crews, ICU personnel, and hospital executives use it to check up on patient vitals, track resource availability, and emergency response.

What are the Healthcare BI Tools?

Healthcare runs on data, but raw numbers alone don’t save lives. That’s where Business Intelligence (BI) tools come in. They turn complex healthcare data into clear, actionable insights. From patient care to hospital management, the right tool makes all the difference.

Let’s check out the top players:

  1. Tableau: Tableau is the artist in business intelligence tools. It converts raw data into beautiful, interactive data visualizations. Hospitals use it to monitor patient trends, expand capacity, and inform decision-making — all in real-time.
  2. Power BI: Microsoft’s Power BI is a brainy all-rounder. It connects with many different data sources to analyze everything from one location and works seamlessly with other Microsoft tools.
  3. Qlik Sense: Require in-depth, AI-powered insights? Qlik Sense has you covered. It does particularly well at identifying patterns lurking in healthcare data, enabling you to anticipate patient needs and streamline operations.
  4. SAS Healthcare Analytics: SAS is built for serious healthcare analytics. It helps with everything from fraud detection to disease prediction. Large hospitals and research institutions love it for its powerful data-crunching abilities.
  5. Domo: Domo is the modern, cloud-based powerhouse. It offers real-time dashboards, making it easy for healthcare professionals to track key metrics and improve efficiency on the go.

What are Healthcare Business Intelligence Components?

Business intelligence combines everything to turn raw data into meaningful insights. Visual Analytics helps transform complex information into clear, actionable reports. This process relies on several key components, each vital to making healthcare brighter, faster, and safer:

  • Data sources: Hospitals, clinics, insurers, and research labs generate endless data. Patient records, lab results, financial transactions, and wearable device data feed into business intelligence systems.
  • Data warehousing: Data warehousing involves integrating healthcare data in a single location. It integrates information from various sources to make analysis relatively easy and quick.
  • Data integration & ETL (Extract, Transform, Load): The ETL process extracts raw data from different sources, cleanses it, and stores it in a structured format. It enables healthcare professionals to  rely on accurate, updated information.
  • Data analytics and AI: Advanced analytics and AI provide risk and pattern detection and enhance decision-making. AI is used in hospitals to spot illnesses early on, lower readmission rates, and tailor treatments.
  • Dashboards & visualization tools: Dashboards turn complex data into clear, interactive charts and graphs. Doctors, administrators, and policymakers use them to track trends and make quick decisions.
  • Security & compliance: Healthcare data must be protected. Strict security measures and compliance with laws like HIPAA ensure patient privacy and prevent breaches.

How to Visualize Healthcare Business Intelligence in Excel?

Data is everywhere in healthcare. But raw numbers don’t improve patient care or cut costs—brilliant insights do. That’s where Business Intelligence (BI) comes in. Hospitals, insurers, and researchers use it to turn complex data into clear decisions.

But analyzing data isn’t enough; seeing it matters too. Data visualization tools make trends evident and insights actionable. Excel tries, but it wasn’t built for deep, interactive visuals.

That’s where ChartExpo steps in. It transforms boring spreadsheets into insightful, easy-to-read charts, helping healthcare professionals make better, faster decisions.

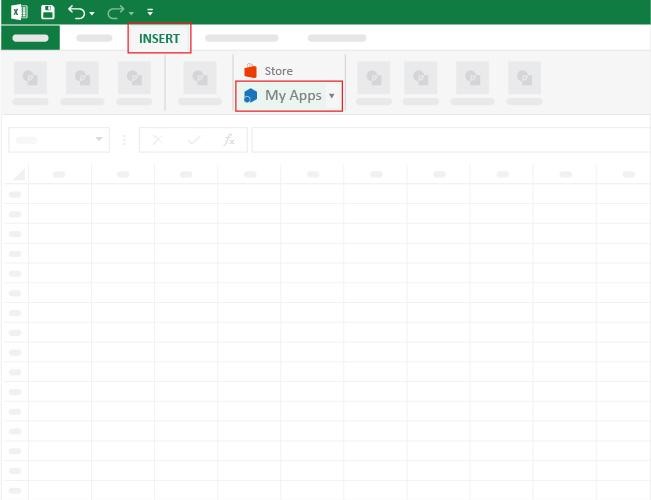
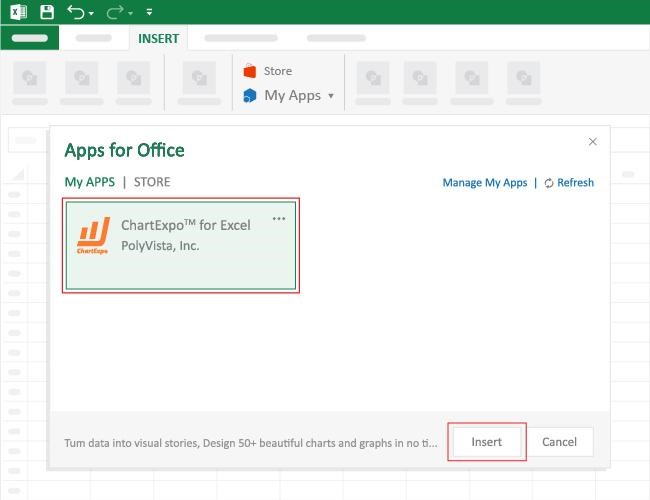
How to Install ChartExpo in Excel?

  1. Open your Excel application.
  2. Open the worksheet and click the “Insert” menu.
  3. You’ll see the “My Apps” option.
  4. In the Office Add-ins window, click “Store” and search for ChartExpo on the My Apps Store.
  5. Click the “Add” button to install ChartExpo in your Excel.

ChartExpo charts are available both in Google Sheets and Microsoft Excel. Please use the following CTAs to install the tool of your choice and create beautiful visualizations with a few clicks in your favorite tool.

Example

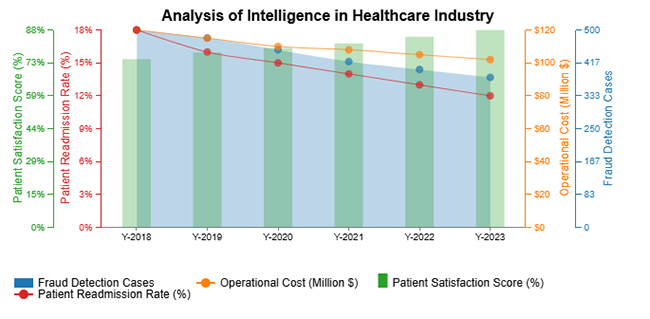
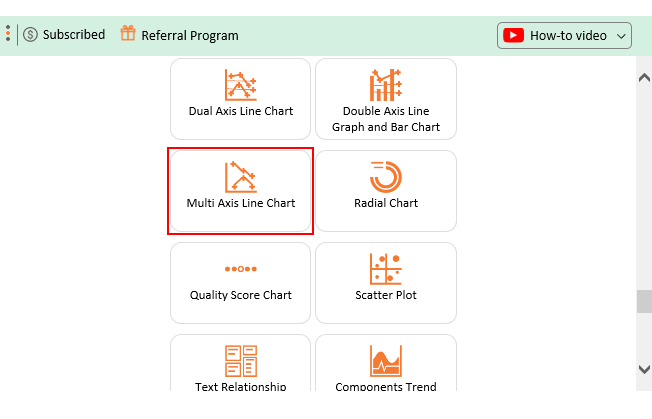
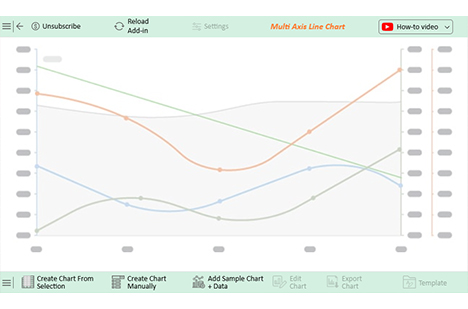
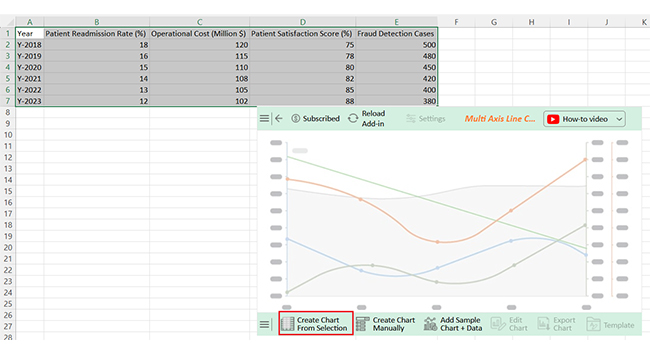
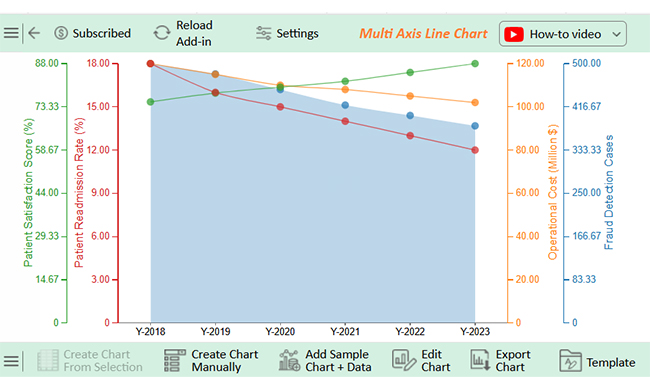
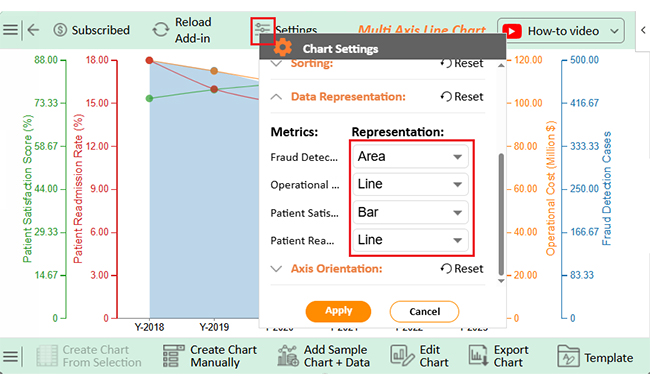
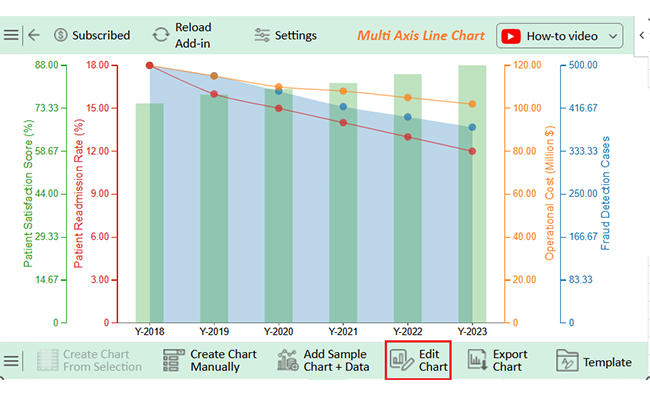
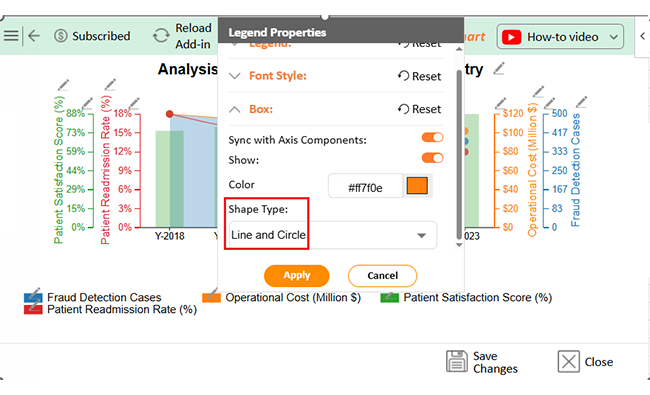
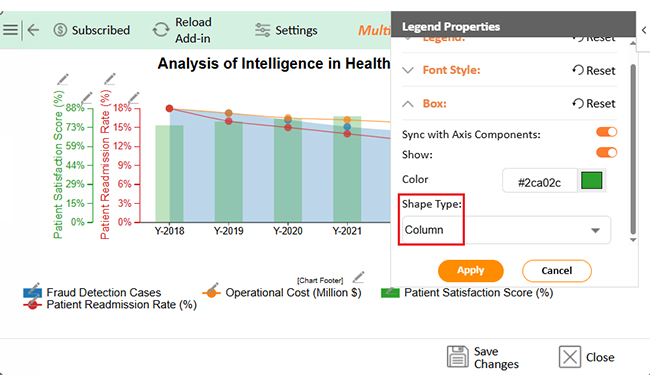
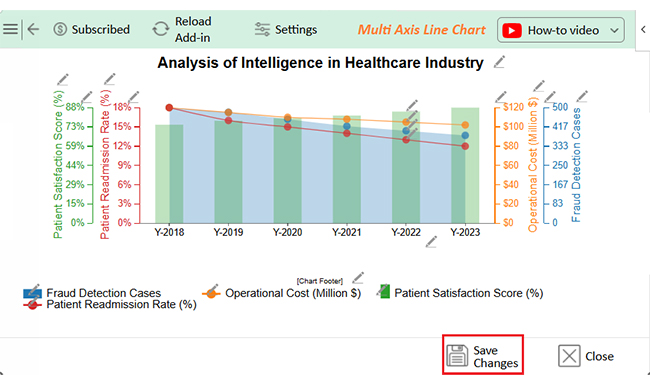
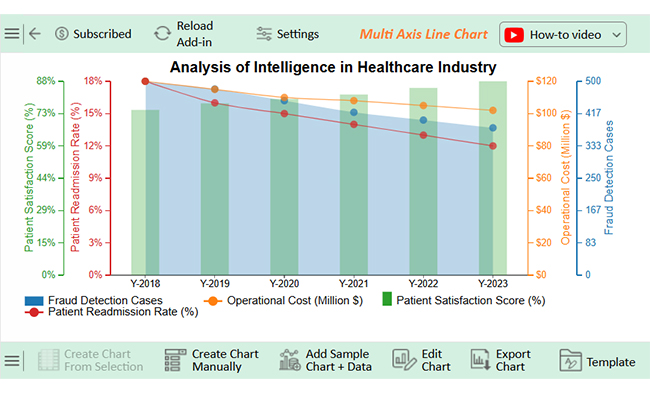
Let’s analyze this sample data in Excel using ChartExpo.
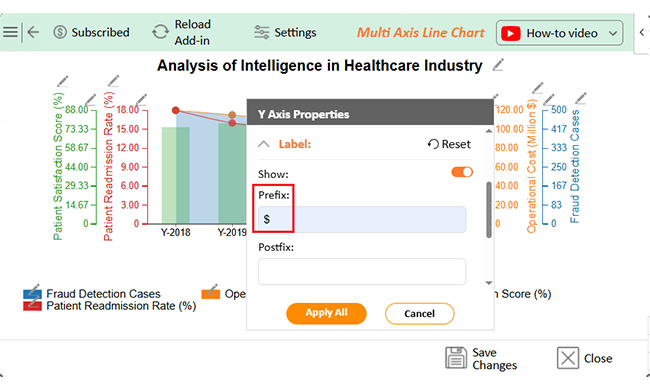
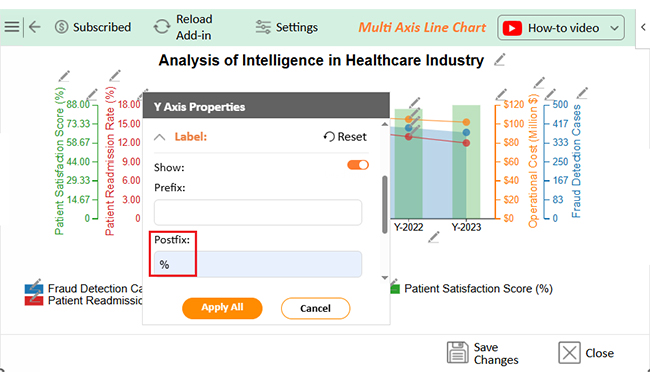
Year Patient Readmission Rate (%) Operational Cost (Million $) Patient Satisfaction Score (%) Fraud Detection Cases
Y-2018 18 120 75 500
Y-2019 16 115 78 480
Y-2020 15 110 80 450
Y-2021 14 108 82 420
Y-2022 13 105 85 400
Y-2023 12 102 88 380
  • To get started with ChartExpo, install ChartExpo in Excel.
  • Now, click on My Apps from the INSERT menu.
Business Intelligence in Healthcare Industry
  • Choose ChartExpo from My Apps, then click Insert.
Business Intelligence in Healthcare Industry
  • Once it loads, scroll through the charts list to locate and choose the “Multi Axis Line Chart”.
Business Intelligence in Healthcare Industry
  • You will see a Multi-Axis Line Chart on the screen.
Business Intelligence in Healthcare Industry
  • Click the “Create Chart From Selection” button after selecting the data from the sheet, as shown.
Business Intelligence in Healthcare Industry
  • ChartExpo will generate the visualization below for you.
Business Intelligence in Healthcare Industry
  • Click on Settings and change the “Data Representation” as follows.
Business Intelligence in Healthcare Industry
  • If you want to add anything to the chart, click the Edit Chart button:
Business Intelligence in Healthcare Industry
  • Click the pencil icon next to the Chart Header to change the title.
  • It will open the properties dialog. Under the Text section, you can add a heading in Line 1 and enable Show.
  • Give the appropriate title of your chart and click the Apply button.
Business Intelligence in Healthcare Industry
  • You can change the value of Fraud Detection Cases Precision to zero as follows:
Business Intelligence in Healthcare Industry
  • You can add the dollar sign with Operational Cost and change the precision value to zero as follows:
Business Intelligence in Healthcare Industry
  • You can add the percentage sign with Patient Readmission Rate and Patient Satisfaction Score, and also change the precision value to zero as follows:
Business Intelligence in Healthcare Industry
  • Change the Legend shape of Patient Readmission Rate and Operational Cost into Line and Circle, and click the “Apply” button:
Business Intelligence in Healthcare Industry
  • Change the Legend shape of Patient Satisfaction Score into Column and click the “Apply” button:
Business Intelligence in Healthcare Industry
  • Click the “Save Changes” button to persist the changes made to the chart.
Business Intelligence in Healthcare Industry
  • Your final Multi Axis Line Chart will look like the one below.
Business Intelligence in Healthcare Industry

Insights

  • Patient readmission rates drop from 18% to 12%
  • Operational costs decrease from $120M to $102M
  • Patient satisfaction rises from 75% to 88%
  • Fraud cases reduced from 500 to 380

What is the Use of Business Analytics in the Healthcare Industry?

Data analytics, Machine Learning, and Artificial Intelligence are transforming the future of healthcare. Business analytics enables hospitals, insurers, and researchers to translate raw data into concrete advances. Here’s how they are making a difference:

  • Better patient care & outcomes: Predictive analytics enables doctors to look for risks before they become serious. Artificial intelligence-powered tools can help spot diseases early, tailor treatments, and cut readmissions to the hospital.
  • Operational efficiency: Analytics help hospitals manage staff, minimize waiting times, and optimize resource allocation. Real-time data enables administrators to manage bottlenecks and enhance patient flow.
  • Fraud detection & compliance: Fraud costs the healthcare industry billions every year. Analytics tools detect unusual billing patterns, helping insurers and hospitals prevent fraud and comply with regulations.
  • Financial & cost management: Analytics tracks hospital expenses, reduces waste, and identifies cost-saving opportunities. More brilliant budgeting leads to better resource distribution and lower patient healthcare costs.
  • Population health management: Data analytics helps identify public health trends and predict disease outbreaks. Governments and healthcare providers use these insights to effectively improve community health and allocate resources.

Use Cases of BI in the Healthcare Industry

Business Intelligence (BI) reshapes healthcare by turning complex data into clear insights. Business analytics enhances this process by identifying patterns, predicting risks, and optimizing operations. It’s helping doctors, hospitals, and researchers make smarter decisions and improve patient outcomes.

Here are the potent ways BI is making a difference:

  • Patient care & disease prevention: BI analyzes health patterns to help personalize treatment plans and improve patient care. Predictive analytics also identifies disease risks early, allowing for quicker interventions.
  • Hospital operations & resource management: Hospitals use BI to manage staff, reduce wait times, and improve resource allocation. Real-time insights help streamline operations and enhance patient flow.
  • Financial performance & cost management: BI tracks revenue cycles, reduces billing errors, and improves financial forecasting. It helps healthcare providers cut costs while maintaining high-quality care.
  • Population health & risk management: BI identifies health trends across communities, helping providers target preventive care. It also supports regulatory compliance and reduces legal risks.
  • Clinical research & drug development: Researchers use BI to monitor clinical trials and analyze treatment effectiveness. Faster insights lead to quicker drug development and better patient outcomes.

Benefits of Healthcare BI

Correct data at the right time can save lives, cut costs, and improve efficiency. Business Intelligence (BI) turns massive amounts of healthcare data into clear, actionable insights. Here’s how it benefits the industry:

  • Improved patient care: BI supports doctors in following patient history, preventing risks, and improving treatment plans. Data-driven decisions enable quicker diagnoses and improved health outcomes.
  • Improved operational efficiency: Hospitals use BI to optimize staff schedules, manage resources, and reduce wait times. As a result, intelligent analytics help simplify workflows, improving services for patients and staff.
  • Real-time decision-making: Dashboards update in real-time to show patient status, hospital capacity, and medical supply levels. Quick access to data helps healthcare teams respond faster in critical situations.
  • Cost reduction & financial optimization: BI identifies unnecessary expenses, tracks billing accuracy, and improves budgeting. Hospitals and insurers use it to cut waste and lower healthcare costs.
  • Compliance & risk management: Strict regulations require accurate data tracking and reporting. BI ensures healthcare providers follow laws like HIPAA, reducing legal risks and protecting patient privacy.
  • Fraud detection & prevention: Healthcare fraud leads to significant losses yearly. BI tools analyze billing patterns, detect anomalies, and flag potential fraud before it escalates.

FAQs

What are the five tenets of Healthcare Business Intelligence?

  1. Data collection: Gather patient records, financial data, and operational metrics.
  2. Data integration: Combine information from multiple sources for accuracy.
  3. Data analysis: Identify patterns, risks, and opportunities.
  4. Visualization & reporting: Present insights through dashboards and charts.
  5. Security & compliance: Protect patient data and follow regulations.

What is Healthcare commercial intelligence?

Healthcare commercial intelligence analyzes market trends, competition, and financial performance. It turns complex data into actionable insights. Hospitals, pharmaceutical companies, and insurers use it to improve strategy, identify opportunities, and boost revenue.

Wrap Up

What is business intelligence? It’s a game-changer in healthcare. BI helps providers, insurers, and researchers make smarter decisions. Data-driven insights improve care, cut costs, and enhance efficiency.

Hospitals and clinics rely on BI to track patient outcomes. Healthcare data visualization makes trends clear and actionable. It reduces wait times and improves resource management. Better data leads to better treatments.

Executives and decision-makers use BI for financial planning. BI reporting helps control budgets, reduce waste, and monitor key performance metrics. Real-time analytics improve hospital performance.

Insurers depend on BI to detect fraud and assess risks. It streamlines claims processing and improves pricing accuracy. Smarter data means fairer policies.

Pharmaceutical companies and researchers use BI for drug development. It speeds up clinical trials and monitors treatment effectiveness. AI-driven insights bring better medicines to market.

Government agencies use BI to track public health trends. This helps prevent outbreaks and improve healthcare policies.

Finally, start using ChartExpo for Excel today to analyze healthcare data and shape a safer, healthier future.

How much did you enjoy this article?

GSAd1
Start Free Trial!
150834

Related articles

next previous
Data Analytics10 min read

Analytics in Telecom Industry for Better Insights

Analytics in the telecom industry optimizes networks, enhances customer experience, and detect fraud. Learn its key benefits, challenges, and use cases.

Data Analytics7 min read

Financial Forecasting for Startups: A Complete Guide

This guide dives deep into financial forecasting for startups. You'll also discover elements of a financial projection for a startup, and tips for creating one.

Data Analytics32 min read

Data Reporting: Making Your Reports Irresistible

Data reporting turns numbers into insights that guide decisions. Learn how to simplify complex data and make confident choices. Read on for key strategies!

Data Analytics10 min read

Employee Performance KPIs: Insights That Drive Action

Employee performance KPIs track productivity and success. Learn the key metrics, measurement methods, and analysis techniques to boost performance.

Data Analytics27 min read

Prescriptive Analytics: From Forecasts to Fixes

Prescriptive analytics helps you turn data into action. Learn how it improves decision-making, drives results, and supports smarter strategies. Get started!

ChartExpo logo

Turn Data into Visual
Stories

CHARTEXPO

  • Home
  • Gallery
  • Videos
  • Services
  • Pricing
  • Contact us
  • FAQs
  • Privacy policy
  • Terms of Service
  • Sitemap

TOOLS

  • ChartExpo for Google Sheets
  • ChartExpo for Microsoft Excel
  • Power BI Custom Visuals by ChartExpo
  • Word Cloud

CATEGORIES

  • Bar Charts
  • Circle Graphs
  • Column Charts
  • Combo Charts
  • Comparison Charts
  • Line Graphs
  • PPC Charts
  • Sentiment Analysis Charts
  • Survey Charts

TOP CHARTS

  • Sankey Diagram
  • Likert Scale Chart
  • Comparison Bar Chart
  • Pareto Chart
  • Funnel Chart
  • Gauge Chart
  • Radar Chart
  • Radial Bar Chart
  • Sunburst Chart
  • see more
  • Scatter Plot Chart
  • CSAT Survey Bar Chart
  • CSAT Survey Chart
  • Dot Plot Chart
  • Double Bar Graph
  • Matrix Chart
  • Multi Axis Line Chart
  • Overlapping Bar Chart
  • Control Chart
  • Slope Chart
  • Clustered Bar Chart
  • Clustered Column Chart
  • Box and Whisker Plot
  • Tornado Chart
  • Waterfall Chart
  • Word Cloud
  • see less

RESOURCES

  • Blog
  • Resources
  • YouTube
SIGN UP FOR UPDATES

We wouldn't dream of spamming you or selling your info.

© 2025 ChartExpo, all rights reserved.