Categories
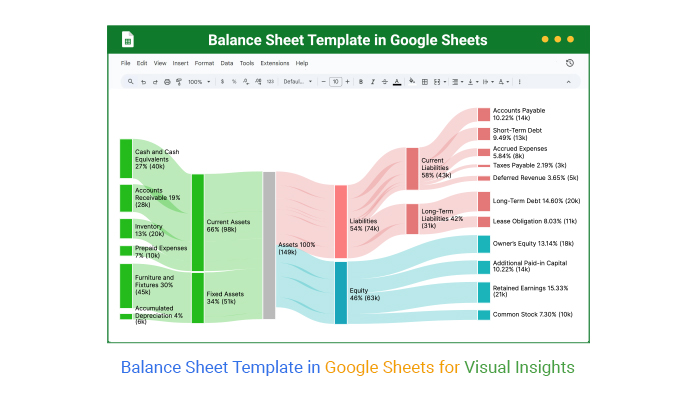
What is a balance sheet template in Google Sheets? Businesses, freelancers, and financial planners use them to track assets, liabilities, and equity.
Google Sheets stands out with its cloud-based accessibility. There is no expensive software or complicated installations. A balance sheet template in Google Sheets simplifies financial management with built-in formulas and automation.


Manually updating numbers can lead to errors. A simple miscalculation can throw off an entire financial report. Automating calculations reduces human error and saves time.
Collaboration matters. Financial teams need instant access to the latest figures. Google Sheets allows multiple users to work simultaneously, ensuring accuracy and transparency.
Growth requires insight. Comparing past and present data helps businesses prepare for the future. With Google Sheets functionality, financial trends become easy to analyze. A well-structured template turns raw data into actionable insights.
Success depends on informed decisions, and a clear balance sheet ensures financial stability and growth. Are you ready to streamline your financial tracking?
Let’s explore how to create and use the balance sheet template.
Definition: A balance sheet template in Google Sheets is a pre-designed spreadsheet for tracking assets, liabilities, and equity. It helps businesses manage finances efficiently. This template updates calculations automatically, and you can customize it based on your needs.
With Google Sheets functionality, data stays organized and accessible. Features like IMPORTRANGE in Google Sheets allow real-time data syncing.
Cloud-based access makes collaboration easy, and financial trends become clearer with built-in charts. That’s the power of a robust balance sheet template. It simplifies and supports financial analysis, enabling better decision-making.
A Google Sheets balance sheet template makes managing assets, liabilities, and equity easier. It provides real-time insights, automation, and collaboration, all in one place.
Here’s why it’s essential:
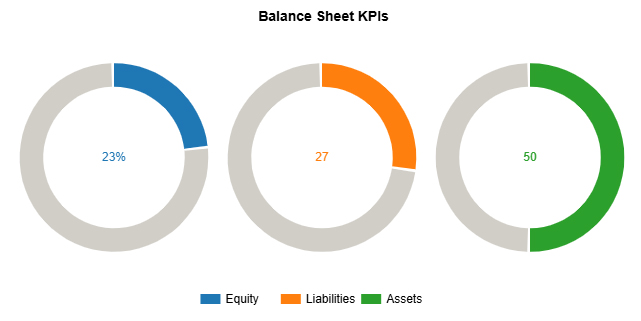
Think of a balance sheet as your business’s snapshot. It shows what you own, what you owe, and what’s left for the owners. And yes, you can easily build one in Google Sheets. You can track your finances like a pro with just a few formulas and a clean layout. But first, let’s break down the three significant parts that make up every balance sheet:
Assets are everything your business owns. This includes cash, inventory, equipment, accounts receivable—anything of value. In Google Sheets, you can list them in one section and total them using the =SUM function. Don’t forget to split them into current and non-current assets. That makes analysis easier.
These are your obligations—money you owe to suppliers, loan payments, or taxes due. Like assets, liabilities are usually divided into current (due within a year) and long-term (due after a year). A simple table with due dates and amounts helps you keep track of Sheets.
Equity is the difference between what you own and what you owe. It reflects the owner’s share of the business. Common entries include retained earnings and capital invested. In Sheets, you can calculate equity with this formula:
=Total Assets – Total Liabilities
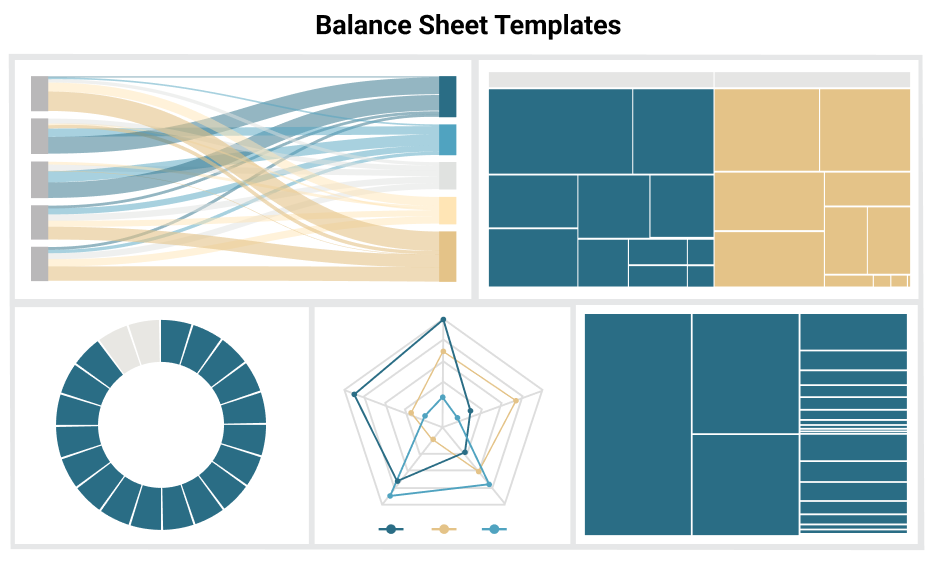
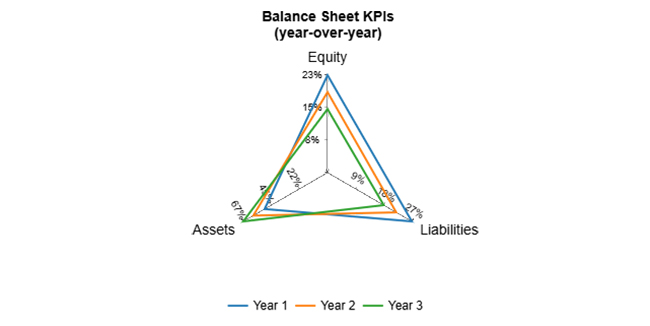
Below are the top five charts for a balance sheet template in Google Sheets using ChartExpo:
A balance sheet in Google Sheets helps track assets, liabilities, and equity in an organized way. Businesses can make smarter financial decisions with built-in tools such as what-if analysis in Google Sheets. Follow these steps to set up your balance sheet:
A structured balance sheet makes managing finances easier. A simple balance sheet template in Google Sheets helps track assets, liabilities, and equity without the hassle of manual calculations. Here’s how to use a balance sheet template effectively.
Have you ever tried creating a balance sheet in Google Sheets and thought, “This could be more visual!”? A balance sheet can be a sea of numbers. Sometimes, you need more than rows and columns to make sense of it all.
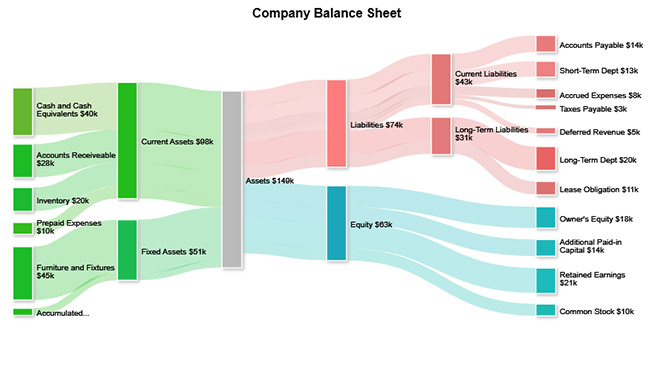
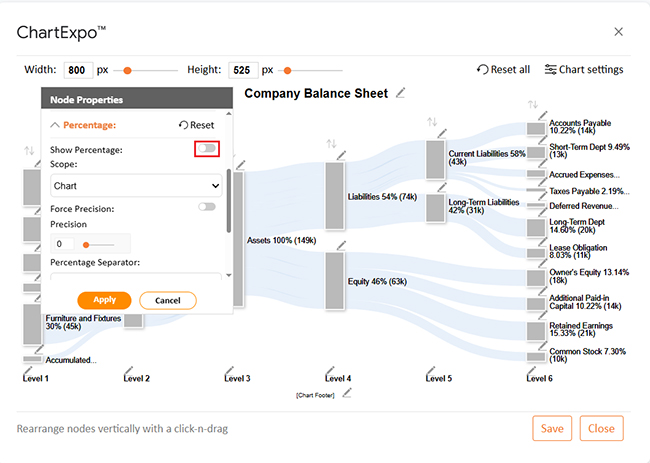
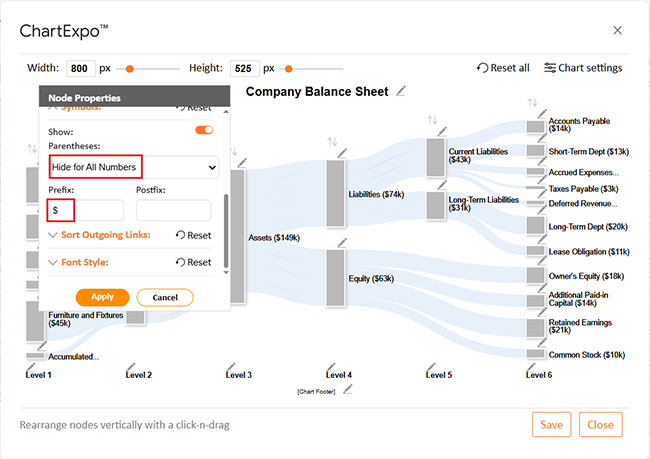
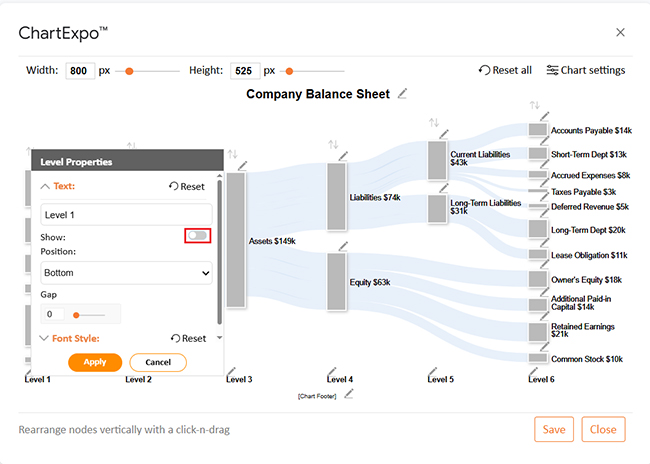
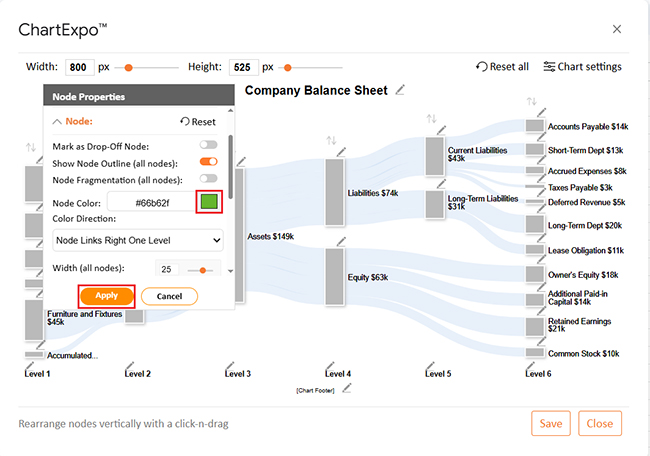
Google Sheets often falls short in data visualization, and that’s where ChartExpo comes in. It transforms your balance sheet template in Google Sheets into easy-to-understand, insightful charts, including Sankey diagram options. This tool bridges the gap, helping you manage your data and make it more digestible.
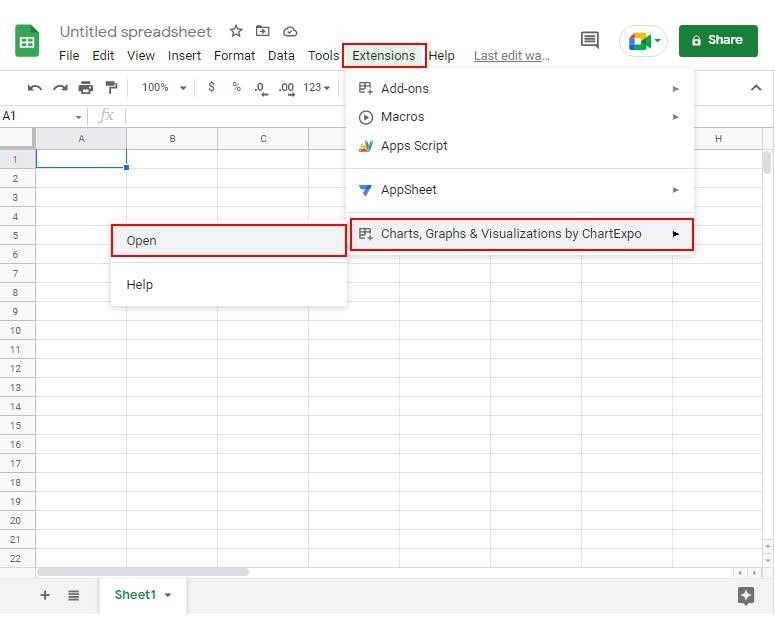
How to Install ChartExpo in Google Sheets?
ChartExpo charts are available both in Google Sheets and Microsoft Excel. Please use the following CTAs to install the tool of your choice and create beautiful visualizations in a few clicks in your favorite tool.
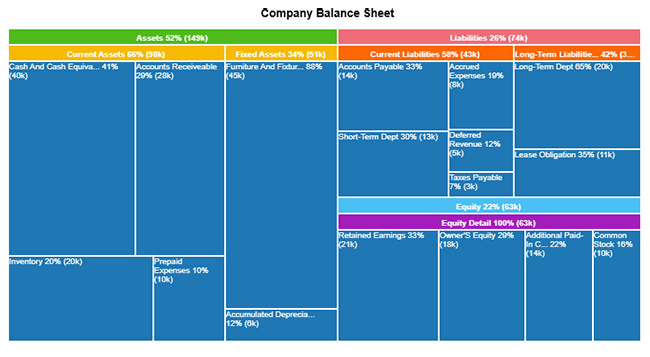
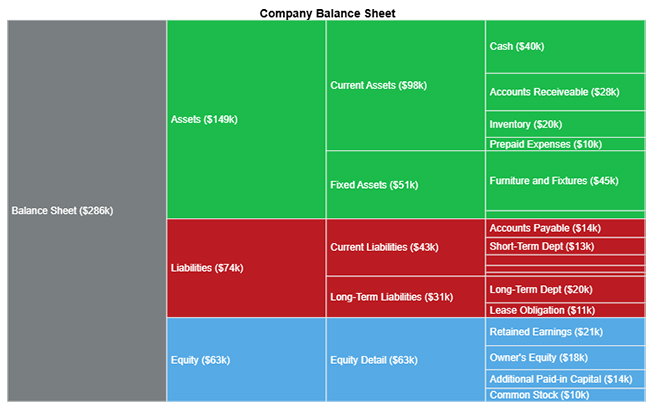
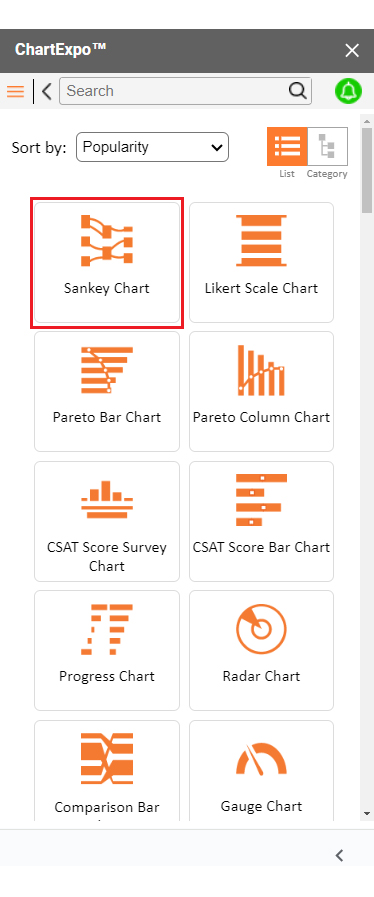
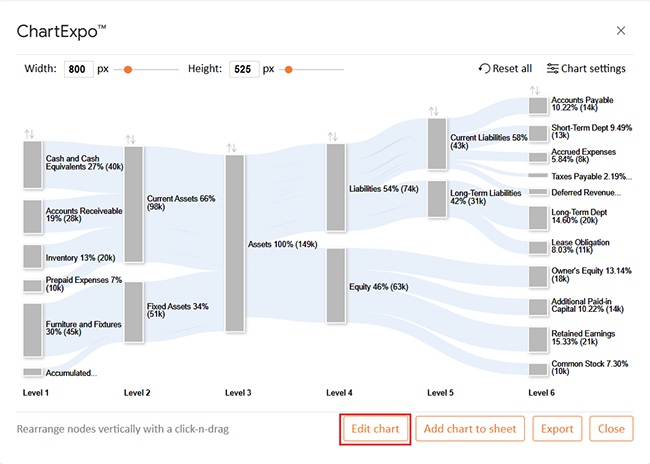
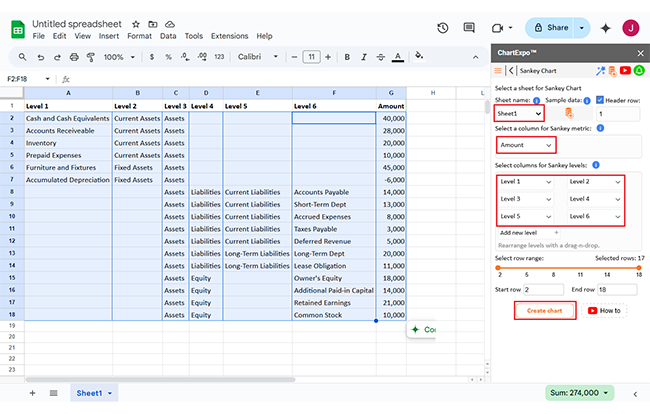
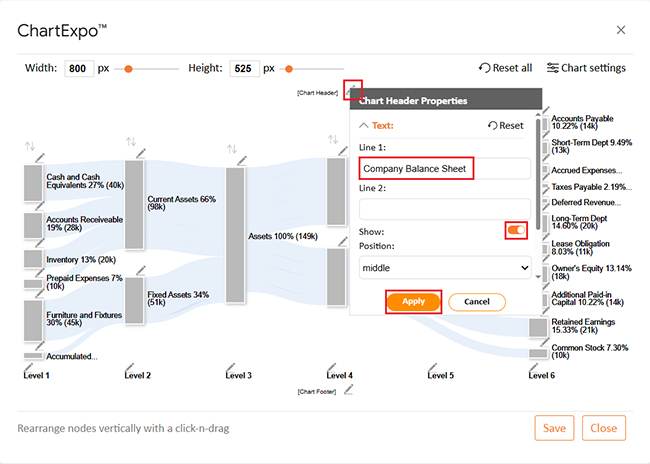
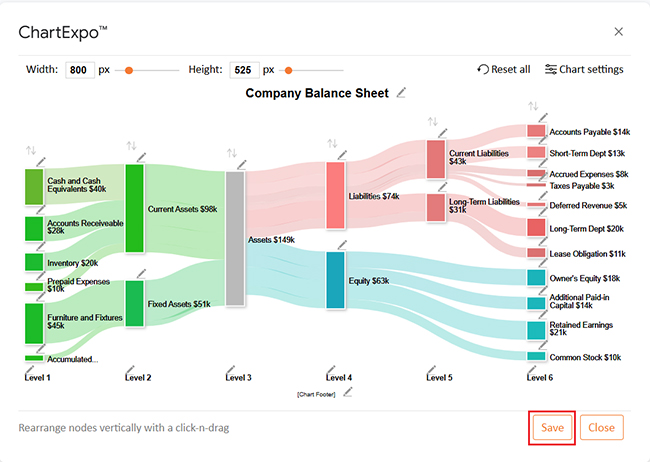
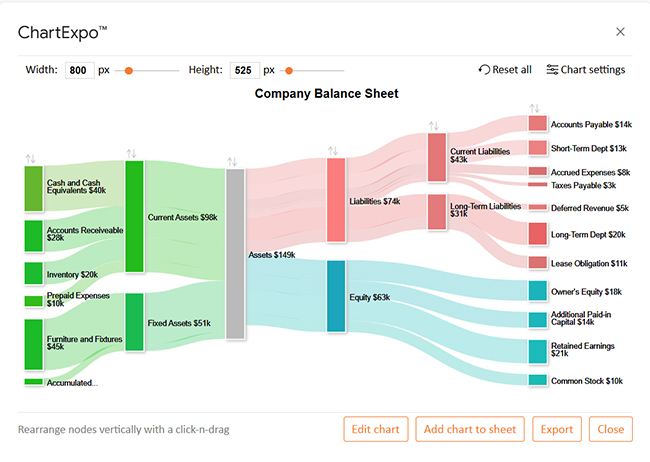
Let’s learn how to create a Sankey diagram in Google Sheets and analyze the sample data below in Google Sheets using ChartExpo.
| Level 1 | Level 2 | Level 3 | Level 4 | Level 5 | Level 6 | Amount |
| Cash and Cash Equivalents | Current Assets | Assets | 40,000 | |||
| Accounts Receivable | Current Assets | Assets | 28,000 | |||
| Inventory | Current Assets | Assets | 20,000 | |||
| Prepaid Expenses | Current Assets | Assets | 10,000 | |||
| Furniture and Fixtures | Fixed Assets | Assets | 45,000 | |||
| Accumulated Depreciation | Fixed Assets | Assets | -6,000 | |||
| Assets | Liabilities | Current Liabilities | Accounts Payable | 14,000 | ||
| Assets | Liabilities | Current Liabilities | Short-Term Debt | 13,000 | ||
| Assets | Liabilities | Current Liabilities | Accrued Expenses | 8,000 | ||
| Assets | Liabilities | Current Liabilities | Taxes Payable | 3,000 | ||
| Assets | Liabilities | Current Liabilities | Deferred Revenue | 5,000 | ||
| Assets | Liabilities | Long-Term Liabilities | Long-Term Debt | 20,000 | ||
| Assets | Liabilities | Long-Term Liabilities | Lease Obligation | 11,000 | ||
| Assets | Equity | Owner’s Equity | 18,000 | |||
| Assets | Equity | Additional Paid-in Capital | 14,000 | |||
| Assets | Equity | Retained Earnings | 21,000 | |||
| Assets | Equity | Common Stock | 10,000 |
Using a personal balance sheet template in Google Sheets helps you stay organized and manage your finances more effectively. Here are the top benefits:
Quickly list what you own and what you owe, giving you a real-time picture of your financial position.
By comparing assets with debts, you can plan savings, investments, and debt repayments more confidently.
Since it’s in Google Sheets, you can access and update your balance sheet anytime from your phone, tablet, or computer.
Personalize the template to include categories like loans, property, investments, or emergency funds.
Combine the template with tools like ChartExpo to turn raw numbers into easy-to-read charts, making financial analysis simple.
Regularly enter new transactions and adjust values so your sheet always reflects your current financial situation.
Organize assets, liabilities, and equity into simple, well-labeled sections for easy readability.
Use formulas like SUM, =IF, or =ARRAYFORMULA to automate calculations and reduce manual errors.
Use the same date formats, currency symbols, and number styles across the sheet to maintain accuracy and clarity.
Enhance your balance sheet by using Google Sheets charts or tools like ChartExpo to turn numbers into easy-to-understand visuals.
One of the most common mistakes is placing assets under liabilities or vice versa. Always separate them clearly to avoid misrepresenting your financial position.
A balance sheet quickly becomes outdated if you don’t update it. Make it a habit to refresh your entries—weekly or monthly—so it reflects your true financial health.
Using different date styles, currency symbols, or labels can lead to calculation errors. Keep formatting uniform across all rows and columns for accuracy.
Remember that Assets = Liabilities + Equity. If the totals don’t match, there’s likely an error in data entry or categorization that needs fixing.
Yes, Google Sheets offers a balance sheet template, which is available in the template gallery. It includes sections for assets, liabilities, and equity, and you can customize it to fit your needs. This template simplifies financial tracking and analysis.
Yes, Google Sheets offers free accounting templates that you can use to track income, expenses, and overall financial health. These templates are available in Google Sheets’ template gallery or from third-party sources. They typically include:
A balance sheet template in Google Sheets helps businesses track financial health. It organizes assets, liabilities, and equity in a clear format. With real-time updates, decision-making becomes easier and more accurate.
Automation improves efficiency. Using IMPORTRANGE in Google Sheets, you can pull financial data from multiple sources. Moreover, VLOOKUP for Google Sheets helps locate specific figures instantly. These features reduce manual work and errors.
Customization makes financial tracking more effective, and Google Sheets Extensions enhance functionality with advanced tools. Furthermore, you can apply the What If Analysis in Google Sheets to predict financial outcomes based on different scenarios.
Data visualization simplifies analysis. A well-structured template turns raw numbers into actionable insights. Therefore, learning how to create a Chart in Google Sheets will help you identify trends more efficiently.
Budgeting is essential. With a Budget on Google Sheets, expenses and revenues remain organized. The Google Sheets Progress Bar visually tracks financial goals, ensuring better planning.
A well-managed balance sheet supports financial stability. With Google Sheets Functionality, businesses gain flexibility, accuracy, and collaboration. Smart tools and automation make financial management seamless.
Do not hesitate.
Install ChartExpo and transform numbers into clear, insightful charts to enhance data visualization.
How much did you enjoy this article?


SUMPRODUCT in Google Sheets handles multi-condition calculations without extra columns. Master its syntax, uses, and errors. Read on!

An annual budget template in Google Sheets organizes your yearly finances, tracks every dollar, and reveals spending patterns. Read on!

Learn the best graph to show profit and loss with practical examples and use cases. Discover how to visualize your business data, track trends, and make smarter financial decisions.


