• Home
  • Tools dropdown img
    • Spreadsheet Charts

      • ChartExpo for Google Sheets
      • ChartExpo for Microsoft Excel
    • Power BI Charts

      • Power BI Custom Visuals by ChartExpo
    • Word Cloud

  • Charts dropdown img
    • Chart Category

      • Bar Charts
      • Circle Graphs
      • Column Charts
      • Combo Charts
      • Comparison Charts
      • Line Graphs
      • PPC Charts
      • Sentiment Analysis Charts
      • Survey Charts
    • Chart Type

      • Box and Whisker Plot
      • Clustered Bar Chart
      • Clustered Column Chart
      • Comparison Bar Chart
      • Control Chart
      • CSAT Survey Bar Chart
      • CSAT Survey Chart
      • Dot Plot Chart
      • Double Bar Graph
      • Funnel Chart
      • Gauge Chart
      • Likert Scale Chart
      • Matrix Chart
      • Multi Axis Line Chart
      • Overlapping Bar Chart
      • Pareto Chart
      • Radar Chart
      • Radial Bar Chart
      • Sankey Diagram
      • Scatter Plot Chart
      • Slope Chart
      • Sunburst Chart
      • Tornado Chart
      • Waterfall Chart
      • Word Cloud
    • Google Sheets
      Microsoft Excel
  • Services
  • Pricing
  • Contact us
  • Blog
  • Support dropdown img
      • Gallery
      • Videos
      • Contact us
      • FAQs
      • Resources
    • Please feel free to contact us

      atsupport@chartexpo.com

Categories
All Data Visualizations Data Analytics Surveys
Add-ons/
  • Google Sheets
  • Microsoft Excel
  • Power BI
All Data Visualizations Data Analytics Surveys
Add-ons
  • Google Sheets
  • Microsoft Excel
  • Power BI

We use cookies

This website uses cookies to provide better user experience and user's session management.
By continuing visiting this website you consent the use of these cookies.

Ok

ChartExpo Survey


Home > Blog > Google Sheets

IMPORTRANGE in Google Sheets Tips for Better Usage

What is IMPORTRANGE in Google Sheets, and why do so many users rely on it?

Imagine you’re managing multiple spreadsheets, each brimming with data. Sales figures, budgets, inventory—all stored in separate files. Keeping track feels overwhelming, doesn’t it?

Enter IMPORTRANGE.

IMPORTRANGE in Google Sheets is a game-changer for anyone working with scattered data. It allows you to pull information from one spreadsheet into another effortlessly. Think about the hours spent manually copying and pasting. Or worse, the errors that creep in when data isn’t synced. With this tool, those worries fade.

IMPORTRANGE in Google Sheets

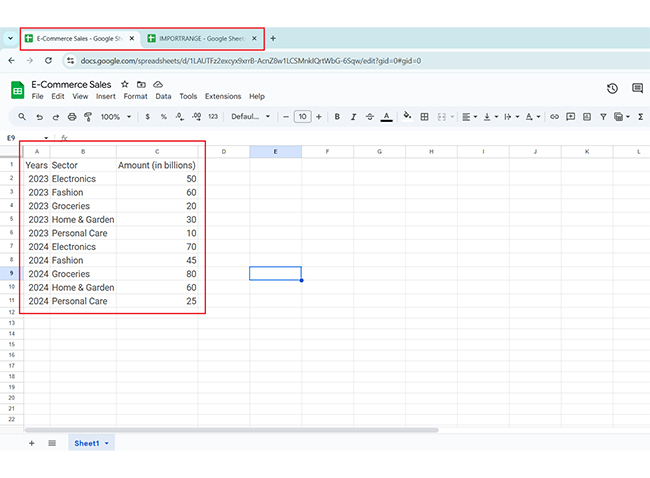
Here’s a real-world example: A small business managing orders across three regional teams streamlined its operations using IMPORTRANGE. Sales numbers from each team fed directly into a master sheet, improving accuracy and boosting productivity.

The power lies in simplicity. You use a single formula, grant permission, and watch data flow seamlessly. Whether it’s monthly reports, shared budgets, or cross-department projects, IMPORTRANGE handles the heavy lifting.

Businesses are not the only ones benefiting. Students and researchers use it to combine survey responses or track collaborative projects. The formula brings flexibility, and that’s priceless in a world where efficiency matters.

Here, we’ll explore how IMPORTRANGE works and how to make the most of it. Whether you’re a data expert or a spreadsheet newbie, this feature has something to offer.

Let’s get started.

Table of Contents:

  1. What is IMPORTRANGE in Google Sheets?
  2. Why Use Google Spreadsheets IMPORTRANGE?
  3. What are the Steps to Use IMPORTRANGE in Google Sheets?
  4. What are the Important Google Sheets Functions to Use Alongside IMPORTRANGE?
  5. How to IMPORTRANGE with Conditions in Google Sheets?
  6. How to Create a Chart Using IMPORTRANGE in Google Sheets?
  7. Wrap Up

First…

What is IMPORTRANGE in Google Sheets?

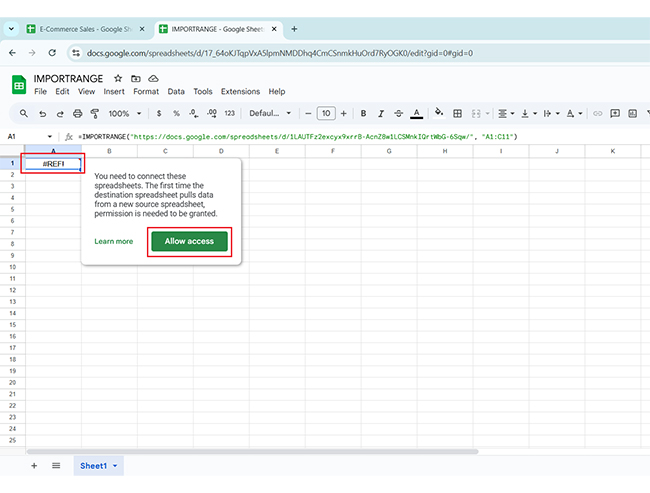
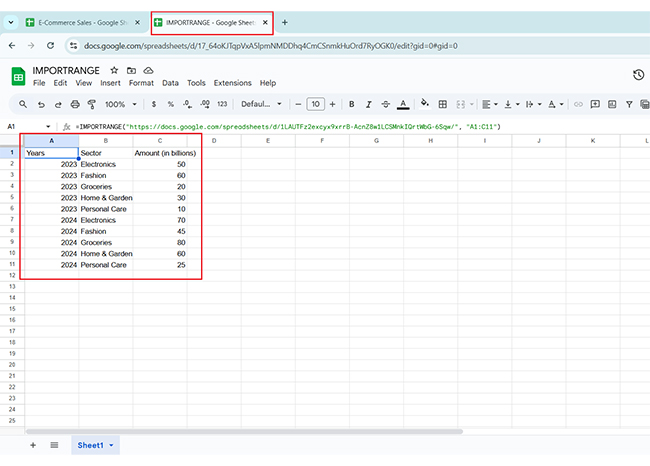
Definition: IMPORTRANGE in Google Sheets is a powerful function. It lets you pull data from one spreadsheet into another. This eliminates manual copying and ensures accurate updates.

Here’s the IMPORTRANGE formula in Google Sheets syntax: IMPORTRANGE(spreadsheet_url, range_string)

Whether tracking budgets or combining data reports, IMPORTRANGE keeps your data synced. You only need a formula and access to the source sheet. It’s widely used for collaboration and organizing scattered information.

Why Use Google Spreadsheets IMPORTRANGE?

Why should you use Google Spreadsheets’ IMPORTRANGE? Imagine juggling multiple spreadsheets for a single project—it’s frustrating and leads to information overload. Information is scattered everywhere, updates are missed, and errors multiply. IMPORTRANGE changes the game.

How?

  • Centralized data collection: Stop hopping between files. IMPORTRANGE pulls all your data into one sheet—efficient and satisfying.
  • Real-time data updates: Forget manually refreshing or copying information. With IMPORTRANGE, changes update instantly, so your data is always fresh, like your morning coffee.
  • Enhanced collaboration: Do you need to share specific information without overwhelming your team? This tool makes collaboration seamless. Everyone gets the data they need—no more, no less.
  • Simplified reporting: Say goodbye to clunky manual reports. IMPORTRANGE automates data integration, making report creation a breeze. You focus on insights, not inputs.
  • Data security and access control: Are you worried about security? IMPORTRANGE respects sheet permissions. You control who sees and edits, keeping sensitive info safe and sound.

What are the Steps to Use IMPORTRANGE in Google Sheets?

Here’s a step-by-step guide to mastering Google Sheets IMPORTRANGE and importing data like a pro:

  1. First, organize your data in one Google Sheet. Then, open another Google Sheet where you want to bring this data in.
Open Another Google Sheets for Learning IMPORTRANGE in Google Sheets
  1. Go to the original sheet containing the data and copy its URL from the address bar. This URL is your golden ticket to importing data.
Copy Old Sheet URL from Address Bar for Learning IMPORTRANGE in Google Sheets
  1. Apply the IMPORTRANGE formula. In the second sheet, type in the formula:
    • =IMPORTRANGE(“URL”, “SheetName!Range”) 
    • Replace “URL” with the link you just copied and “SheetName!Range” with the specific range of data you want (e.g., Sheet1!A1:D10).
Apply IMPORTRANGE Formula for Learning IMPORTRANGE in Google Sheets
  1. After hitting enter, a small box will pop up asking you to allow access. Click “Allow”—this is what connects the two sheets.
Click Allow Button for Learning IMPORTRANGE in Google Sheets
  1. Watch your data magically appear in the second sheet. It’s like teleportation, but for spreadsheets.
Data Appear in Second Sheet for Learning IMPORTRANGE in Google Sheets

What are the Important Google Sheets Functions to Use Alongside IMPORTRANGE?

IMPORTRANGE is fantastic, but pairing it with other Google Sheets functions? That’s where the magic happens. Let’s meet the MVPs you’ll want to use alongside IMPORTRANGE:

  1. FILTER: Want specific data from your imported range? FILTER is your go-to. It lets you pull out rows or columns that meet certain criteria.
  2. QUERY: Combine IMPORTRANGE with QUERY for ultimate control. You can filter, sort, or group data with SQL-style commands.
  3. ARRAYFORMULA: Tired of dragging formulas down a column? ARRAYFORMULA automates that for you. When paired with IMPORTRANGE, it lets you apply calculations to imported ranges in one go.
  4. VLOOKUP / HLOOKUP: HLOOKUP and VLOOKUP for Google Sheets are like data detectives. They scan your imported range and fetch the exact info you need, no questions asked.
  5. IFERROR: Let’s face it, errors happen. But IFERROR keeps things clean. Use it with IMPORTRANGE to hide those annoying error messages and show a custom message or blank cell instead.
  6. UNIQUE: Want to find duplicates in your imported data? UNIQUE highlights what stands out, helping you remove duplicates in Google Sheets. It’s great for cleaning up messy datasets or summarizing information.
  7. SPLIT: Got combined data in one cell? SPLIT breaks it apart. When working with imported data, this function is a lifesaver for separating names, dates, or anything else crammed together.

How to IMPORTRANGE with Conditions in Google Sheets?

Adding conditions to Google spreadsheets IMPORTRANGE takes it from simple to sophisticated. Try these combos to filter, query, or evaluate imported data with ease:

  1. Using IMPORTRANGE with FILTER: Want only the rows that meet specific criteria? Combine IMPORTRANGE and FILTER like this:
    • =FILTER(IMPORTRANGE(“URL”, “SheetName!Range”), Condition) 
    • Replace “URL” with the source sheet link, “SheetName!Range” with the data range, and Condition with your rule. It’s like a data sieve—only the good stuff gets through.
  1. Using IMPORTRANGE with QUERY: Need advanced filtering or sorting? QUERY + IMPORTRANGE is your best friend. Here’s the formula:
    • =QUERY(IMPORTRANGE(“URL”, “SheetName!Range”), “SELECT Col1, Col2 WHERE Col3 > 100”, 1) 
    • This lets you use SQL-style commands to fetch exactly what you need. It’s perfect for pulling insights from massive datasets without breaking a sweat.
  1. Using IMPORTRANGE with ARRAYFORMULA and IF: Want conditional logic across a range? Pair IMPORTRANGE with ARRAYFORMULA and IF like this:
    • =ARRAYFORMULA(IF(IMPORTRANGE(“URL”, “SheetName!Range”) > 50, “Yes”, “No”)) 
    • This checks each value in the imported range. If a value meets your condition, it returns “Yes”. If not, it returns “No”. It’s like giving your data an automatic grader.

How to Create a Chart Using IMPORTRANGE in Google Sheets?

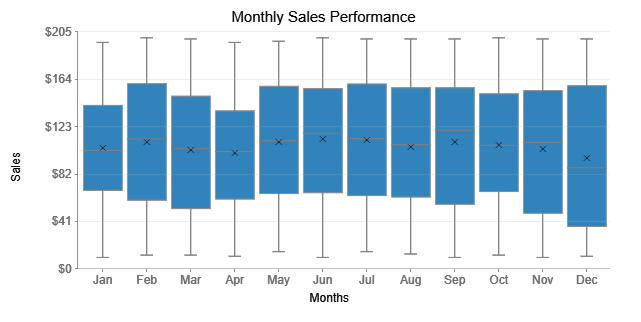
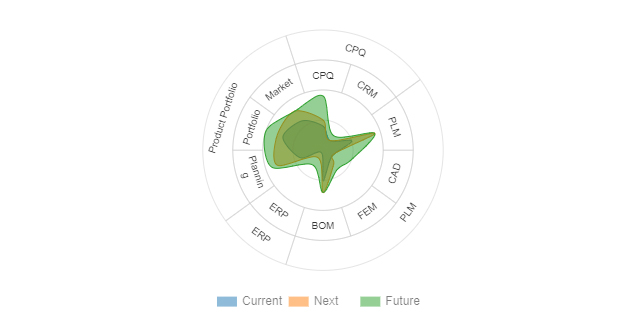
Data without visuals is like a story without pictures—hard to follow and easy to forget. Data visualization is the key to uncovering insights and trends.

While Google Sheets is a classic tool, it often struggles with advanced visuals, leaving your charts looking flat.

Enter ChartExpo—a powerful add-on for Google Sheets that transforms raw data into insightful, interactive charts and graphs. And when you combine it with IMPORTRANGE, you can create dynamic visuals that pull data from multiple sheets in real time.

Let’s see how to make it happen!

But first…

Top 10 charts

Box and Whisker Column Chart

Box and Whisker Column Chart After Learning IMPORTRANGE in Google Sheets

Circular Org Chart

Circular Org Chart After Learning IMPORTRANGE in Google Sheets

Heatmap

Heatmap After Learning IMPORTRANGE in Google Sheets

Likert Scale Chart

Likert Scale Chart After Learning IMPORTRANGE in Google Sheets

Progress Circle Chart

Progress Circle Chart After Learning IMPORTRANGE in Google Sheets

Multi Axis Line Chart

Multi Axis Line Chart After Learning IMPORTRANGE in Google Sheets

Gauge Chart

Gauge Chart After Learning IMPORTRANGE in Google Sheets

Sankey Chart

Sankey Chart After Learning IMPORTRANGE in Google Sheets

Scatter Plot

Scatter Plot After Learning IMPORTRANGE in Google Sheets

Slope Chart

Slope Chart After Learning IMPORTRANGE in Google Sheets

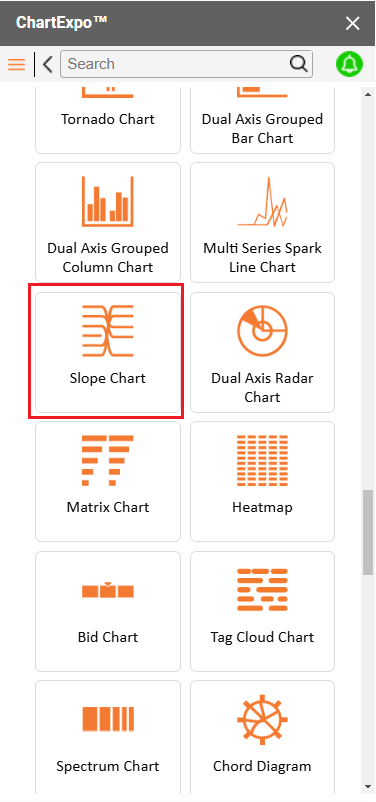
Let’s learn how to install ChartExpo in Google Sheets.

  1. To start using ChartExpo, download it directly from the Google Sheets program. To do this, select Extensions from the top toolbar.
  2. A menu will appear. Click the Get add-ons option.
  3. Search for ChartExpo, and click on Charts, Graphs & Visualizations by ChartExpo when it appears in the results.
  4. Click the Install button. You will have to confirm your Google account and accept some permissions.

ChartExpo charts are available both in Google Sheets and Microsoft Excel. Please use the following CTAs to install the tool of your choice and create beautiful visualizations in a few clicks in your favorite tool.

Google Sheets IMPORTRANGE Example

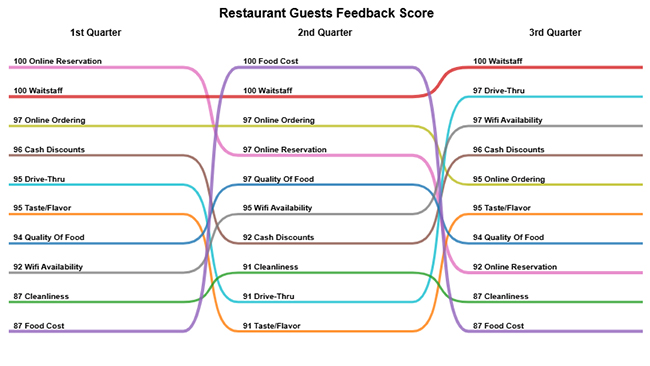
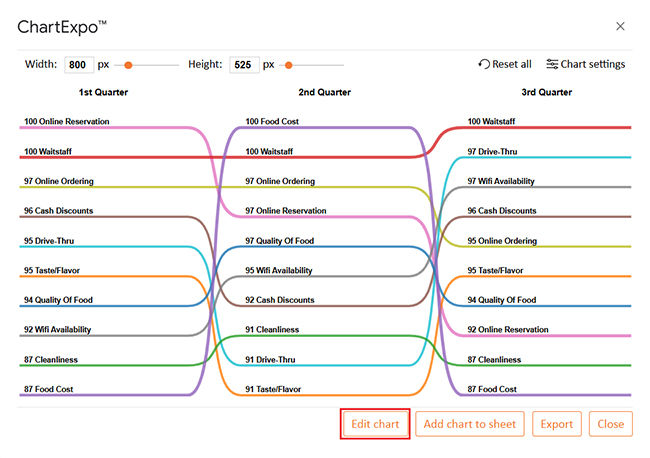
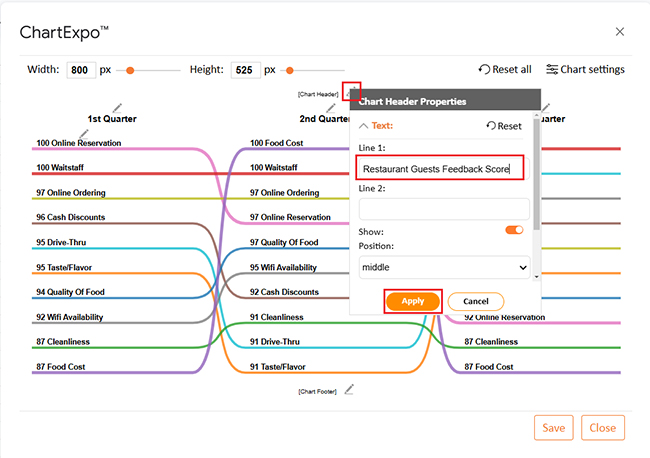
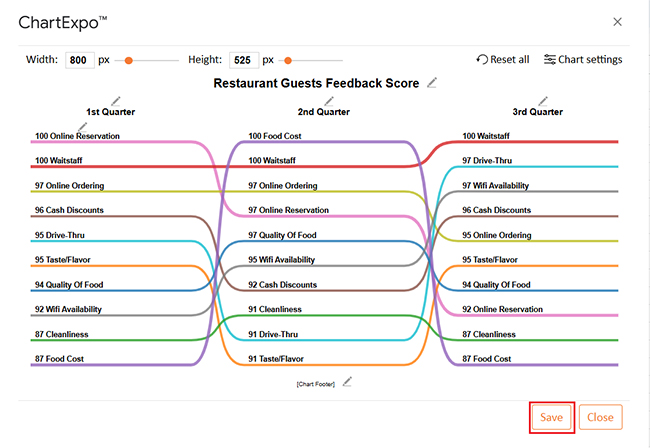
Let’s create a chart from the data below and glean valuable insights using ChartExpo.

Quarter Category Score
1st Quarter Quality of Food 94
1st Quarter Taste/Flavor 95
1st Quarter Cleanliness 87
1st Quarter Waitstaff 100
1st Quarter Food Cost 87
1st Quarter Cash Discounts 96
1st Quarter Online Reservation 100
1st Quarter WiFi Availability 92
1st Quarter Online Ordering 97
1st Quarter Drive-thru 95
2nd Quarter Quality of Food 97
2nd Quarter Taste/Flavor 91
2nd Quarter Cleanliness 91
2nd Quarter Waitstaff 100
2nd Quarter Food Cost 100
2nd Quarter Cash Discounts 92
2nd Quarter Online Reservation 97
2nd Quarter WiFi Availability 95
2nd Quarter Online Ordering 97
2nd Quarter Drive-thru 91
3rd Quarter Quality of Food 94
3rd Quarter Taste/Flavor 95
3rd Quarter Cleanliness 87
3rd Quarter Waitstaff 100
3rd Quarter Food Cost 87
3rd Quarter Cash Discounts 96
3rd Quarter Online Reservation 92
3rd Quarter WiFi Availability 97
3rd Quarter Online Ordering 95
3rd Quarter Drive-thru 97
  • To get started with ChartExpo, install ChartExpo in Google Sheets.
  • Go to Extensions > Charts, Graphs & Visualizations by ChartExpo > Open.
open chartexpo in google sheets
  • To access the charts library, click the Add new chart button.
add new chart in google sheets
  • Once ChartExpo is loaded. Click on “Slope Chart”.
search slope chart in google sheets
  • After selecting the sheet that contains your data, choose the Metrics option. Add the corresponding numbers.
  • To add dimensional data, click the Dimensions button and enter the desired values:
Select Data After Learning IMPORTRANGE in Google Sheets
  • Click the Create chart button to complete the process.
Click Create Chart After Learning IMPORTRANGE in Google Sheets
  • Click the Edit chart button to make custom changes.
  • To change the chart’s title, click the pencil icon next to the Chart Header.
  • It will open the properties dialog. Under the Text section, you can add a heading in Line 1 and enable the Show option. Give the appropriate title of your chart and click the Apply button.
Add Chart Header After Learning IMPORTRANGE in Google Sheets
  • Change all the legend shapes into circles and click the “Save” button:
Click Save Button After Learning IMPORTRANGE in Google Sheets
  • Your final chart will appear as shown below.
Final IMPORTRANGE in Google Sheets

Insights

  • Waitstaff and online reservation: Quarterly scores show exceptional satisfaction, with perfect scores of 100 recorded multiple times.
  • WiFi Availability and online ordering: Both receive consistently high ratings, reflecting strong customer approval.
  • Cleanliness and food cost: Scores vary significantly, signaling key areas that need improvement.

Steps to Make Slope Chart in Google Sheets:

  1. Open your Google Sheets Application.
  2. Install ChartExpo Add-in for Google Sheets from Google Workspace Marketplace.
  3. Select the Slope Chart from the list of charts.
  4. Fill in the necessary fields.
  5. Click on the “Create Chart” button.
  6. Customize your chart properties to add header, axis, legends, and other required information.
  7. Export your chart and share it with your audience.

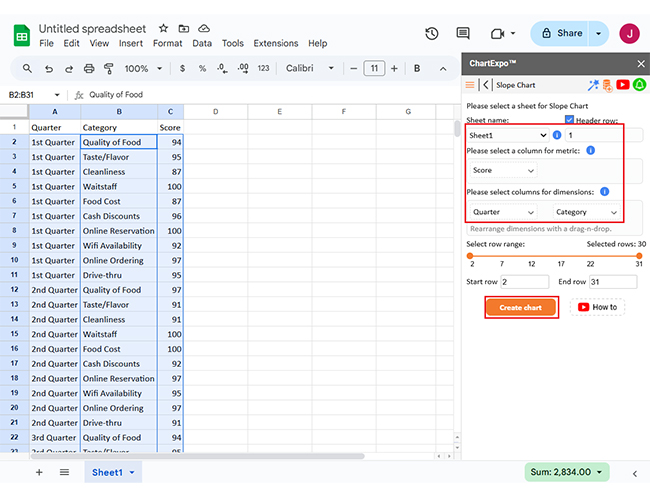
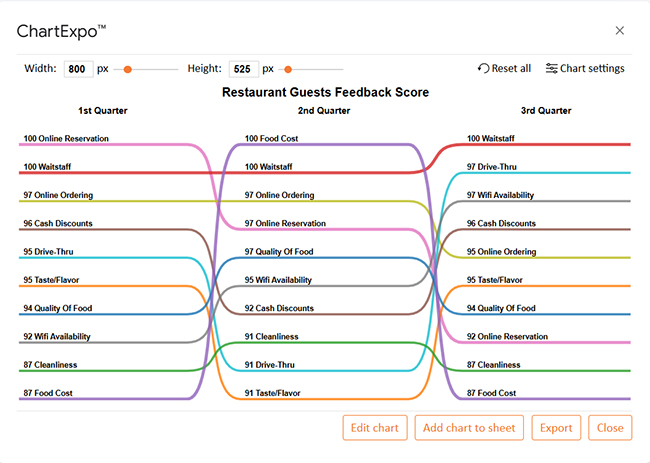
The following video will help you to create a Slope Chart in Google Sheets.

FAQs

What is the difference between IMPORTRANGE and Import data?

IMPORTRANGE pulls data from one Google Sheet to another. It works within Google Sheets and updates automatically. Import data, like IMPORTXML or IMPORTDATA, retrieves data from external sources, such as websites or files, and doesn’t update dynamically.

How do I reference a cell in Google Sheet IMPORTRANGE?

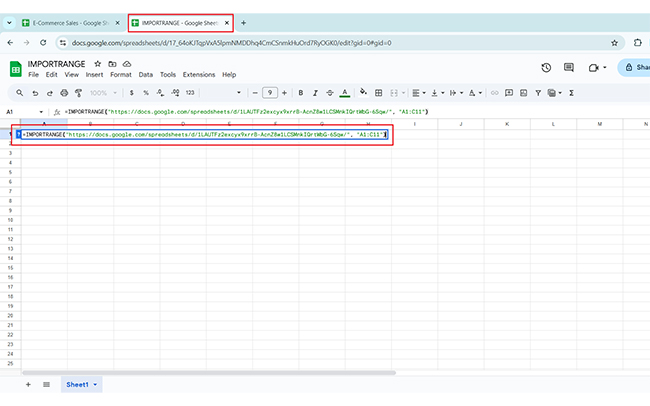
To reference a cell using IMPORTRANGE in Google Sheets, use this formula:

=IMPORTRANGE(“spreadsheet_url”, “sheet_name!cell_range”).

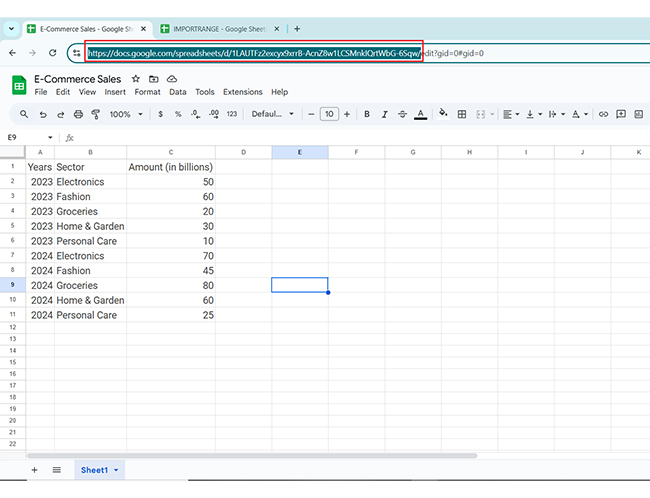
Replace spreadsheet_url with the source link and sheet_name!cell_range with the specific sheet and cell (e.g., “Sheet1!A1”).

Is there an alternative to IMPORTRANGE in Google Sheets?

Yes, there are alternatives to IMPORTRANGE in Google Sheets. You can use QUERY to fetch data within the same file or Apps Script to make advanced data connections. Add-ons like Sheetgo also help link and sync spreadsheets efficiently.

Wrap Up

IMPORTRANGE in Google Sheets is a powerful tool for importing data from one spreadsheet to another. This makes managing and analyzing data across files seamless—no more manual copy-pasting.

The beauty of IMPORTRANGE is its simplicity. With just a few clicks, your sheets are connected. It updates data in real time, keeping your workflow smooth. This feature makes collaboration easier.

Like any tool, IMPORTRANGE has its limits. Large datasets can slow it down, and permissions and access can pose challenges. Yet, its benefits often outweigh these drawbacks.

When paired with other functions, IMPORTRANGE becomes even more versatile. You can filter, query, or combine data effortlessly. It’s like adding superpowers to your spreadsheets.

If IMPORTRANGE doesn’t meet all your needs, there are alternatives. Tools like Google Apps Script or Google Sheets add-ons provide more flexibility; choose what best fits your workflow.

IMPORTRANGE isn’t just a feature—it’s a smarter way to work. Start using it today to lighten your spreadsheet load.

How much did you enjoy this article?

GSAd1
Start Free Trial!
144526

Related articles

next previous
Google Sheets10 min read

Google Sheets Amortization Schedule with Clear Visuals

A Google Sheets Amortization Schedule tracks loan payments, interest, and balances. Learn how to create your schedule for better loan management.

Google Sheets11 min read

Google Sheet Profit and Loss Template for Financial Success

Google Sheet profit and loss template simplifies tracking income and expenses. Learn tips and steps for using this template for better financial management.

Google Sheets11 min read

Sales Tracking Spreadsheet for Better Insights

A Spreadsheet for Sales Tracking organizes data, tracks performance, and analyzes trends. This guide covers its benefits, templates, and visualization tips.

Google Sheets11 min read

How to Create a Chart in Google Sheets in Few Steps?

Learn step-by-step how to create a chart in Google Sheets to visualize your data clearly and effectively, even if you're a beginner.

Google Sheets14 min read

How to Use Google Spreadsheet for Insightful Results

Learn how to use Google Sheets for data management. You’ll discover tips on adding data, using formulas, creating charts, and more to streamline your work.

ChartExpo logo

Turn Data into Visual
Stories

CHARTEXPO

  • Home
  • Gallery
  • Videos
  • Services
  • Pricing
  • Contact us
  • FAQs
  • Privacy policy
  • Terms of Service
  • Sitemap

TOOLS

  • ChartExpo for Google Sheets
  • ChartExpo for Microsoft Excel
  • Power BI Custom Visuals by ChartExpo
  • Word Cloud

CATEGORIES

  • Bar Charts
  • Circle Graphs
  • Column Charts
  • Combo Charts
  • Comparison Charts
  • Line Graphs
  • PPC Charts
  • Sentiment Analysis Charts
  • Survey Charts

TOP CHARTS

  • Sankey Diagram
  • Likert Scale Chart
  • Comparison Bar Chart
  • Pareto Chart
  • Funnel Chart
  • Gauge Chart
  • Radar Chart
  • Radial Bar Chart
  • Sunburst Chart
  • see more
  • Scatter Plot Chart
  • CSAT Survey Bar Chart
  • CSAT Survey Chart
  • Dot Plot Chart
  • Double Bar Graph
  • Matrix Chart
  • Multi Axis Line Chart
  • Overlapping Bar Chart
  • Control Chart
  • Slope Chart
  • Clustered Bar Chart
  • Clustered Column Chart
  • Box and Whisker Plot
  • Tornado Chart
  • Waterfall Chart
  • Word Cloud
  • see less

RESOURCES

  • Blog
  • Resources
  • YouTube
SIGN UP FOR UPDATES

We wouldn't dream of spamming you or selling your info.

© 2025 ChartExpo, all rights reserved.