Categories
Buried inside Microsoft Power BI sits one of the most practical AI tools available in business analytics today. Power BI Copilot lets any user type a question in plain English and receive a complete report, visual, or data summary within seconds, with no coding or query writing required.

Organizations once spent hours building dashboards by hand. That bottleneck is largely gone. This guide covers what Power BI Copilot does, why it matters for day-to-day decision-making, and how to put it to work to build reports that quickly surface real insights from your data.
Definition: Power BI Copilot is an AI assistant built into the Power BI platform that responds to natural language input with reports, data summaries, and visual outputs. A user types a request rather than constructing queries manually, and the tool returns a result immediately.
The feature, also called Copilot for Power BI, applies machine learning models to read user intent and translate it into meaningful data outputs. This makes analytics accessible to business users who lack a technical background, while also accelerating the work of those who do.
Data-driven decision-making requires speed and accuracy, two things that manual reporting rarely delivers. This tool closes that gap by handling the heavy analytical lifting so teams can focus on outcomes.
Beyond reporting, the tool extends to predictive analytics in Power BI, giving users the ability to spot emerging trends and act on them before they become problems.
The AI layer inside Power BI draws on Power BI artificial intelligence to interpret requests, automate outputs, and surface patterns that would take much longer to find manually.
Together, these capabilities make Copilot in Power BI a practical upgrade to standard Power BI features, reducing the distance between raw data and actionable conclusions.
Before using Power BI Copilot for the first time, you must link your report to a workspace that has Copilot support enabled. This connection is what makes the AI features available inside your environment.
Start by opening an existing report in Power BI Desktop and selecting Copilot from the ribbon. This action opens the Copilot pane on the side and prompts you to choose a compatible workspace.
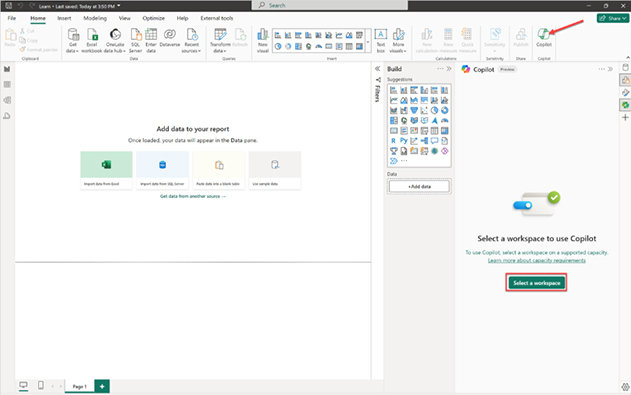
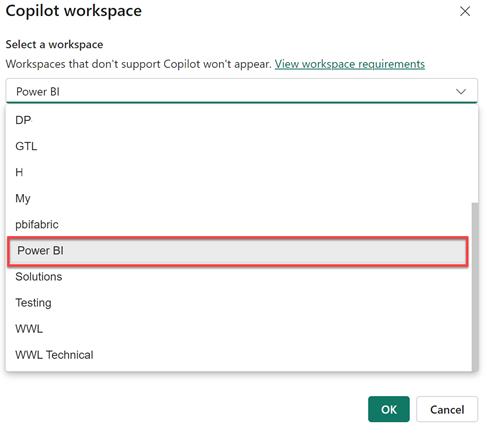
Choose a workspace that supports Copilot from the list provided. Only eligible workspaces (Fabric or Premium capacity) will be visible. This workspace is used for Copilot functionality and does not have to match your final publishing workspace.
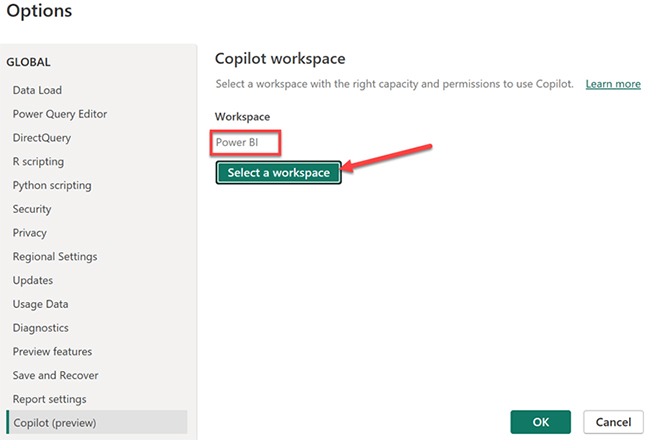
To check or change the selected workspace, click the Settings (gear icon) at the bottom-right corner of Power BI Desktop. This opens the options panel where Copilot settings are available.
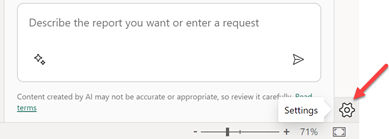
In the Options window, navigate to Copilot (Preview) settings. Here, you can view the currently connected workspace or switch to another compatible workspace if needed.
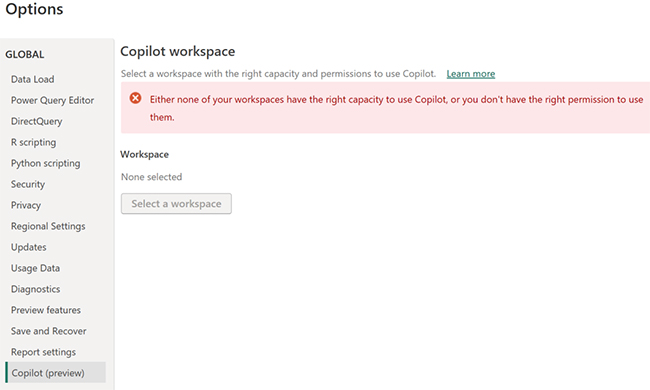
If no compatible workspace is available, you may see an error indicating that your workspaces either lack the required capacity or you don’t have the necessary permissions. In this case, you need access to a Fabric or Premium workspace.
With a valid workspace in place, you can start generating reports, building visuals, and running data queries using natural language. When connected to a data source in Power BI, Copilot refines its output over time based on how you interact with it and the context of your data.
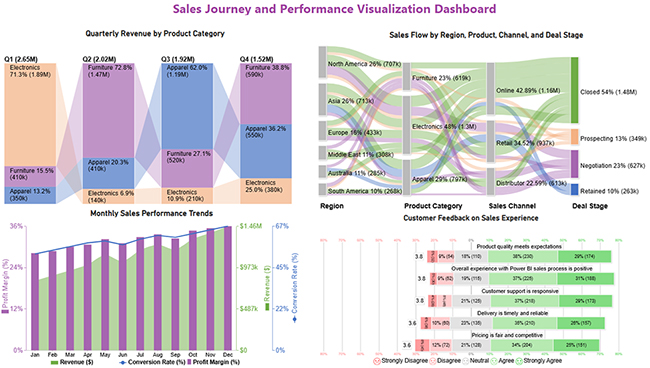
The walkthrough below shows how to use Power BI Copilot to analyze a dataset and build four chart types: Sankey Charts, Multi-Axis Line Charts, Comparison Bar Charts, and Likert Charts.
Organize your dataset with relevant fields such as Region, Product Category, Sales, Time (Month/Quarter), and Customer Feedback.
Ensure clean, structured data with no missing values for accurate Copilot results.
Enable Copilot from the toolbar or workspace (if supported).
Use natural language prompts to begin analysis, such as “Show sales trends by month” or “Visualize sales flow by region.”
Use Copilot to generate a Sankey chart by prompting:
“Show sales flow from region to product category to channel and deal stage.”
Prompt Copilot:
“Show monthly revenue, profit margin, and conversion rate.”
Prompt Copilot:
“Compare quarterly revenue by product category.”
Prompt Copilot:
“Show customer satisfaction levels for product quality and service.”
Use the formatting panel or prompts to:
Ask follow-up questions like:
This improves accuracy and depth of analysis.
The steps above cover the full build process, including tasks like forecasting in Power BI that are part of predictive workflows. For additional chart types beyond what is native to the platform, third-party tools can extend what you build here with more specialized visuals.
Adopting Power BI Copilot reduces the time between data and decision. Teams get sharper outputs without increasing their workload, and the results reach decision-makers faster.
Companies using Power BI embedded can extend these same capabilities into the apps their customers and staff already use, keeping analytics where the work happens.
Power BI Copilot sees use across a wide range of industries, with teams applying it wherever recurring data questions slow things down. Many organizations pair it with apps for Power BI to extend their reporting into specialized workflows.
Marketing and operations teams are among the most frequent users, each tracking different metrics but benefiting from the same speed advantage. Power BI tooltips add another layer to this experience by surfacing contextual data directly within visuals.
Power BI Copilot delivers clear value, but it works within constraints that teams should weigh before rolling it out. Knowing these limits helps set the right expectations from the start.
Teams weighing their options should compare Power BI Pro vs. Premium carefully, since the tier determines which Copilot features are available and at what scale.
Yes, Power BI Copilot is available, but access depends on your licensing plan and whether your organization has enabled AI features.
To enable Copilot, open your workspace settings in Power BI and turn on the feature, provided your workspace has the required Fabric or Premium capacity enabled.
Yes, the AI assistant in Power BI is useful for simplifying data analysis, generating insights, reports, and visuals from natural language input.
No, most Copilot capabilities in Power BI Desktop require a paid license. Access is typically limited to users on a Premium or Fabric capacity plan.
Power BI Copilot removes the technical barriers that once kept many business users away from their own data. By accepting natural language input and returning complete reports and visuals in seconds, it shifts the bottleneck out of analytics and back to where it belongs: deciding what to do with the results.
Teams that use it consistently report faster turnaround on reporting tasks and more time spent on interpretation rather than data preparation. The tool does not replace human judgment, but it removes the delay between having a question and getting reliable, current data to answer it well.
How much did you enjoy this article?


Discover diverse and high-quality Power BI report examples for inspiration and insights. Elevate your reporting with strategic visualization techniques.

A Customer Relationship Management Dashboard centralizes data, tracks key metrics, and drives smarter business decisions. Discover now!

Explore Healthcare Dashboard Examples and learn how to turn complex healthcare data into clear, actionable insights for better decision-making.