Categories
Retention numbers look calm right up until renewals sag and support queues explode. Customer Retention Metrics are the early warning system that shows whether existing customers are staying engaged or quietly drifting away.


These signals cover repeat buying, feature use, satisfaction feedback, and the revenue that depends on all of it. The point isn’t a fancy report.
It’s fast, practical clarity that helps teams spot churn risk, tighten onboarding, and keep the product delivering value month after month.
Definition: Customer Retention Metrics are measurements that show how well a company keeps current customers over a set time.
They track who stays, who leaves, and what changes before churn. When they’re tracked consistently, teams can catch risk early and protect long-term value.
They’re used to test whether retention work is paying off and where the experience is cracking. Alongside user retention metrics, they spotlight drop-offs after onboarding, feature fatigue, and dissatisfaction.
Customer Retention Metrics belong next to revenue reporting because they explain the trend, not just the total.
Customer Retention Metrics matter because they show stability that acquisition can’t fake. Keeping existing accounts costs less than replacing them, and customer retention isn’t optional when recurring revenue pays the bills.
Key reasons these numbers earn a permanent spot on the dashboard include:
A sensible KPI set mixes behavior and sentiment. Done right, the KPI mix flags churn risk before the revenue hit shows up.
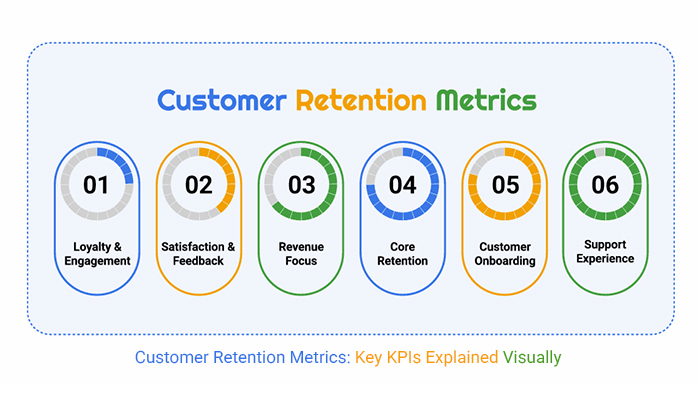
Examples are where Customer Retention Metrics stop being theory and start being useful. Most teams group retention signals by what they’re trying to protect, such as engagement, satisfaction, revenue lift, or plain churn control.
Measuring Customer Retention Metrics works best as a routine, not a one-time exercise. Start with clear definitions and consistent data sources so the results stay comparable from period to period.
Following the same steps each cycle keeps measurement tied to action. It turns retention tracking into a working feedback loop, not isolated reporting.
Analyzing Customer Retention Metrics turns raw logs and transactions into decisions.
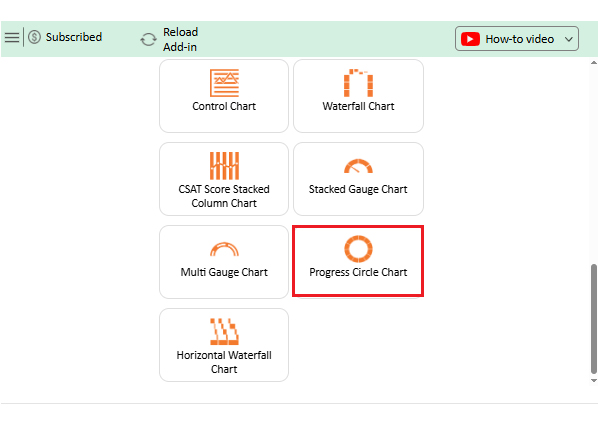
ChartExpo supports that workflow by turning Customer Retention KPIs into visuals that are easier to scan and explain.
Why Use ChartExpo?
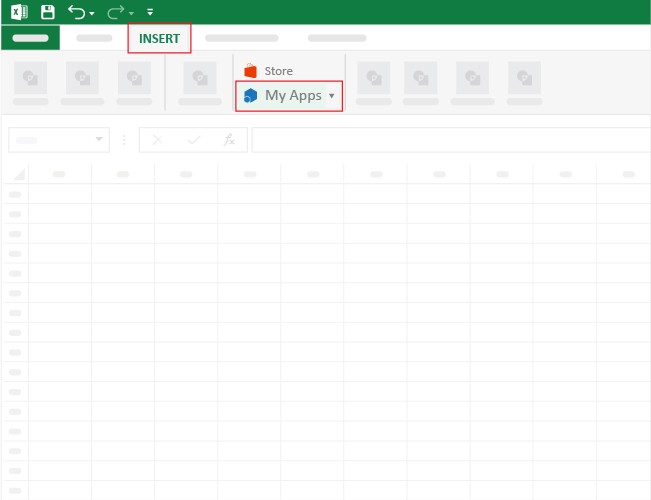
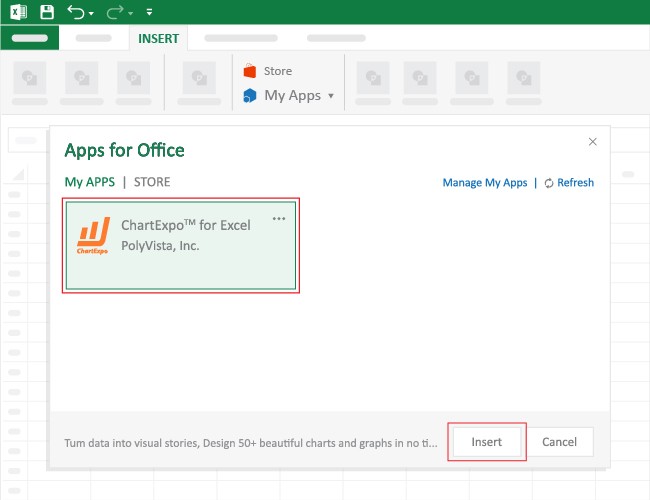
How to Install ChartExpo in Excel?
ChartExpo works in both Google Sheets and Microsoft Excel. Use the CTAs to install the tool you prefer, then build a clean visualization in just a few clicks right inside the spreadsheet.
Example:
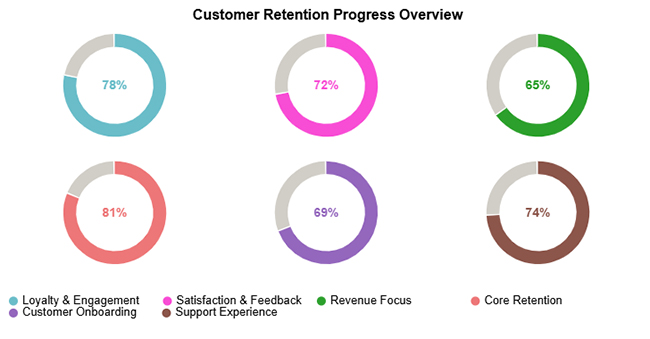
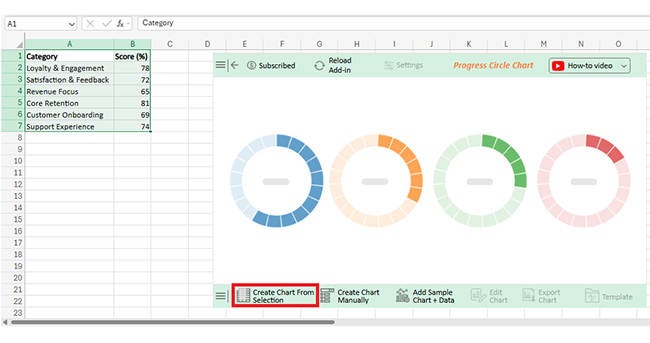
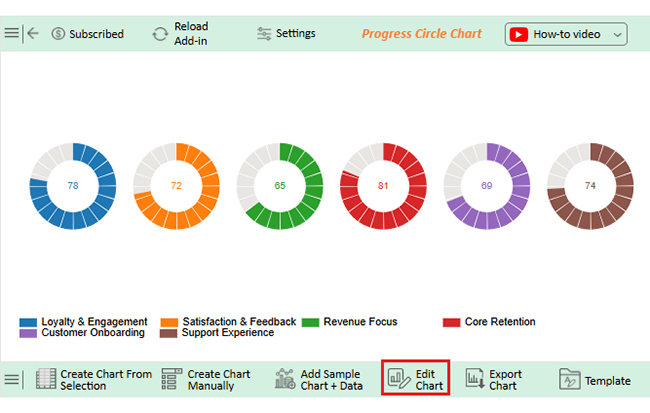
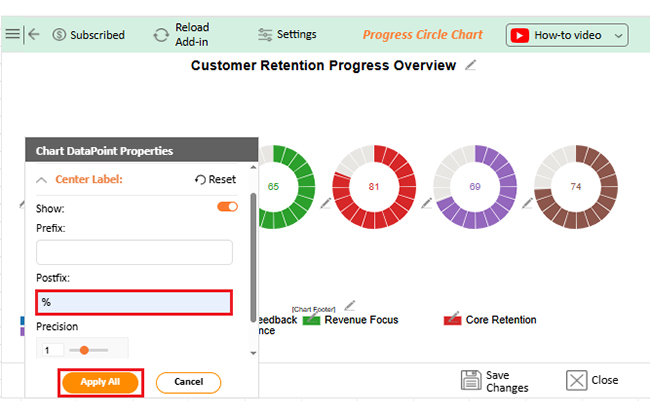
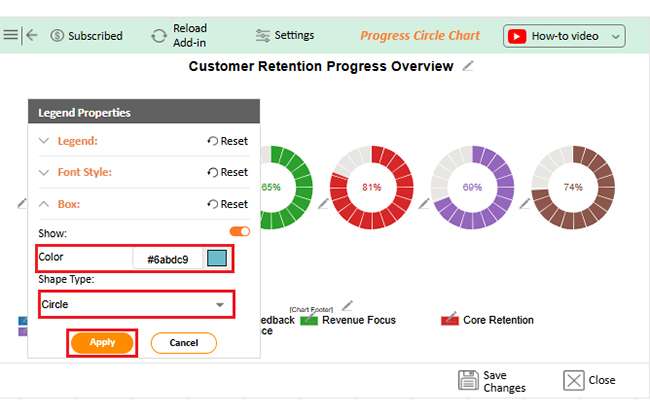
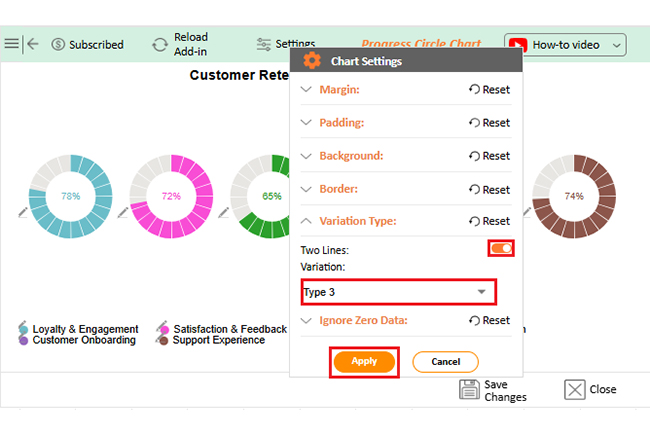
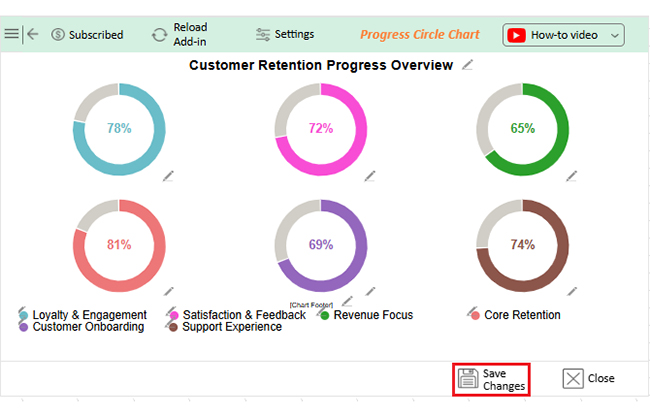
Assume the following dataset will be used for the Progress Circle Chart.
|
Category |
Score (%) |
| Loyalty & Engagement | 78 |
| Satisfaction & Feedback | 72 |
| Revenue Focus | 65 |
| Core Retention | 81 |
| Customer Onboarding | 69 |
| Support Experience | 74 |


Customer Retention Metrics do more than fill a slide deck. When they’re reviewed the right way, they point teams toward the fixes that actually move retention outcomes.
Common benefits include:
Useful Customer Retention Metrics come from disciplined tracking, not random reporting. Good practices keep the numbers consistent, readable, and tied to decisions that teams can execute.
Those habits also clear up metrics vs. measures, so activity counts don’t get confused with outcomes that matter.
Retention rate is the anchor because it shows who keeps coming back. Pair it with churn so it doesn’t get rosy.
SaaS teams watch retention rate, churn rate, customer lifetime value, and product engagement frequency. Together, they flag renewal risk.
Most teams review monthly or quarterly, but high-volume products need a weekly check. Regular review keeps small dips from turning into big losses.
Customer Retention Metrics become actionable when measurement, analysis, and visuals work together. Tracking the right indicators and presenting them well helps teams find gaps faster and agree on what to fix next.
Tools such as ChartExpo can speed up that last mile by making the story obvious without manual work, supporting stronger long-term customer relationships.
How much did you enjoy this article?


Calculate accounts receivable turnover ratio to measure credit collection speed, improve cash flow, and strengthen your financial strategy. Read on!

Change Management KPIs are the key to tracking adoption, performance, and ROI during transitions. Find out which metrics matter. Read on!

Data collection methods and techniques determine the quality of every insight you act on. Explore key approaches for gathering reliable data. Read on!


