• Home
  • Tools dropdown img
    • Spreadsheet Charts

      • ChartExpo for Google Sheets
      • ChartExpo for Microsoft Excel
    • Power BI Charts

      • Power BI Custom Visuals by ChartExpo
    • Word Cloud

  • Charts dropdown img
    • Chart Category

      • Bar Charts
      • Circle Graphs
      • Column Charts
      • Combo Charts
      • Comparison Charts
      • Line Graphs
      • PPC Charts
      • Sentiment Analysis Charts
      • Survey Charts
    • Chart Type

      • Box and Whisker Plot
      • Clustered Bar Chart
      • Clustered Column Chart
      • Comparison Bar Chart
      • Control Chart
      • CSAT Survey Bar Chart
      • CSAT Survey Chart
      • Dot Plot Chart
      • Double Bar Graph
      • Funnel Chart
      • Gauge Chart
      • Likert Scale Chart
      • Matrix Chart
      • Multi Axis Line Chart
      • Overlapping Bar Chart
      • Pareto Chart
      • Radar Chart
      • Radial Bar Chart
      • Sankey Diagram
      • Scatter Plot Chart
      • Slope Chart
      • Sunburst Chart
      • Tornado Chart
      • Waterfall Chart
      • Word Cloud
    • Google Sheets
      Microsoft Excel
  • Services
  • Pricing
  • Contact us
  • Blog
  • Support dropdown img
      • Gallery
      • Videos
      • Contact us
      • FAQs
      • Resources
    • Please feel free to contact us

      atsupport@chartexpo.com

Categories
All Data Visualizations Data Analytics Surveys
Add-ons/
  • Google Sheets
  • Microsoft Excel
  • Power BI
All Data Visualizations Data Analytics Surveys
Add-ons
  • Google Sheets
  • Microsoft Excel
  • Power BI

We use cookies

This website uses cookies to provide better user experience and user's session management.
By continuing visiting this website you consent the use of these cookies.

Ok

ChartExpo Survey


Home > Blog > Data Analytics

SLA vs KPI: Key Differences Explained with Visuals

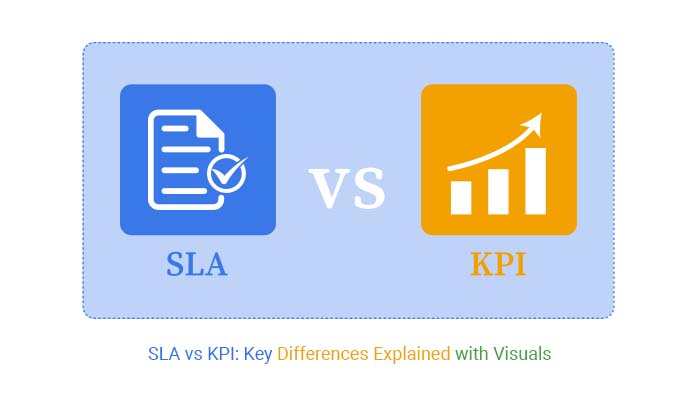
It may seem sudden, but businesses everywhere are reevaluating how they measure success. SLA vs. KPI: Have you stopped to question which one drives real results?

SLA vs KPI

I’m here to help you demystify this. Companies depend on numbers to survive. Yet many leaders still confuse these terms, despite their decisions often depending on them. In 2024, 80% of organizations reported using metrics and KPIs to guide their strategy. However, only 46% felt confident in their ability to track them. That gap costs money, time, and trust.

Consider a support team that promises a two-hour response time. That’s an SLA. But measuring satisfaction scores after the interaction? That’s a KPI. Both are crucial, yet their roles differ. The gap between the two can decide whether customers stay or leave.

Visualization adds another layer. A messy spreadsheet won’t spark action. Decision-makers need clear visuals, whether reviewing business management KPIs or service agreements. That’s where tools like ChartExpo make an impact. Trends become visible, problems stand out, and teams move faster.

Every industry depends on this clarity. In healthcare, SLAs ensure timely patient care. In the tech industry, KPIs measure performance and growth. Even startups need structure to survive their first five years, where failure rates hover around 50%. Therefore, understanding SLA vs. KPI is no longer optional. It’s the line between growth and chaos.

This post will break it down. You’ll see differences, connections, and how visualization turns raw data into powerful insight.

Let’s get started…

Table of Contents:

  1. What are SLA and KPI?
  2. Why Comparing SLA vs. KPI is Important?
  3. Explaining the Difference Between Sla vs. KPI
  4. What are the Similarities Between SLA and KPI?
  5. Relationship Between Service Level Agreement vs. KPI
  6. Explaining SLA and KPI Examples
  7. How to Analyze SLA vs. KPI in Excel?
  8. Benefits of SLA and KPI
  9. Best Practices for SLA vs. KPI
  10. FAQs
  11. Wrap Up

What are SLA and KPI?

Definition: SLA and KPI are tools that guide business performance. An SLA, or Service Level Agreement, sets clear promises between a provider and a client. It defines service quality, response times, and delivery standards.

A KPI, or Key Performance Indicator, measures progress toward goals. It tracks results and helps teams stay focused.

Together, SLAs and KPIs create structure and accountability. Many companies use KPI graphs to simplify data and spot trends quickly. Moreover, these tools apply to every sector, from customer success KPIs in tech to logistics and finance.

Clear SLAs and KPIs enhance trust, facilitate informed decision-making, and propel businesses toward measurable success.

Why Comparing SLA vs. KPI is Important?

Comparing KPIs vs. SLAs brings order. It helps leaders set realistic expectations and track real progress. Whether you run a startup or a global company, understanding this comparison can change how you plan, deliver, and grow. Here are some reasons why it matters:

  • Builds trust: A service level agreement vs. KPI review ensures promises match performance. Clients trust you more when delivery aligns with measurable goals.
  • Improves team focus: Comparing SLAs and KPIs highlights priorities. Using employee performance KPIs keeps teams aligned with company objectives.
  • Strengthens strategy: Businesses use smart KPI to refine decision-making. Linking them to SLAs makes strategies actionable.
  • Drives consistency: This comparison standardizes quality. It ensures services meet expectations across departments and customers.

Explaining the Difference Between SLA and KPI

Many teams mix up SLAs and KPIs. This mistake leads to missed opportunities and confusion. Both are essential, but their purposes differ. From KPIs for accounting to tech support, clear definitions keep everyone on the same page.

Here is a table to break it down:

Aspect SLA (Service Level Agreement) KPI (Key Performance Indicator)
Purpose Defines service expectations between parties. Measures progress toward goals.
Focus Commitments on service quality and delivery. Performance and outcomes.
Example Reply to all client emails within two hours. Achieve 90% invoice accuracy rate.
Industry Use Service contracts and client agreements. Metrics for teams using retail industry KPIs and finance.
Measurement Pass or fail against set standards. Numeric tracking and performance trends.
Timeframe Often fixed and tied to contracts. Flexible and adjusted with business needs.
Impact Builds trust and ensures reliability. Drives improvement and motivates growth.

What are the Similarities Between SLA and KPI?

Many see SLAs and KPIs as completely different items. Sure, they are, but they share powerful similarities that drive results. Whether tracking KPIs for safety in manufacturing or using smart KPIs in marketing, these tools bring structure. They simplify goals and create a path to measurable success.

Here is what they have in common:

  • They are both measurable: SLAs and KPIs rely on numbers. This makes performance clear and decisions easier.
  • They are data-oriented: Both use data to track progress. Leaders can see trends and act quickly.
  • Both have performance-oriented roles: These tools focus on achieving results and improving outcomes.
  • They are both strategic tools: SLAs and KPIs shape planning. They guide teams toward growth and long-term goals.

Relationship Between Service Level Agreement vs. KPI

SLAs and KPIs are deeply connected. One sets expectations, the other measures how well those expectations are met. Together, they create a cycle of accountability and growth. This connection applies to every sector, from tech support to finance. Here are four scenarios that show their relationship in action:

  • Customer support: SLAs promise response times. KPIs measure satisfaction rates. Together, they ensure customers feel valued and supported.
  • Finance: SLAs set deadlines for reporting. KPIs track accuracy and speed. This ensures that financial operations are reliable and transparent.
  • Operations: SLAs guarantee delivery standards. KPIs measure output and quality. Both keep teams efficient and consistent.
  • Safety management: SLAs define safety protocols. KPIs monitor incidents and compliance. This builds trust and creates a safer work environment.

Explaining SLA and KPI Examples

Businesses use these tools every day to set standards and measure progress. SLAs define service commitments, while KPIs track results. Together, they create accountability and growth. Here are simple scenarios to illustrate their use:

SLA Examples:

  • IT support: Guarantee a response to all tickets within one hour. This ensures faster resolutions and prevents small issues from turning into major problems.
  • Logistics: Commit to delivering 95% of shipments on time. This helps build reliability and encourages customers to return.
  • Cloud services: Promise 99.9% uptime to ensure businesses operate smoothly. Such reliability keeps clients loyal and reduces service complaints.

KPI Examples:

  • Employee performance KPIs: Measure the number of projects completed each quarter to track productivity and effectiveness. This data helps managers reward high performers and provide support where needed.
  • Safety KPIs: Monitor incidents per 1,000 work hours to identify risks. Companies use this information to create safer work environments and protect their employees.
  • KPIs in accounting: Track the accuracy of monthly financial reports to maintain transparency. Accurate records help businesses make informed financial decisions.
  • Customer success KPIs: Measure renewal rates and customer churn to understand satisfaction. High retention means stronger relationships and steady revenue growth.

How to Analyze SLA vs. KPI in Excel?

Spreadsheets can tell a story, but sometimes Excel makes it feel like solving a puzzle with missing pieces. Analyzing SLA vs. KPI in Excel can quickly become messy. Endless rows and columns make spotting trends a chore.

Don’t worry. Data visualization is the game-changer here. Clear visuals turn numbers into insights that drive action.

Yet, Excel charts often lack the depth and clarity teams need. And that is where ChartExpo steps in. This tool simplifies complex data and creates visuals that speak louder than raw numbers. With it, analyzing SLAs and KPIs becomes faster, smarter, and far more effective.

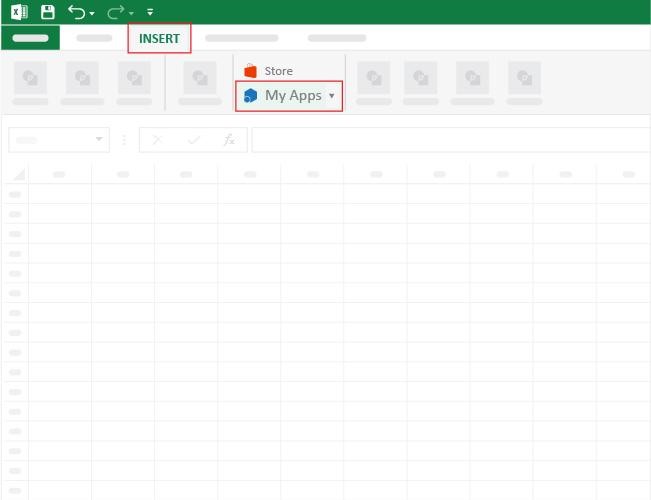
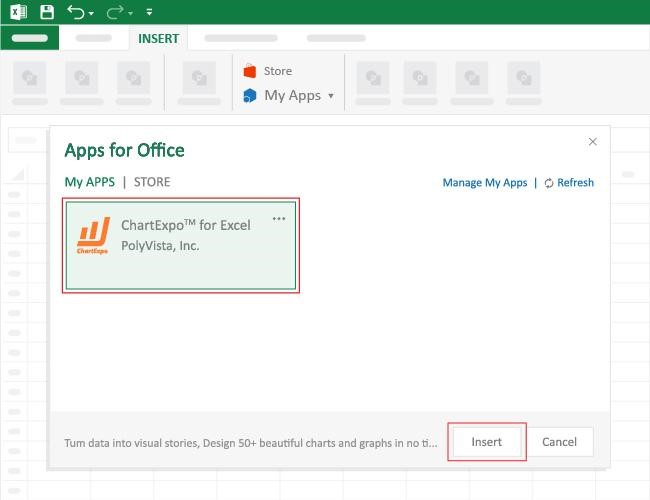
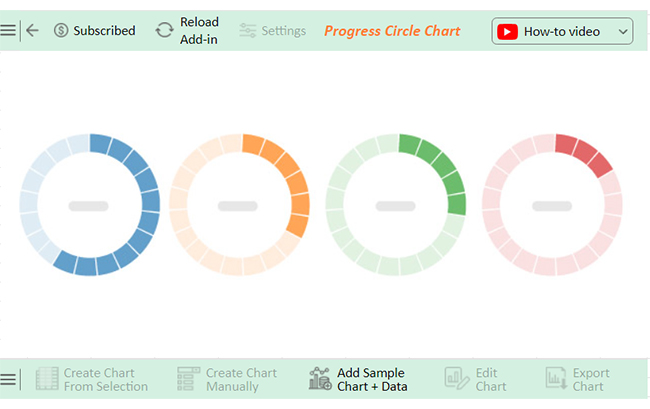
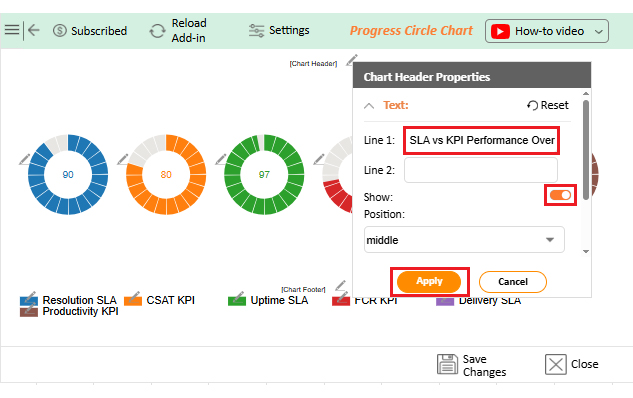
How to Install ChartExpo in Excel?

  1. Open your Excel application.
  2. Open the worksheet and click the “Insert” menu.
  3. You’ll see the “My Apps” option.
  4. In the Office Add-ins window, click “Store” and search for ChartExpo on my Apps Store.
  5. Click the “Add” button to install ChartExpo in your Excel.

ChartExpo charts are available both in Google Sheets and Microsoft Excel. Please use the following CTAs to install the tool of your choice and create beautiful visualizations with a few clicks in your favorite tool.

Example

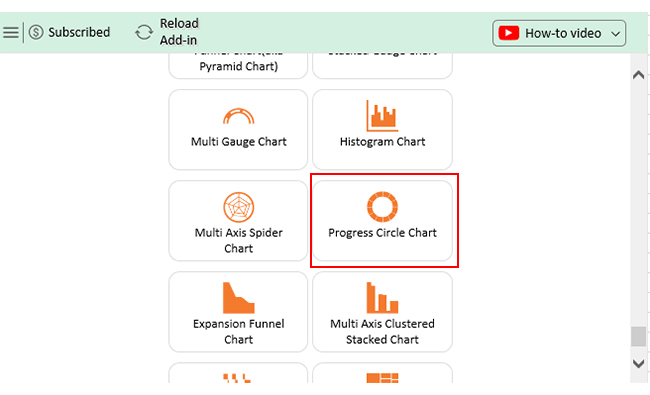
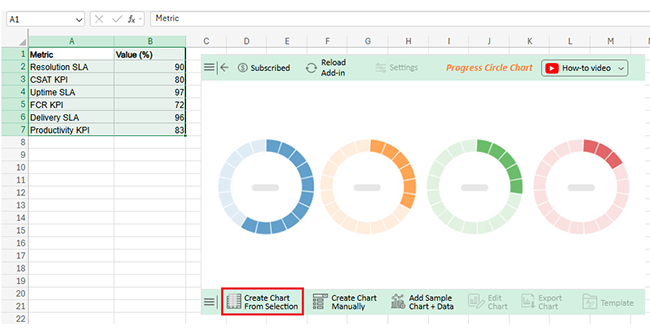
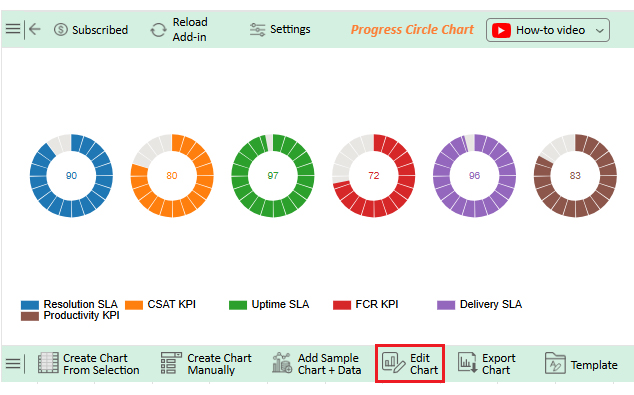
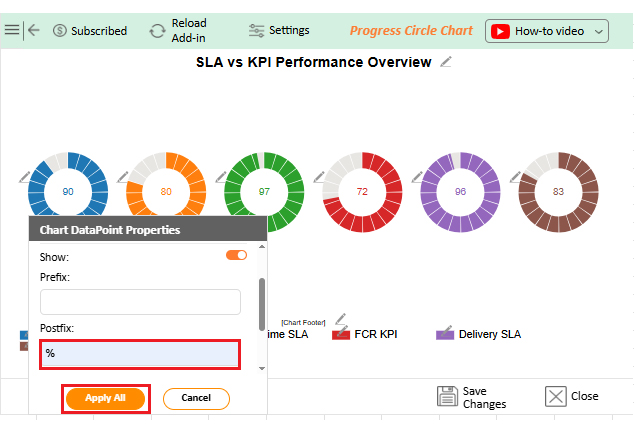
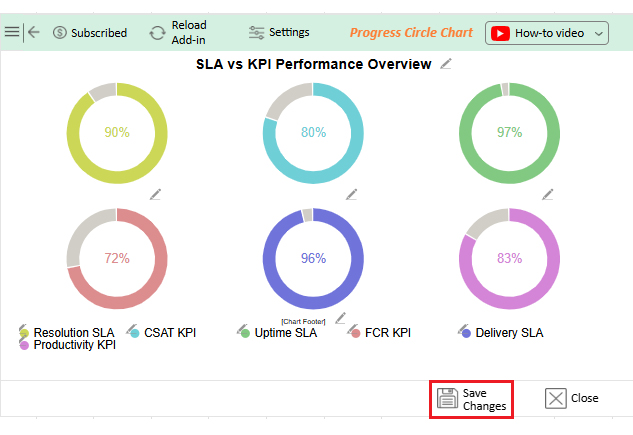
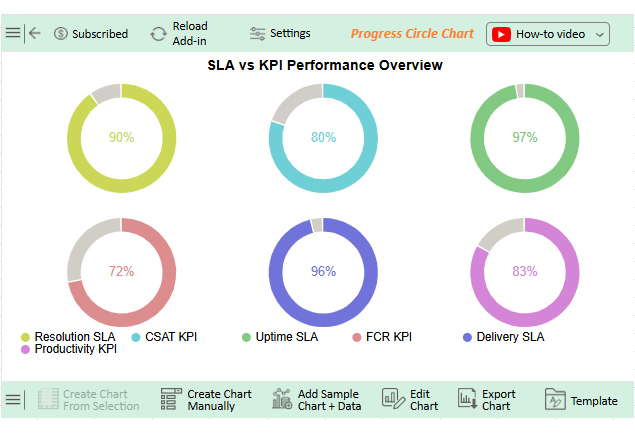
Let’s analyze the data below and glean insights from the visualization we create.

Metric Value (%)
Resolution SLA 90
CSAT KPI 80
Uptime SLA 97
FCR KPI 72
Delivery SLA 96
Productivity KPI 83
  • To get started with ChartExpo, install ChartExpo in Excel.
  • Now, click on My Apps from the INSERT menu.
SLA vs KPI
  • Choose ChartExpo from My Apps, then click Insert.
SLA vs KPI
  • Once it loads, scroll through the charts list to locate and choose the “Progress Circle Chart”.
SLA vs KPI
  • The Progress Circle Chart will appear as follows.
SLA vs KPI
  • Click the “Create Chart From Selection” button after selecting the data from the sheet, as shown.
SLA vs KPI
  • ChartExpo will generate the visualization below for you.
SLA vs KPI
  • If you want to add anything to the chart, click the Edit Chart button:
  • Click the pencil icon next to the Chart Header to change the title.
  • It will open the properties dialog. Under the Text section, you can add a heading in Line 1 and enable Show.
  • Give the appropriate title of your chart and click the Apply button.
SLA vs KPI
  • You can add the (%) with all values from “Chart DataPoint Properties”:
SLA vs KPI
  • You can change the color or shape of the legend from the “Legend Properties”:
SLA vs KPI
  • Next, you can change the Variation type from “Chart Settings” to make the chart look more presentable.
SLA vs KPI
  • Also, increase font size for better readability.
SLA vs KPI
  • Click the “Save Changes” button to persist the changes made to the chart.
SLA vs KPI
  • Your final Progress Circle Chart will look like the one below.
SLA vs KPI

Insights

  • Uptime SLA 97% and Delivery SLA 96% show strong performance.
  • Resolution SLA 90% and Productivity KPI 83% need slight improvement.
  • CSAT KPI 80% and FCR KPI 72% show weak results.
  • SLAs outperform KPIs, highlighting gaps in operations.

Benefits of SLA and KPI

Clear goals are the foundation of strong performance. SLAs and KPIs provide the structure to make those goals actionable. They keep teams accountable, guide service improvements, and help leaders make smarter choices. Companies that embrace them often see happier customers and better business outcomes.

Here’s why they’re essential:

  • Improves clarity: SLAs and KPIs clearly define success. Teams know exactly what’s expected and can focus on measurable results.
  • Builds trust: Consistently meeting SLAs and achieving KPI targets proves reliability. Clients and employees gain confidence in your processes.
  • Drives growth: Tracking performance uncovers areas for improvement. This allows businesses to focus their efforts and resources where they’ll have the most impact.
  • Enhances decision-making: Data from SLAs and KPIs turns guesswork into strategy. Leaders can make quick, informed decisions based on facts.

Best Practices for SLA vs. KPI

Talking about measuring performance is easy. Putting it into practice is where things get tricky. SLAs and KPIs can guide your team, but only if they’re applied thoughtfully. Done right, they drive progress. Done poorly, they create confusion. To make them work for you, follow these best practices for getting the most out of SLA vs. KPI:

  • Set clear and realistic goals: Define what success looks like for both SLAs and KPIs. This keeps teams focused on achievable targets without unnecessary stress.
  • Regularly review performance: Track your metrics often. Frequent check-ins help spot trends early and make it easier to adjust when needed.
  • Use visual tools: Turn data into easy-to-read visuals. Charts and dashboards, especially with tools like ChartExpo, make patterns stand out and insights easier to act on.
  • Align with business objectives: Make sure SLAs and KPIs connect to your overall strategy. When everyone moves toward the same goals, performance improves across the organization.

FAQs

Can a KPI be converted to SLA?

KPIs can inform SLAs, but they are not the same. Metrics from KPIs can set realistic service targets. By using performance data, organizations can define commitments that turn measurable outcomes into clear SLAs for teams and clients.

What is SLA vs. KPI vs. SLO?

SLA, KPI, and SLO are related but different. An SLA sets service commitments, whereas a KPI measures performance toward goals. An SLO defines specific targets within an SLA. Together, they track, measure, and ensure service quality effectively.

Wrap Up

Mastering SLA vs. KPI is essential for any business seeking clear results. Understanding their differences and similarities creates focus. It helps teams know what to deliver and how to measure success.

SLAs set promises. KPIs track performance. Both guide decision-making and improve accountability. Using examples makes the concepts easy to grasp. IT support, logistics, and cloud services show how SLAs define service. Employee performance, safety, and accounting KPIs demonstrate measurable outcomes. Seeing these examples helps teams apply them in real situations.

Data alone is not enough. Visualization turns numbers into insights. Charts and graphs reveal trends that spreadsheets hide. Teams can act faster and make smarter decisions when they clearly see the data.

Excel has limitations. Its charts are basic and often fail to show complex relationships. This is where ChartExpo makes a difference. It creates visuals that are easy to understand and use. Patterns and gaps become clear immediately.

So, do not hesitate.

Start using ChartExpo today. Install it and transform how you analyze SLA vs KPI. With the right approach, you can measure success confidently and grow smarter.

How much did you enjoy this article?

PBIAd1
Start Free Trial!
157627

Related articles

next previous
Data Analytics12 min read

B2B Marketing KPIs: Key Metrics for B2B Growth

B2B marketing KPIs track lead quality, engagement, and revenue. Click here to learn how to choose, analyze, and visualize KPIs for better marketing results.

Data Analytics10 min read

KPI Tracking Software: A Visual Approach to KPIs

Understand what a KPI tracking software does and why it's essential. You’ll discover the best tools and tips to improve decision-making and performance.

Data Analytics14 min read

Enterprise Reporting: Definition, Benefits, and Examples

Enterprise reporting transforms data into clear insights for smarter decisions. Learn steps, tools, and visuals to use to create reports that drive results.

Data Analytics12 min read

Issue Tracker Template for Smarter Issue Monitoring

Learn what an issue tracker template is and why it’s useful. This blog post shows you how to build and analyze one to track issues and boost team productivity.

Data Analytics9 min read

Lead Generation KPIs: A Guide for Better Results

Lead generation KPIs measure how well you attract and convert leads. Click here to learn how to track, analyze, and improve these KPIs for better results.

ChartExpo logo

Turn Data into Visual
Stories

CHARTEXPO

  • Home
  • Gallery
  • Videos
  • Services
  • Pricing
  • Contact us
  • FAQs
  • Privacy policy
  • Terms of Service
  • Sitemap

TOOLS

  • ChartExpo for Google Sheets
  • ChartExpo for Microsoft Excel
  • Power BI Custom Visuals by ChartExpo
  • Word Cloud

CATEGORIES

  • Bar Charts
  • Circle Graphs
  • Column Charts
  • Combo Charts
  • Comparison Charts
  • Line Graphs
  • PPC Charts
  • Sentiment Analysis Charts
  • Survey Charts

TOP CHARTS

  • Sankey Diagram
  • Likert Scale Chart
  • Comparison Bar Chart
  • Pareto Chart
  • Funnel Chart
  • Gauge Chart
  • Radar Chart
  • Radial Bar Chart
  • Sunburst Chart
  • see more
  • Scatter Plot Chart
  • CSAT Survey Bar Chart
  • CSAT Survey Chart
  • Dot Plot Chart
  • Double Bar Graph
  • Matrix Chart
  • Multi Axis Line Chart
  • Overlapping Bar Chart
  • Control Chart
  • Slope Chart
  • Clustered Bar Chart
  • Clustered Column Chart
  • Box and Whisker Plot
  • Tornado Chart
  • Waterfall Chart
  • Word Cloud
  • see less

RESOURCES

  • Blog
  • Resources
  • YouTube
SIGN UP FOR UPDATES

We wouldn't dream of spamming you or selling your info.

© 2026 ChartExpo, all rights reserved.