Categories
What are B2B marketing KPIs, and why do they matter so much? The truth is, without the correct data, you’re making an educated guess. And in B2B, guessing costs money.


B2B marketing KPIs make things clear. They show where leads are coming from, which channels perform, and what drives revenue. But tracking clicks and impressions isn’t enough. You need to tie those numbers to actual outcomes, and that’s where strong performance metrics come in.
B2B marketing KPIs aren’t just about marketing—they’re about alignment. They connect sales, finance, and leadership to help you stop chasing vanity stats and start building results. Need to boost pipeline quality? There’s a KPI for that. Want to cut cost-per-lead? Track it and tweak your efforts.
And don’t forget about money. Financial metrics, such as Customer Acquisition Cost (CAC) and marketing-influenced revenue, matter more than likes and shares. They speak the language your CFO understands.
Still, many marketers get stuck. They either track too much or focus on the wrong things. That’s why this post exists—to help you choose KPIs that help your business grow.
If your metrics aren’t connected to outcomes, they’re not helping. They’re just numbers on a slide.
Let’s fix that.
Definition: B2B marketing KPIs are the key metrics that indicate whether your marketing efforts are effective. They track progress, performance, and real results. These include metrics such as lead conversion rates, sales pipeline impact, and customer engagement.
Good KPIs are directly connected to customer success KPIs and those for accounting. They help teams speak the same language—revenue. Instead of guessing, you measure. And instead of reporting activity, you prove value. That’s what metrics and KPIs are meant to do.
You can’t grow a B2B business on guesswork. You need numbers that guide every move—and prove every win. That’s the job of B2B Marketing KPIs. They don’t just measure performance—they shape the strategy behind it.
Here’s why they’re essential for real growth, explained clearly:
Most marketers track too much—or the wrong stuff. Endless dashboards, endless noise. But growth? That comes from focus. You don’t need more data. You need better data. The kind that tells you what to fix, what to keep, and what to grow.
Here are the 10 B2B marketing KPIs that matter—because they connect effort to impact:
You don’t need to track everything. You need to track what moves the needle. In B2B marketing, that means numbers tied to real action—clicks, sign-ups, and cost. These aren’t vanity stats. They show intent and value.
Here are three B2B marketing KPIs that teams rely on every day:
Picking the right KPIs can feel like throwing darts in the dark. Good B2B marketing KPIs don’t come from guesswork. They come from clarity – from knowing what success looks like before you start. Here’s how to choose KPIs that help your team grow:
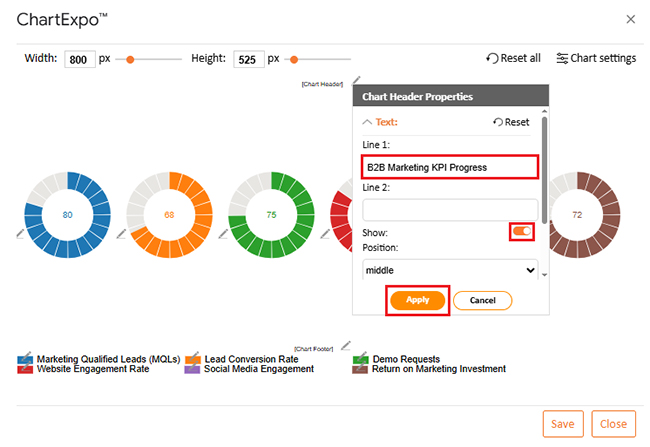
What are B2B marketing KPIs? Think of them as your marketing team’s scoreboard. But staring at raw data in rows and columns is no fun—and not helpful. Google Sheets can store the numbers, sure. But when it’s time to see what’s working, it falls flat. No context. No clarity. No wow factor.
That’s where data visualization steps in. Turning dry metrics into powerful visuals makes everything click. And this is precisely what ChartExpo does best. It picks up where Google Sheets stops—and turns data into decisions.
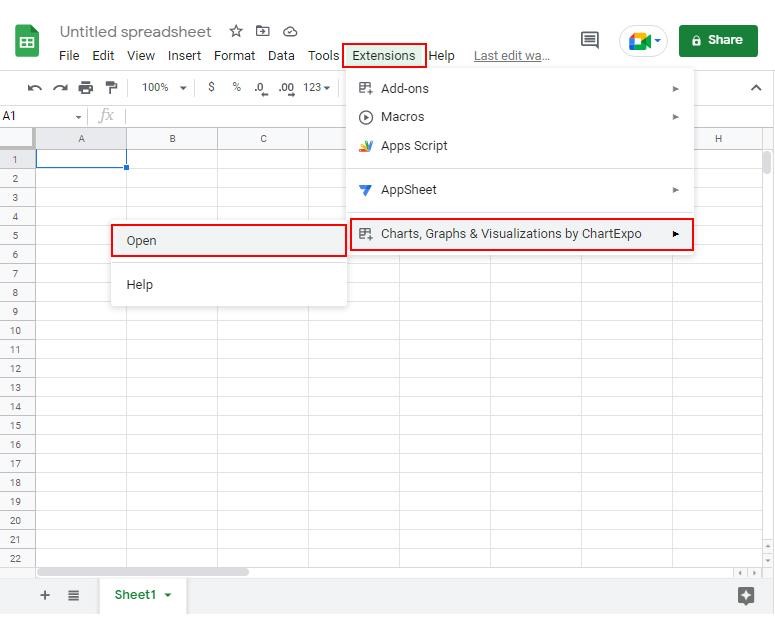
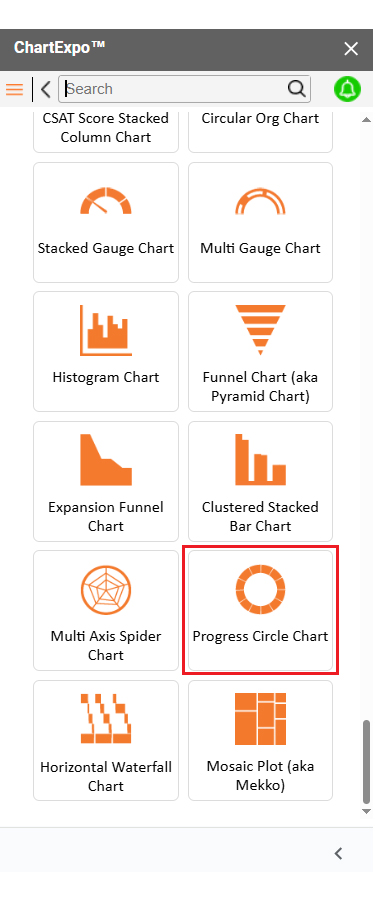
How to Install ChartExpo in Google Sheets?
ChartExpo charts are available both in Google Sheets and Microsoft Excel. Please use the following CTAs to install the tool of your choice and create beautiful visualizations in a few clicks in your favorite tool.
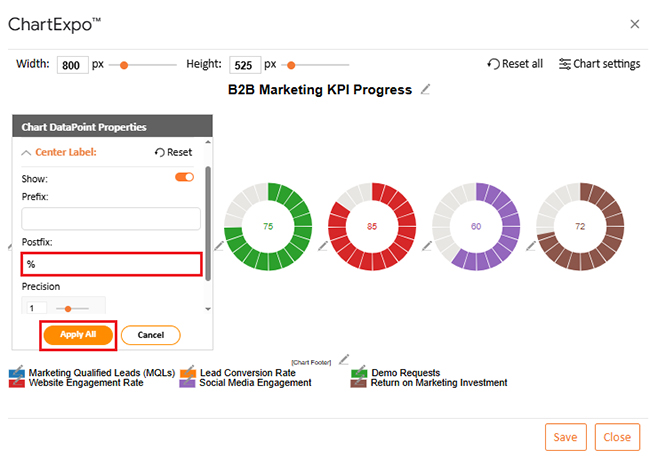
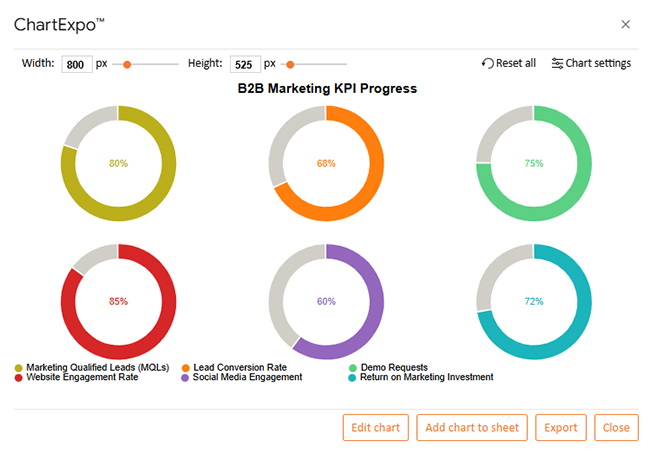
Let’s visualize and analyze B2B marketing KPIs data in Google Sheets using ChartExpo.
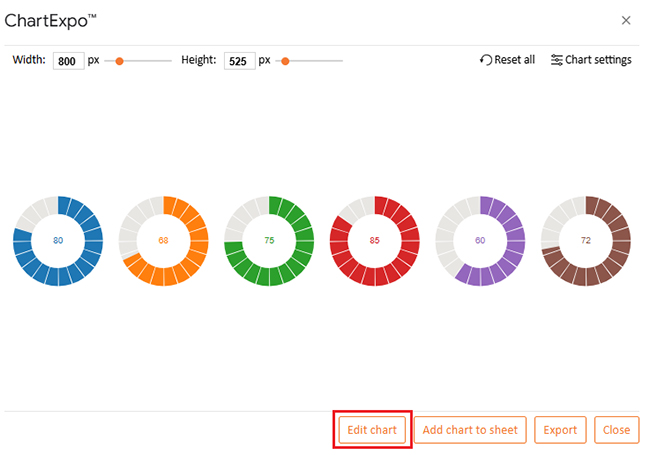
| KPIs | Completion (%) |
| Marketing Qualified Leads (MQLs) | 80 |
| Lead Conversion Rate | 68 |
| Demo Requests | 75 |
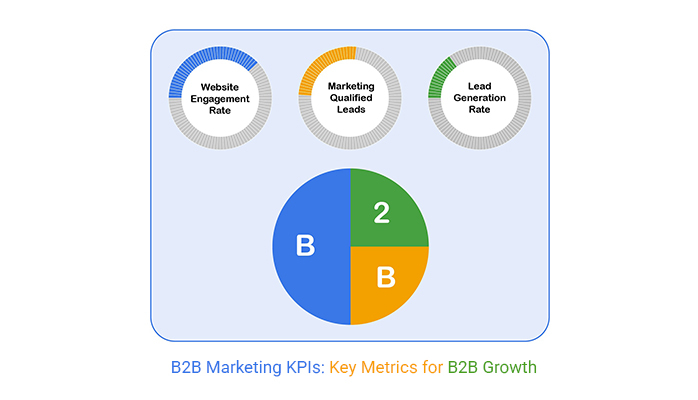
| Website Engagement Rate | 85 |
| Social Media Engagement | 60 |
| Return on Marketing Investment | 72 |


Marketing without KPIs is like throwing darts with your eyes closed. You might hit something, but not the target. In B2B, where sales cycles are long and stakes are high, you can’t afford to guess. You need clarity and direction. That’s what B2B marketing KPIs give you.
Here’s why they’re a game-changer:
Have you ever felt overwhelmed by dashboards? You’re not alone. B2B marketers often drown in numbers but still miss what matters. The problem isn’t the data—it’s how we use it. Great B2B marketing KPIs don’t shout the loudest. They tell the truth, quietly and clearly. But only if you follow a few smart habits.
Here are the best practices to get it right:
Lead generation, brand awareness, customer retention, and sales enablement. Each plays a key role – together, they drive growth:
Product, Price, Place, Promotion. These items shape your strategy:
All four must align for B2B success.
B2B marketing KPIs help you measure what matters. They turn raw data into clear direction. No more guessing. No more wasted effort. Strong KPIs show what’s working, and also highlight what needs fixing. This saves time, budget, and energy. You focus on results, not activity.
What are sales KPIs? They track how well your sales team performs. Think lead response time, win rate, or quota attainment. These KPIs align directly with revenue goals.
Key performance indicators for operations help streamline execution. They focus on process, efficiency, and delivery. Together with marketing and sales KPIs, they close performance gaps.
KPIs for accounting measure financial health. They include profit margins, expense ratios, and revenue growth. Without them, decisions can go off track.
Finally, use SMART KPIs examples to stay focused. SMART means Specific, Measurable, Achievable, Relevant, and Time-bound. It keeps your team aligned and accountable.
Conclusively, choose the right KPIs, and growth will become intentional. How? You track, learn, and improve. And don’t wait to install ChartExpo. This tool will make those insights visual, fast, and clear. Win with purpose!
How much did you enjoy this article?


Calculate accounts receivable turnover ratio to measure credit collection speed, improve cash flow, and strengthen your financial strategy. Read on!

Change Management KPIs are the key to tracking adoption, performance, and ROI during transitions. Find out which metrics matter. Read on!

Data collection methods and techniques determine the quality of every insight you act on. Explore key approaches for gathering reliable data. Read on!


