• Home
  • Tools dropdown img
    • Spreadsheet Charts

      • ChartExpo for Google Sheets
      • ChartExpo for Microsoft Excel
    • Power BI Charts

      • Power BI Custom Visuals by ChartExpo
    • Word Cloud

  • Charts dropdown img
    • Chart Category

      • Bar Charts
      • Circle Graphs
      • Column Charts
      • Combo Charts
      • Comparison Charts
      • Line Graphs
      • PPC Charts
      • Sentiment Analysis Charts
      • Survey Charts
    • Chart Type

      • Box and Whisker Plot
      • Clustered Bar Chart
      • Clustered Column Chart
      • Comparison Bar Chart
      • Control Chart
      • CSAT Survey Bar Chart
      • CSAT Survey Chart
      • Dot Plot Chart
      • Double Bar Graph
      • Funnel Chart
      • Gauge Chart
      • Likert Scale Chart
      • Matrix Chart
      • Multi Axis Line Chart
      • Overlapping Bar Chart
      • Pareto Chart
      • Radar Chart
      • Radial Bar Chart
      • Sankey Diagram
      • Scatter Plot Chart
      • Slope Chart
      • Sunburst Chart
      • Tornado Chart
      • Waterfall Chart
      • Word Cloud
    • Google Sheets
      Microsoft Excel
  • Services
  • Pricing
  • Contact us
  • Blog
  • Support dropdown img
      • Gallery
      • Videos
      • Contact us
      • FAQs
      • Resources
    • Please feel free to contact us

      atsupport@chartexpo.com

Categories
All Data Visualizations Data Analytics Surveys
Add-ons/
  • Google Sheets
  • Microsoft Excel
  • Power BI
All Data Visualizations Data Analytics Surveys
Add-ons
  • Google Sheets
  • Microsoft Excel
  • Power BI

We use cookies

This website uses cookies to provide better user experience and user's session management.
By continuing visiting this website you consent the use of these cookies.

Ok

ChartExpo Survey


Home > Blog > Microsoft Excel

How to Copy Formatting in Excel for Better Insights

“How to copy formatting in Excel?” It’s a question nearly every Excel user asks at some point. Formatting often takes more time than inputting the data itself. Yet, if you make one mistake, you’ll end up redoing everything.

how-to-copy-formatting-in-excel

Imagine spending an hour perfecting a report, only to realize you need the same format on five more sheets. Copying formatting saves you from that frustration. Knowing how to copy formatting in Excel is more than a trick. It’s a productivity booster. It helps maintain consistency across reports, dashboards, and data summaries.

Mastering Excel copy formatting is essential for professionals and students alike. Whether you work on finance reports, inventory lists, or project trackers, Excel’s formatting tools are your shortcut to polished results.

While working with large files, users often pair formatting with tasks such as data transformation in Excel or automatic formatting in Excel. These tools save hours of work and are surprisingly simple once you know how. Even better, once formatting is consistent, you’ll find it easier to manage tasks like data consolidation in Excel. Everything flows more smoothly when your data looks clean and uniform.

Formatting isn’t an afterthought. It’s a key part of presenting information with clarity. And it’s worth mastering if you want your Excel sheets to stand out and work for you.

How?

Follow my lead…

Table of Contents:

  1. What is Copy Formatting in Excel?
  2. Why is Excel’s Copy Formatting Useful?
  3. When to Use Copy Formatting in Excel?
  4. How to Copy Formatting in Excel?
  5. How to Analyze Copied and Formatted Data in Excel?
  6. Tips for Copy Formatting in Excel
  7. FAQs
  8. Wrap Up

What is Copy Formatting in Excel?

Definition: Copy formatting in Excel means applying the same look and style from one cell or range to another. It saves time and keeps your data consistent. With tools like Format Painter, you can copy fonts, colors, borders, and number formats in seconds.

Copy formatting works well with tasks such as Custom Sorting in Excel or when eliminating duplicates in Excel. It helps keep data clean, organized, and easy to read across sheets and reports.

The top 5 Charts can be created after copying and formatting in Excel

Want to bring your formatted Excel data to life? Check out these top 5 charts that make your data not just look good, but speak. These charts were created using ChartExpo, a powerful Excel add-in that makes data visualization effortless.

Progress Circle Chart:

how-to-copy-formatting-in-excel

Sankey Chart:

how-to-copy-formatting-in-excel

Multi Axis Line Chart:

how-to-copy-formatting-in-excel

Stacked Waterfall Chart:

how-to-copy-formatting-in-excel

Horizontal Waterfall Chart:

how-to-copy-formatting-in-excel

Why is Excel’s Copy Formatting Useful?

Ever open an Excel sheet and instantly feel the difference? Some look clean and organized—others feel like a mess. What’s the secret? Often, it’s simply good formatting. Knowing how to copy formatting in Excel can significantly enhance your workflow. Here’s why it’s a tool worth using every day:

  • Keeps things consistent: Whether it’s reports or dashboards, copied formatting gives everything a clean, professional feel—no more mismatched styles.
  • Saves time: Instead of redoing fonts, borders, and colors, apply them once and reuse them. This is ideal when consolidating data or building dashboards.
  • Boosts readability: Well-formatted sheets guide the eye. If you’re turning your sheet into a PDF, it’ll look way more polished.
  • Reduces mistakes: It’s easy to miss a detail when formatting manually. Copying helps you avoid errors, such as using random fonts or colors.
  • Helps with teamwork: When multiple people work on the same file, consistent formatting makes everything look aligned. It doesn’t matter whether you’re eliminating duplicates in Excel or updating reports. It works in all scenarios.

When to Use Copy Formatting in Excel?

Have you ever spent time perfecting a table, only to redo it again and again? You’re not alone. Knowing how to copy formatting in Excel can save you from that endless loop. It’s more than a quick fix — it’s a smart way to work. Here are the key moments when copy formatting makes a real difference:

  • Creating uniform reports and templates: Reports and templates need a clean, professional look. Copy formatting ensures every header, title, and section follows the same style, even when reused.
  • Duplicating table designs and conditional formatting: Tables often require specific fonts, borders, or highlights. Copying formats — including Automatic Formatting in Excel and conditional rules — keeps your tables consistent and clear.
  • Highlighting key data without errors: Ensure your most important numbers stand out. Using copied formats helps highlight data fast, reducing the risk of missing critical points.
  • Fixing inconsistent styles and imported data: Imported data often comes in a messy and mismatched state. A quick format copy helps clean it up and align styles, making data modelling in Excel easier.
  • Streamlining collaborative workbooks: Styles can get messy when teams share files. Copying formatting ensures your workbook looks unified, even after multiple people touch it.
  • Reformatting for presentations or PDFs: Before saving your Excel data as a PDF or presenting it, ensure it is polished and error-free. A copied format guarantees everything looks right on the first try.

How to Copy Formatting in Excel?

Ever catch yourself doing the same formatting in Excel again and again? Bold the header, add some borders, change the font—then repeat the same thing on another sheet. It gets exhausting real quick. The good news? You don’t have to keep doing that. Once you know how to copy formatting in Excel, your workflow gets way smoother. Here’s how to make Excel do more of the heavy lifting:

  1. Use Paste Special (Formats): Copy the cell that looks good. Right-click where you want the same style, and choose “Paste Special → Formats”. It’s great when you’re cleaning things up or transforming messy data.
  2. Try Format Painter: Click the cell with the desired formatting, tap the paintbrush icon, and apply it to the other cells as needed. It’s fast, easy, and super useful when working with big sheets or organizing sorted data.
  3. Use a Quick Shortcut: There’s no one-button solution. But there’s a handy combo: Ctrl + C to copy, then Alt + E + S + T to paste just the formatting. No need to dig through menus.
  4. Use a drag-and-drop menu to copy cell format: Right-drag the cell’s edge, drop it on the target cell, and select “formats only” from the pop-up menu. This is handy for quick formatting while rearranging data or preparing sheets for data consolidation in Excel.
  5. Copy formatting with fill handle: Drag the fill handle (the small square at a cell’s corner) while holding Ctrl. Excel will copy both the data and the formatting. This is a smart move when expanding tables or setting up repeat entries.

How to Analyze Copied and Formatted Data in Excel?

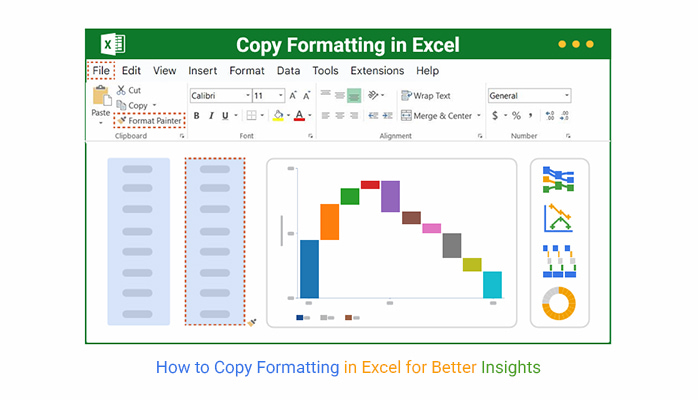
Excel is excellent — until your data needs to look sharp. You spend hours crunching numbers, but presenting them? Excel begins to stumble. Yes, you can color cells and bold headers, but real data visualization requires more.

Knowing how to copy formatting in Excel helps, but it won’t fix clunky charts or bland visuals. That’s where ChartExpo steps in. It plugs into Excel and turns your data into clear, stunning visuals — without the usual hassle.

How to Install ChartExpo in Excel?

  1. Open your Excel application.
  2. Open the worksheet and click the “Insert” menu.
  3. You’ll see the “My Apps” option.
  4. In the Office Add-ins window, click “Store” and search for ChartExpo on the My Apps Store.
  5. Click the “Add” button to install ChartExpo in your Excel.

ChartExpo charts are available both in Google Sheets and Microsoft Excel. Please use the following CTAs to install the tool of your choice and create beautiful visualizations with a few clicks in your favorite tool.

Example

Let’s visualize and analyze this sample data in Excel using ChartExpo.

Task Name Progress (%)
Research Phase 100
Data Collection 60
Report Drafting 30
Review & Edits 50
Final Approval 20
Implementation 50
  • To get started with ChartExpo, install ChartExpo in Excel.
  • Now, click on My Apps from the INSERT menu.
how-to-copy-formatting-in-excel
  • Choose ChartExpo from My Apps, then click Insert.
how-to-copy-formatting-in-excel
  • Once it loads, scroll through the charts list to locate and choose the “Progress Circle Chart”.
how-to-copy-formatting-in-excel
  • The Progress Circle Chart will appear as follows.
how-to-copy-formatting-in-excel
  • Click the “Create Chart From Selection” button after selecting the data from the sheet, as shown.
how-to-copy-formatting-in-excel
  • ChartExpo will generate the visualization below for you.
how-to-copy-formatting-in-excel
  • If you want to add anything to the chart, click the Edit Chart button:
  • Click the pencil icon next to the Chart Header to change the title.
  • It will open the properties dialog. Under the Text section, you can add a heading in Line 1 and enable Show.
  • Give the appropriate title of your chart and click the Apply button.
how-to-copy-formatting-in-excel
  • You can add the (%) with all values:
how-to-copy-formatting-in-excel
  • You can change the data type by clicking on the settings button as follows:
how-to-copy-formatting-in-excel
  • Click the “Save Changes” button to persist the changes made to the chart.
how-to-copy-formatting-in-excel
  • Your final Progress Circle Chart will look like the one below.
how-to-copy-formatting-in-excel

Insights

  • Research phase — 100% complete.
  • Data collection — 60% progress.
  • Implementation — 50% progress.
  • Report drafting — 30%, needs focus.
  • Review & edits — 50%, requires attention.
  • Final approval — 20%, needs priority.

Tips for Copy Formatting in Excel

Have you ever tried copying a format in Excel and ended up with a messy sheet? It happens. Knowing how to copy formatting in Excel is one thing — using it wisely is another. Here are six tips that help you copy formatting like a pro and avoid common mistakes:

  • Use Format Painter and shortcuts for speed: Format Painter is your best friend for quick formatting. Combine it with keyboard shortcuts to save significant time, especially during data consolidation tasks in Excel.
  • Copy formatting without moving data: Always choose options like “Formats Only” when you want the look, not the content. This trick works well when setting up reports for organizing data in Excel.
  • Clear old formats before applying new ones: Clearing existing formats before pasting new ones avoids weird overlaps. A clean slate gives your formatting a sharper impact.
  • Apply to full rows or columns with care: Copying the formatting to the entire rows or columns saves time. But remember to check your ranges. It’s great for big tables or setting up automatic formatting in Excel.
  • Handle conditional formatting and merged cells wisely: Conditional formatting follows different rules, so double-check before copying to ensure accuracy. Watch out for merged cells; they can distort your layout if you’re not careful.
  • Use cell styles and always preview first: Cell Styles help you reuse formats across workbooks with ease. Before applying, take a quick look — a two-second preview saves a two-hour fix.

FAQs

Is there a way to copy formatting in Excel?

Yes, you can copy formatting in Excel. Use Format Painter or Paste Special for quick results. Both allow you to apply styles without modifying the data. These tools work well when organizing sheets or performing data transformation in Excel.

What is the shortcut to copy format in Excel?

Use Ctrl+C to copy the cell, then press Alt+E+S+T to paste the formats. This shortcut applies the formatting only. It’s handy for reports, especially when you’re working on data modeling in Excel or summaries.

Wrap Up

Copying formatting in Excel is a simple but powerful tool. It helps make your sheets clear and professional. With the proper techniques, you can save time and avoid errors. Whether you use Format Painter, Paste Special, or shortcuts, the result is the same. Your data looks neat and stays consistent. That’s a big win for both daily tasks and big projects.

When your data is well formatted, exporting it matters. Knowing how to save an Excel file as a PDF ensures your work looks professional when shared. Clean formats and polished layouts leave a lasting impression.

Good formatting also helps with data tasks. If you know how to extrapolate in Excel, clear formats make trends easier to spot. It turns numbers into meaningful insights.

Working with different layouts? Learn how to transpose Data in Excel and combine it with copy formatting. You’ll have data that’s both flexible and easy to read.

Conclusively, Excel has limits, but smart formatting makes a difference. It enhances your reports, fosters collaboration, and reduces wasted time. Install ChartExpo, master it, and use it with your formatted data. Your Excel work will become faster, cleaner, and more effective.

How much did you enjoy this article?

ExcelAd1
Start Free Trial!
156695

Related articles

next previous
Microsoft Excel9 min read

Group Worksheets in Excel for Quick Insights

Discover how to group worksheets in Excel to update multiple sheets at once. Learn with clear steps, visuals, and tips to save time and reduce errors.

Microsoft Excel11 min read

CSV vs. Excel: A Quick Comparison for Everyday

CSV vs. Excel explains the key differences and when to use each. Discover practical tips, tables, and charts to manage and analyze your data better.

Microsoft Excel12 min read

Financial Graphs and Charts in Excel: Tips and Best Practices

Explore financial charts and graphs to improve data analysis, reveal trends, and make smarter business decisions with clear visual insights.

Microsoft Excel12 min read

Export Jira to Excel: Insights Made Easy

Learn how to export Jira to Excel for better data analysis and reporting. You’ll discover methods, tips, and visuals to turn your data into actionable insights.

Microsoft Excel11 min read

Hlookup in Excel: The Key to Faster Analysis

HLOOKUP in Excel enables you to find data across rows quickly. This blog will show you how to use it, avoid common errors, and enhance data visualizations.

ChartExpo logo

Turn Data into Visual
Stories

CHARTEXPO

  • Home
  • Gallery
  • Videos
  • Services
  • Pricing
  • Contact us
  • FAQs
  • Privacy policy
  • Terms of Service
  • Sitemap

TOOLS

  • ChartExpo for Google Sheets
  • ChartExpo for Microsoft Excel
  • Power BI Custom Visuals by ChartExpo
  • Word Cloud

CATEGORIES

  • Bar Charts
  • Circle Graphs
  • Column Charts
  • Combo Charts
  • Comparison Charts
  • Line Graphs
  • PPC Charts
  • Sentiment Analysis Charts
  • Survey Charts

TOP CHARTS

  • Sankey Diagram
  • Likert Scale Chart
  • Comparison Bar Chart
  • Pareto Chart
  • Funnel Chart
  • Gauge Chart
  • Radar Chart
  • Radial Bar Chart
  • Sunburst Chart
  • see more
  • Scatter Plot Chart
  • CSAT Survey Bar Chart
  • CSAT Survey Chart
  • Dot Plot Chart
  • Double Bar Graph
  • Matrix Chart
  • Multi Axis Line Chart
  • Overlapping Bar Chart
  • Control Chart
  • Slope Chart
  • Clustered Bar Chart
  • Clustered Column Chart
  • Box and Whisker Plot
  • Tornado Chart
  • Waterfall Chart
  • Word Cloud
  • see less

RESOURCES

  • Blog
  • Resources
  • YouTube
SIGN UP FOR UPDATES

We wouldn't dream of spamming you or selling your info.

© 2025 ChartExpo, all rights reserved.