Categories
Custom sorting in Excel—why would you need it? Imagine managing a list of hundreds of names, dates, or sales figures. The default sorting options often fail to provide the structure you need. That’s where custom sorting steps in to save time and frustration. It empowers you to arrange data in a way that makes sense for your goals.


Custom sorting in Excel allows you to dig deeper. Organizing product categories by popularity or prioritizing tasks by urgency creates order in ways that default sorting can’t. It structures data from online forms to Excel, making analysis faster and easier to manage.
Custom sorting turns a cluttered spreadsheet into an actionable resource. It’s handy for repetitive tasks or complex datasets, where precision matters most. When paired with cross-tabulation in Excel, it enhances your ability to compare and analyze data across multiple variables.
Custom sorting in Excel lets you sort months by calendar order or prioritize sales regions. The ability to refine data presentation is no longer optional but essential. Custom sorting helps you stay on top of your data and ensures clarity. Pair it with custom Excel charts to make your data organized and visually impactful.
Custom sorting is a simple step with a big impact. It makes Excel a more powerful ally for any professional.
Let’s dive deeper.
Definition: Custom sorting in Excel lets you organize data your way. It goes beyond default options like alphabetical or numerical order. How? You can define specific sequences, such as sorting months in calendar order or arranging items by priority.
This feature is ideal for datasets requiring a personalized structure, such as grouping products by category. It also works well for organizing tasks by urgency or other custom criteria. Pair it with tools to eliminate duplicates in Excel, and your data becomes cleaner and more reliable.
Custom sorting makes your data easier to analyze and understand. It’s a simple tool that adds flexibility and precision to your work.
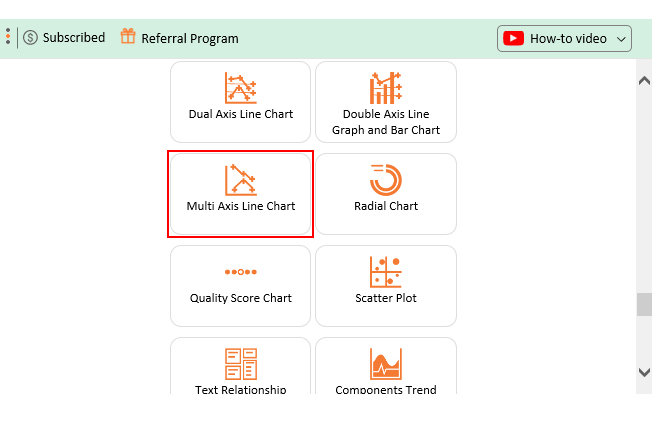
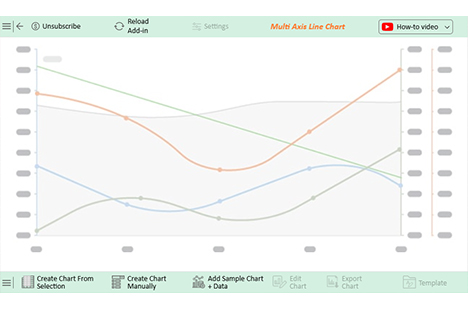
Understanding Custom Sorting in Excel in Power BI Using Multi Axis Line Chart to Organize Data Efficiently
Why do custom sorting in Excel? Because it changes how you use your data. Sort it your way for smarter work. It improves data analysis by making trends and insights easier to find;
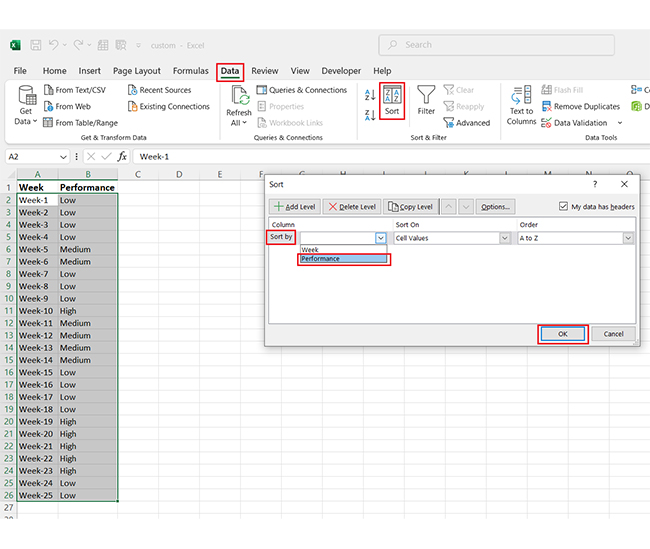
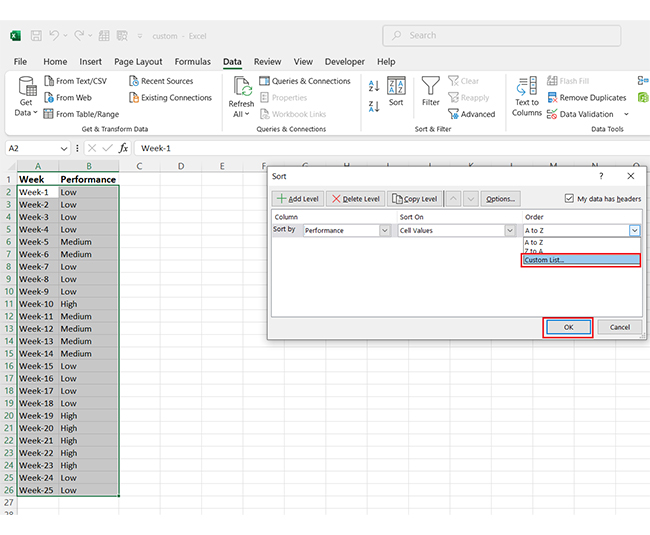
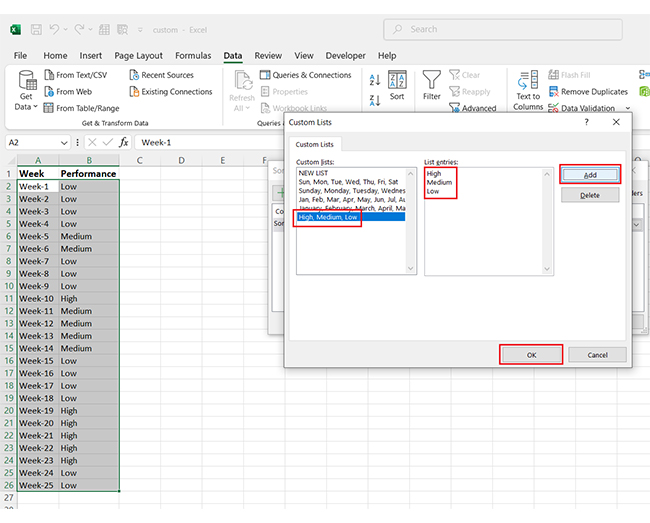
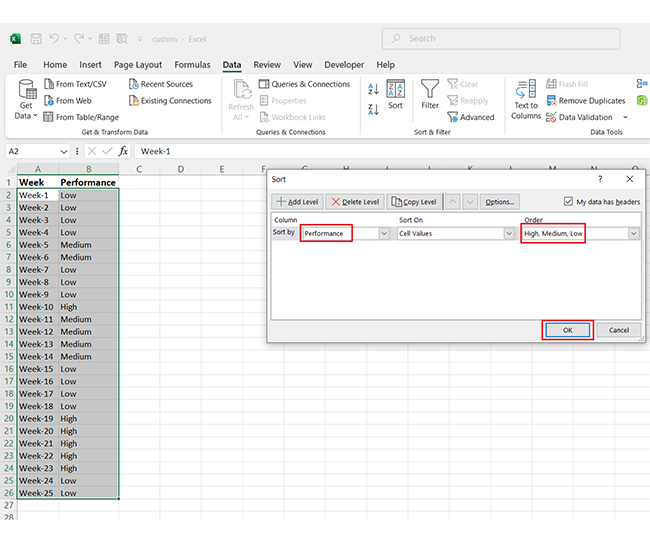
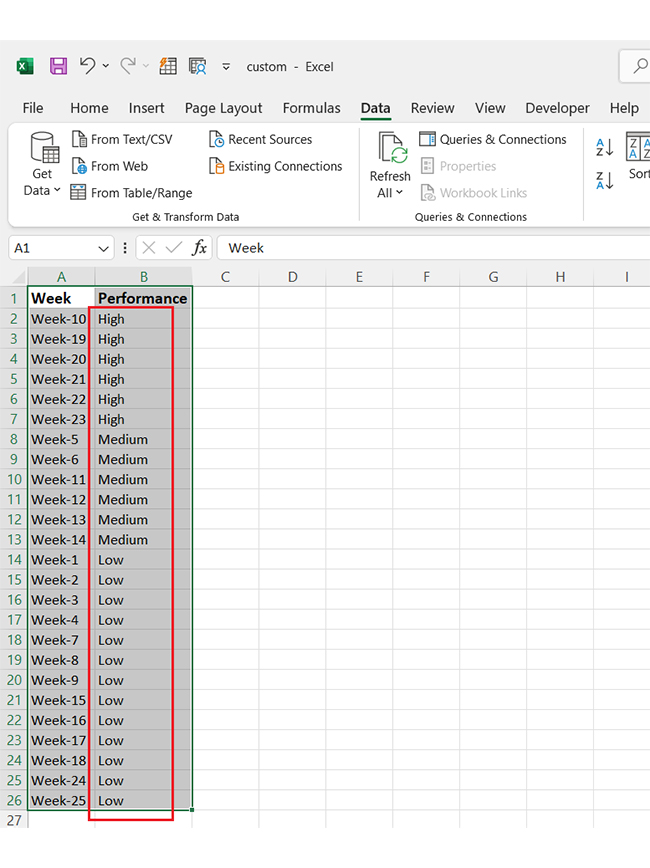
Creating a custom list sort in Excel is a great way to bring order to your data and save time. You can also improve visual storytelling by organizing data meaningfully. Let’s break it down step by step:
Data analysis thrives on clear insights, but Excel often falls short in data visualization. Sure, it’s great for organizing data, but making it visually impactful? Not so much.
That’s where custom sorting becomes your secret weapon, bringing order to chaos. But for next-level visual storytelling, Excel alone isn’t enough. You need data visualization tools to create stunning graphs and charts for your data.
Enter ChartExpo. This tool effortlessly transforms your sorted data into clear, actionable, next-level charts like the Tornado Chart or Scatter chart.
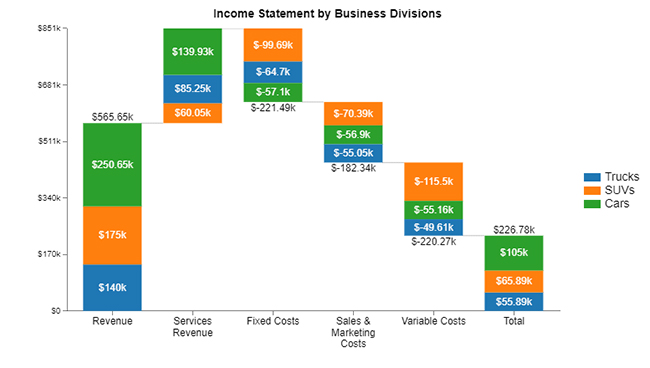
The following five charts, including the Waterfall chart in Excel, are ideal for analyzing a custom-sorted list in Excel.
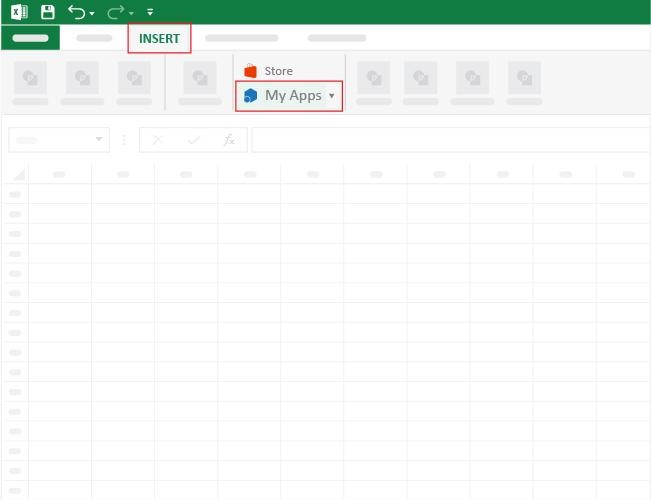
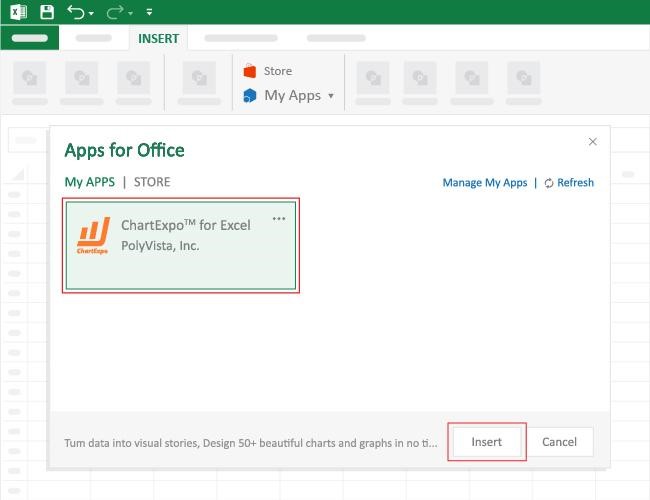
How to Install ChartExpo in Excel?
ChartExpo charts are available both in Google Sheets and Microsoft Excel. Please use the following CTAs to install the tool of your choice and create beautiful visualizations with a few clicks in your favorite tool.
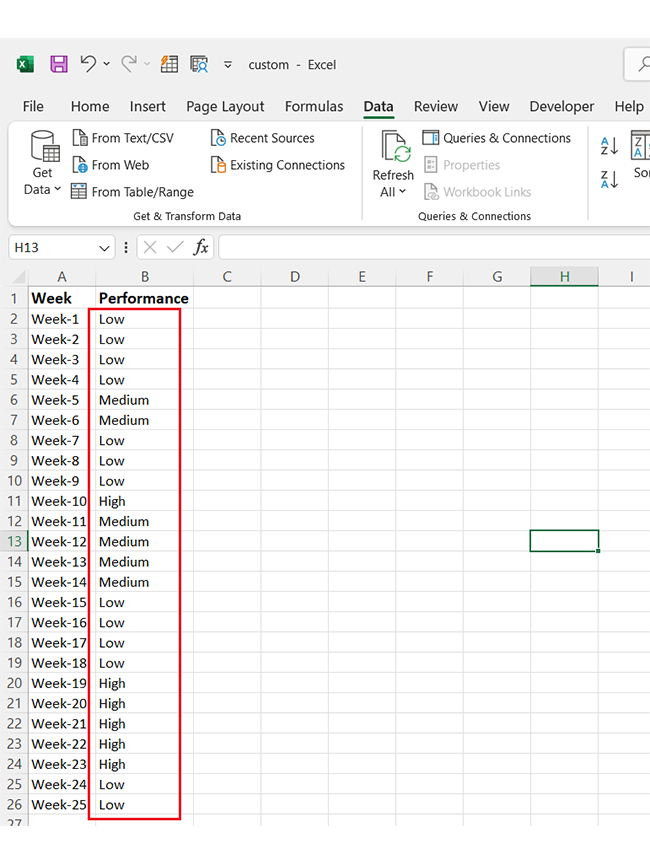
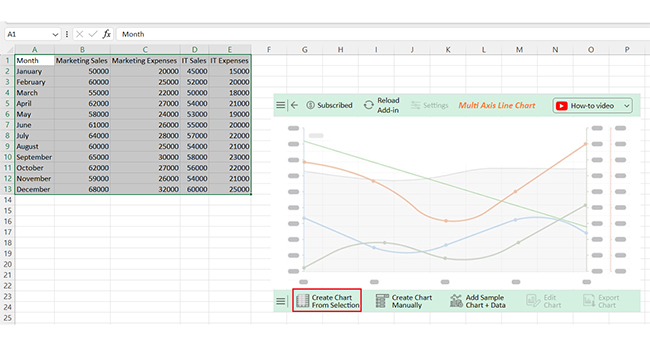
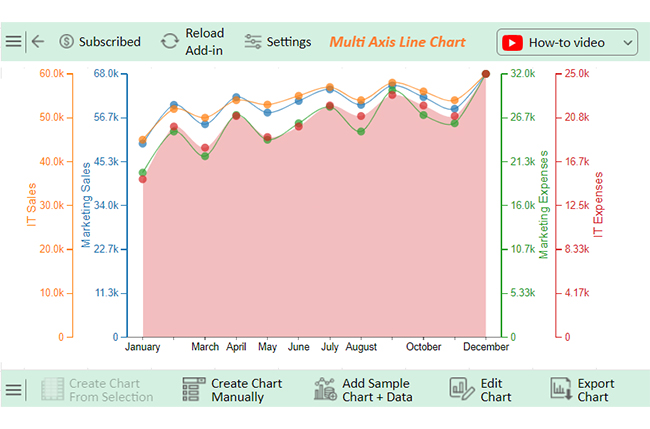
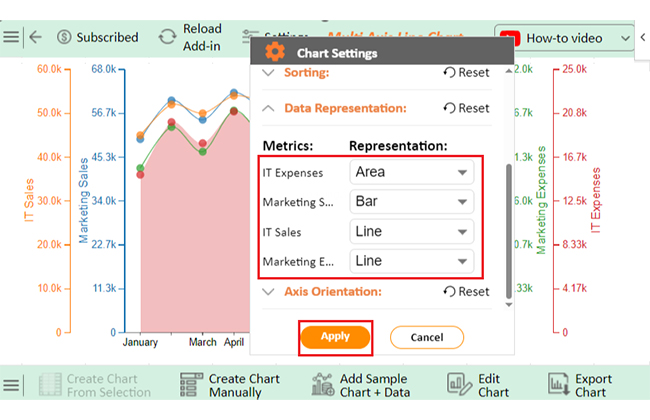
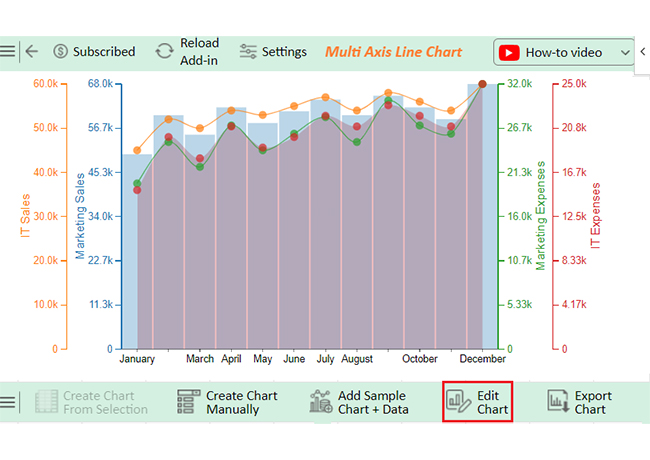
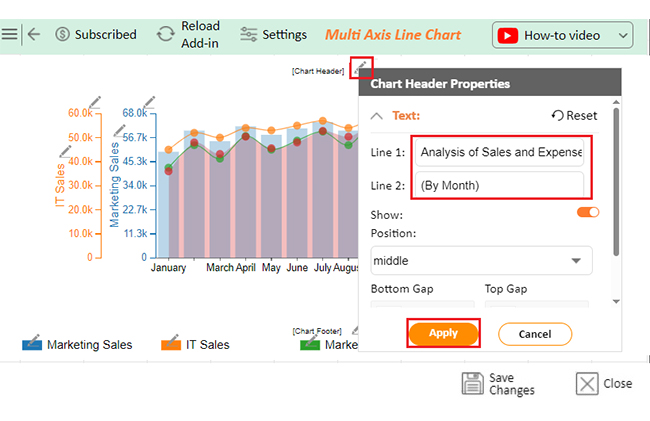
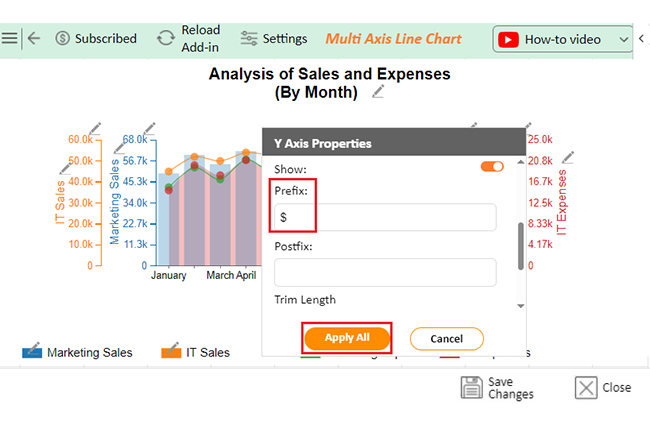
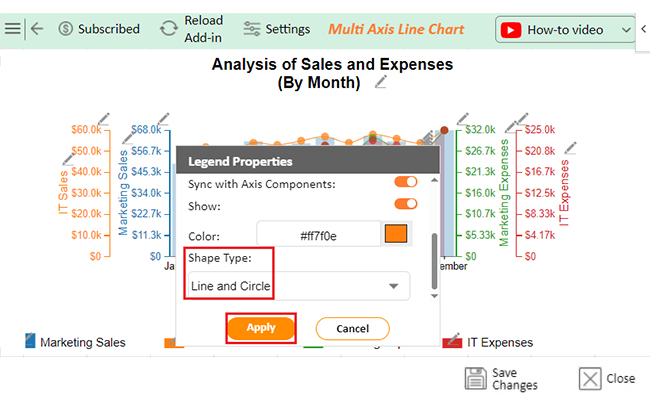
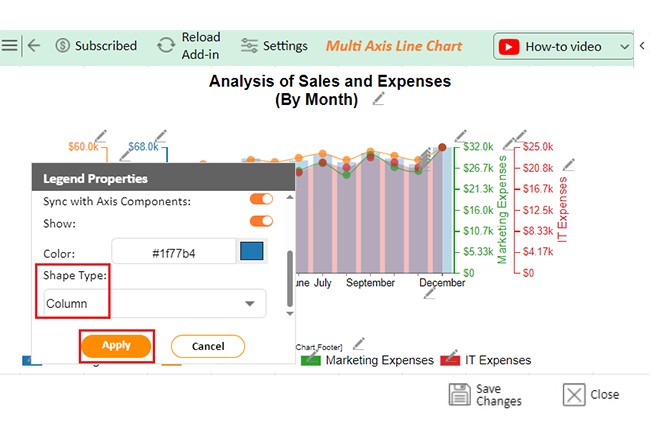
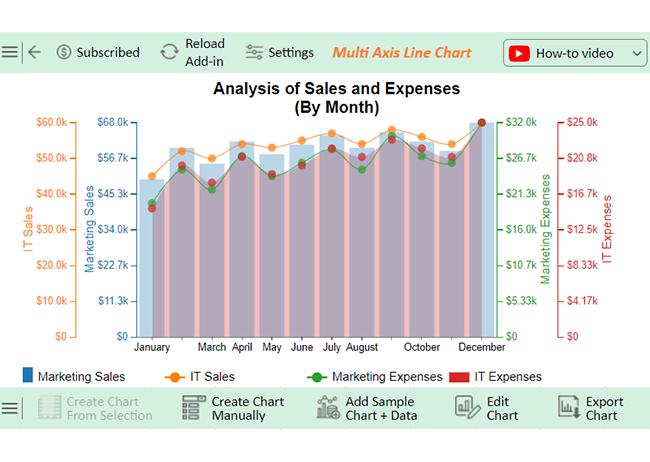
Let’s analyze this sample data and learn how to add a data label to Excel charts using ChartExpo;
| Month | Marketing Sales | Marketing Expenses | IT Sales | IT Expenses |
| January | 50000 | 20000 | 45000 | 15000 |
| February | 60000 | 25000 | 52000 | 20000 |
| March | 55000 | 22000 | 50000 | 18000 |
| April | 62000 | 27000 | 54000 | 21000 |
| May | 58000 | 24000 | 53000 | 19000 |
| June | 61000 | 26000 | 55000 | 20000 |
| July | 64000 | 28000 | 57000 | 22000 |
| August | 60000 | 25000 | 54000 | 21000 |
| September | 65000 | 30000 | 58000 | 23000 |
| October | 62000 | 27000 | 56000 | 22000 |
| November | 59000 | 26000 | 54000 | 21000 |
| December | 68000 | 32000 | 60000 | 25000 |
Sorting data in Excel sounds simple. But what if you need more than alphabetical or numerical order? Custom sort orders shine here, giving you control over your data. They also enhance data storytelling by organizing information meaningfully. However, there are strengths and challenges.
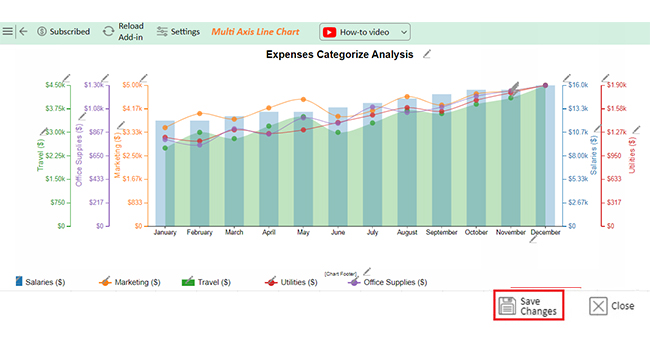
To create a custom sort bar chart in Excel;
Custom sorting in Excel is more than a tool; it’s a game-changer. It lets you easily control your data and work smarter, not harder.
Improved data analysis is a key benefit. Custom sorting helps uncover trends and patterns, making decision-making faster and more accurate. Combined with data from Google Forms to Excel, it streamlines your workflow and provides deeper insights.
Another advantage is enhanced presentation. A well-organized spreadsheet looks professional and ensures your data tells a clear and compelling story. This is useful when preparing business graphs to present key metrics effectively.
Efficiency is also greatly improved. Custom sorting saves time by automating repetitive tasks. Once set, your preferences are ready for future use. You can quickly sort and analyze survey responses with an Excel survey template.
Tailored organization makes your data unique to your needs. Whether sorting by priority or creating custom categories, the flexibility is unmatched. It adapts to your specific goals and workflows.
Custom sorting in Excel turns data chaos into clarity. It’s a simple yet powerful feature every professional should use.
Do not hesitate.
Start customizing your data today for better results tomorrow. Install ChartExpo for easy data visualization and enhanced reporting.
How much did you enjoy this article?


Learn how to use sparklines in Excel to quickly visualize trends inside cells. Discover types, creation steps, customization, use cases, benefits, and best practices.

Learn what a confidence interval graph is, how to create it in Excel, and how to interpret results to make more reliable, data-driven decisions.

A correlation matrix in Excel helps identify relationships between variables. Learn how to create, read, and use it for effective data analysis.


