• Home
  • Tools dropdown img
    • Spreadsheet Charts

      • ChartExpo for Google Sheets
      • ChartExpo for Microsoft Excel
    • Power BI Charts

      • Power BI Custom Visuals by ChartExpo
    • Word Cloud

  • Charts dropdown img
    • Chart Category

      • Bar Charts
      • Circle Graphs
      • Column Charts
      • Combo Charts
      • Comparison Charts
      • Line Graphs
      • PPC Charts
      • Sentiment Analysis Charts
      • Survey Charts
    • Chart Type

      • Box and Whisker Plot
      • Clustered Bar Chart
      • Clustered Column Chart
      • Comparison Bar Chart
      • Control Chart
      • CSAT Survey Bar Chart
      • CSAT Survey Chart
      • Dot Plot Chart
      • Double Bar Graph
      • Funnel Chart
      • Gauge Chart
      • Likert Scale Chart
      • Matrix Chart
      • Multi Axis Line Chart
      • Overlapping Bar Chart
      • Pareto Chart
      • Radar Chart
      • Radial Bar Chart
      • Sankey Diagram
      • Scatter Plot Chart
      • Slope Chart
      • Sunburst Chart
      • Tornado Chart
      • Waterfall Chart
      • Word Cloud
    • Google Sheets
      Microsoft Excel
  • Services
  • Pricing
  • Contact us
  • Blog
  • Support dropdown img
      • Gallery
      • Videos
      • Contact us
      • FAQs
      • Resources
    • Please feel free to contact us

      atsupport@chartexpo.com

Categories
All Data Visualizations Data Analytics Surveys
Add-ons/
  • Google Sheets
  • Microsoft Excel
  • Power BI
All Data Visualizations Data Analytics Surveys
Add-ons
  • Google Sheets
  • Microsoft Excel
  • Power BI

We use cookies

This website uses cookies to provide better user experience and user's session management.
By continuing visiting this website you consent the use of these cookies.

Ok

ChartExpo Survey


Home > Blog > Google Sheets

Import CSV to Google Sheets: A Quick Walkthrough

Import CSV to Google Sheets—why does it matter so much? CSV files are one of the most common formats for storing data. Businesses, marketers, teachers, and even sports teams rely on them. So, the ability to import CSV to Google Sheets efficiently is not optional—it’s essential.

Import CSV to Google Sheets

Google Sheets is a free, cloud-based tool that makes collaboration easy. However, spreadsheets only become useful when they’re filled with data that means something. That’s where importing CSV files changes the game. CSV files contain raw information, including sales figures, customer feedback, and stock prices.

The best part? You don’t need to be a spreadsheet expert to do it. Drag, drop, and the data is there. The quick process supports single or multiple sources using the IMPORTRANGE in Google Sheets. No fluff, no complications.

Once imported, you can analyze, visualize, and share the data. Want to track time for remote teams? Combine CSV inputs with Google Sheets time-tracking tools. Need to run reports? You’re already halfway there with your data structured and ready.

Think of how many times people have manually copied and pasted thousands of rows. It wastes time and increases the chance of errors. Automation starts with one move: import CSV to Google Sheets. It’s clean and efficient, and it saves hours.

How? Let’s dive in…

Table of Contents:

  1. What is Meant by the Import of CSV to Google Sheets?
  2. Why Import CSV to Google Sheets?
  3. How to Import CSV Into Google Sheets in Different Ways?
  4. How to Analyze an Imported CSV in Google Sheets?
  5. Disadvantages of Converting CSV to Google Spreadsheet
  6. What are the Tips for Importing CSV in Google Sheets?
  7. FAQs
  8. Wrap Up

What is Meant by the Import of CSV to Google Sheets?

Definition: Importing CSV to Google Sheets means uploading a CSV  file into a Google Sheet for viewing or editing. It allows you to open structured data from other sources in a clean spreadsheet format.

This import is useful for managing finances, sales, or reports. You can combine it with a budget on Google Sheets to track spending. Or use VLOOKUP for Google Sheets to pull matching data from imported files. It’s a fast way to work with real data.
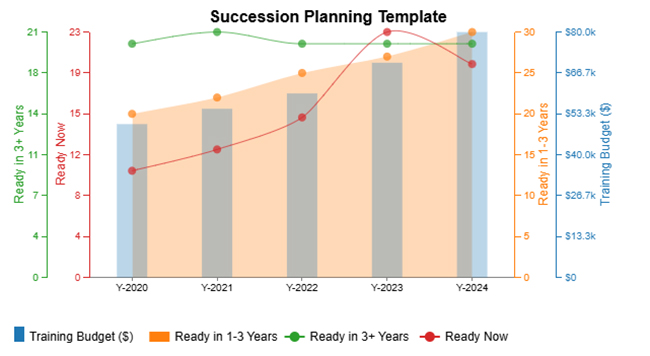
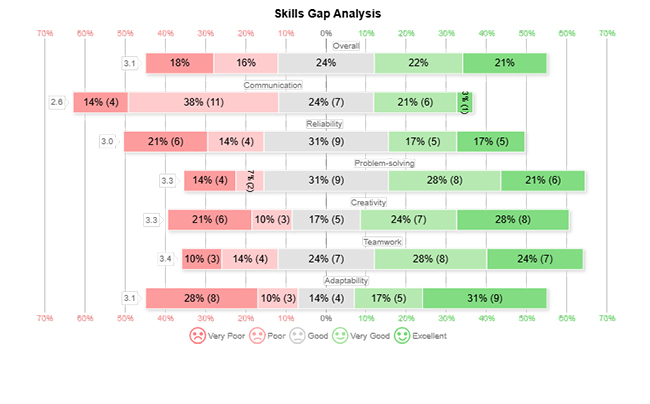
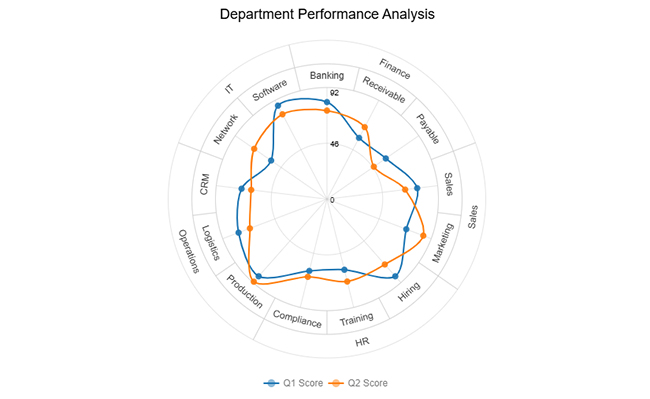
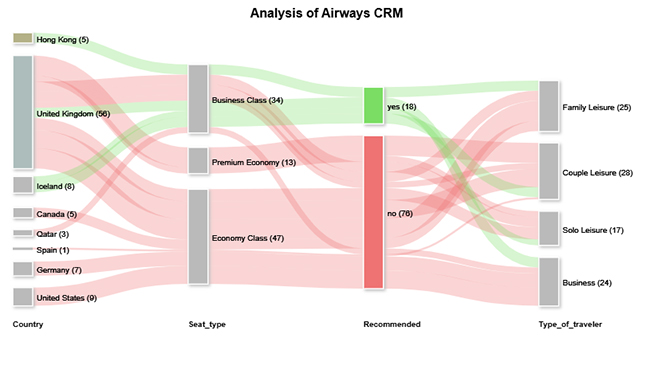
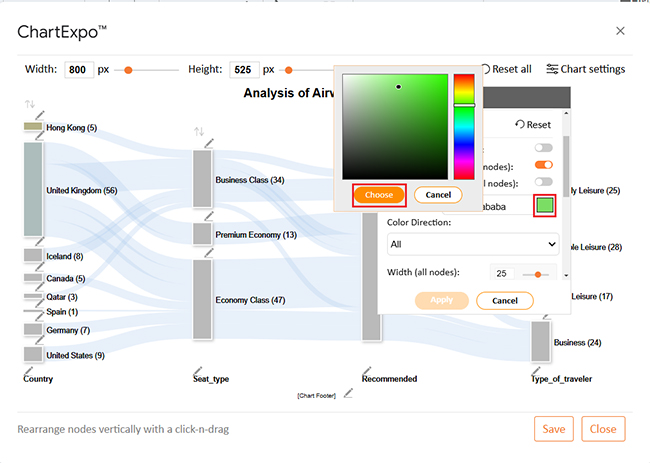
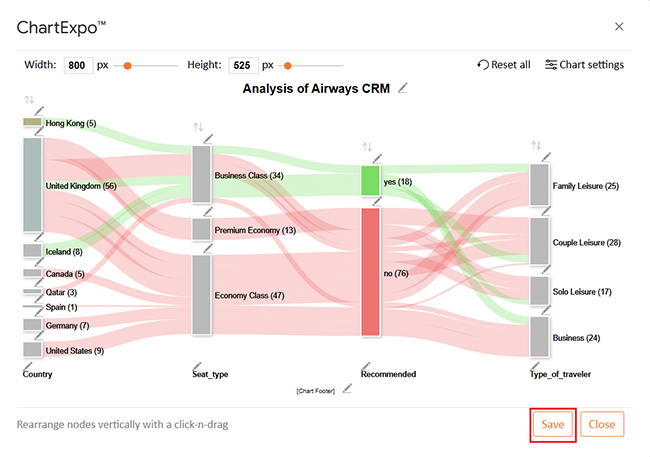
Top Charts can be created after importing CSV Data into Google Sheets:

The charts below contain CSV data imported to Google Sheets and were created using ChartExpo.

Multi Axis Line Chart:

Import CSV to Google Sheets

Likert Scale Chart:

Import CSV to Google Sheets

Circular Org Chart:

Import CSV to Google Sheets

Sankey Chart:

Import CSV to Google Sheets

Clustered Stacked Bar Chart:

Import CSV to Google Sheets

Why Import CSV to Google Sheets?

Have you ever felt stuck staring at a CSV file, wondering how to make sense? You’re not alone. Data is powerful—but only when accessible, shareable, and easy to analyze. That’s why more people import CSV to Google Sheets. It’s simple, smart, and gets your data working for you. Here’s why it matters:

  • Seamless data access: Importing a CSV into Google Sheets takes seconds. You can view and edit the file from any device with internet access—no installs needed.
  • Cloud-based convenience: Your spreadsheet lives in the cloud – you never lose your work. Combine that with how to share a Google Sheet training, and your team stays connected without version confusion.
  • Real-time collaboration: Once imported, multiple people can edit or comment simultaneously. Updates appear instantly, keeping everyone on the same page.
  • Built-in data tools: Google Sheets offers filters, conditional formatting, and charts to analyze your data fast. Want cleaner data? Use the remove duplicates in Google Sheets with a click.
  • Automation and integration: Connect different spreadsheets using IMPORTRANGE in Google Sheets to automate data flow between sources. You can even build workflows using add-ons or a Google Sheets extension to pull updates automatically.

How to Import CSV Into Google Sheets in Different Ways?

You’ve got a CSV file and a deadline. Now what? You could open Excel, deal with formatting, and email versions back and forth. Or, you could import CSV to Google Sheets—and do it smartly. There’s more than one way to get it done.

The bottom line? Choose the method that fits your workflow best:

  1. Manual upload via file menu: Open a blank Google Sheet. Click File > Import > Upload, then drag in your CSV. This happens in seconds, and no tech skills are needed.
  2. Using Google Drive: Right-click your CSV file in Google Drive. Choose Open with > Google Sheets, and it converts automatically. It is perfect if you’re managing a budget on Google Sheets with shared files.
  3. Import via URL with formula: Got a live CSV file online? Use the =IMPORTDATA(“URL”) formula directly in a cell. Combine that with Google Finance in Google Sheets to pull real-time stock or market data.
  4. Using Google Apps Script: Need to automate regular imports? Write a simple Google Apps Script that grabs CSV data on a schedule. Then, pair it with Google Sheets time tracking for automatic logging from external systems.

How to Analyze an Imported CSV in Google Sheets?

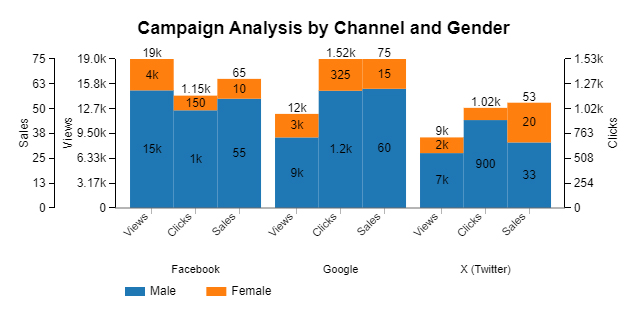
Are you drowning in spreadsheets? You’re not alone. We all start with the same thing: raw, boring data, usually in a CSV file. That’s where the magic begins. Importing CSV to Google Sheets turns lifeless rows into something readable.

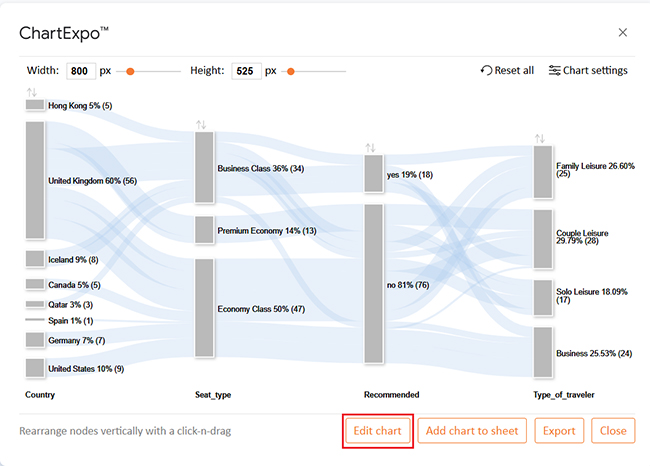
But here’s the catch: Google Sheets isn’t a visual genius once the data flows in. You can make basic charts, but that’s where it taps out—especially when you need advanced visuals like a Sankey Plot to understand flow and relationships.

I have a solution for you. Meet your new data sidekick—ChartExpo. This tool is ideal for deeper insights and sharper visuals. How?

It simplifies data analysis with advanced, visually striking charts that reveal deep insights at a glance.

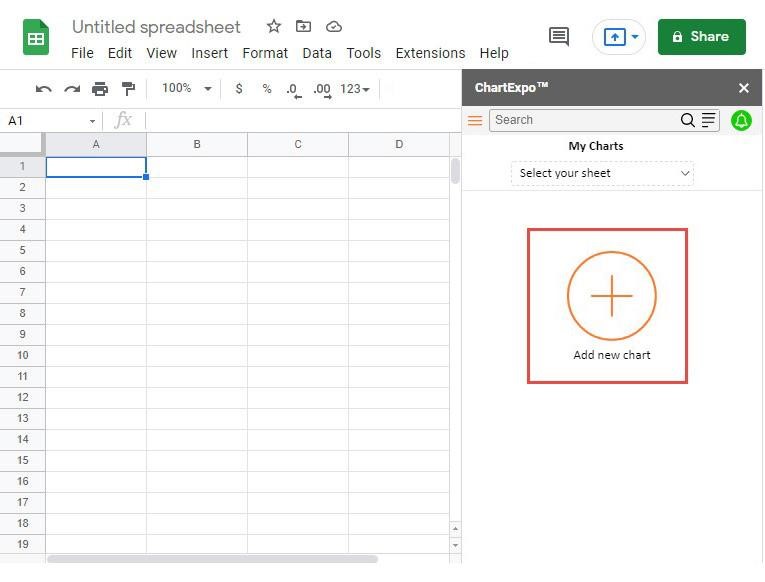
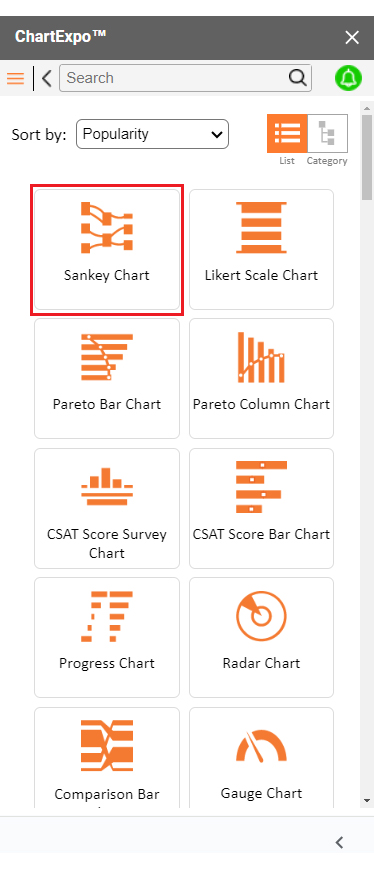
How to Install ChartExpo in Google Sheets?

  1. To start using ChartExpo, download it directly from the Google Sheets program. To do this, select Extensions from the top toolbar.
  2. A menu will appear. Click the Get add-ons option.
  3. Search for ChartExpo, and click on Charts, Graphs & Visualizations by ChartExpo when it appears in the results.
  4. Click the Install button. You will have to confirm your Google account and accept some permissions.

ChartExpo charts are available both in Google Sheets and Microsoft Excel. Please use the following CTAs to install the tool of your choice and create beautiful visualizations in a few clicks in your favorite tool.

Example

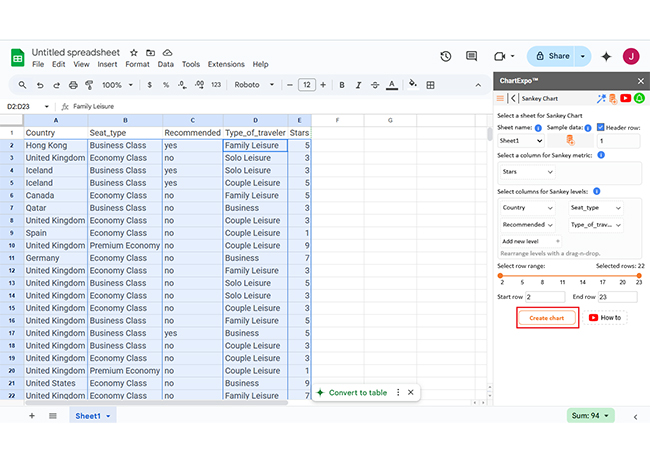
Let’s visualize and analyze this sample data in Google Sheets using ChartExpo.

Country Seat_type Recommended Type_of_traveler Stars
Hong Kong Business Class yes Family Leisure 5
United Kingdom Economy Class no Solo Leisure 3
Iceland Business Class yes Solo Leisure 3
Iceland Business Class yes Couple Leisure 5
Canada Economy Class no Family Leisure 5
Qatar Business Class no Business 3
United Kingdom Economy Class no Couple Leisure 3
Spain Economy Class no Couple Leisure 1
United Kingdom Premium Economy no Couple Leisure 9
Germany Economy Class no Business 7
United Kingdom Economy Class no Family Leisure 3
United Kingdom Business Class no Solo Leisure 5
United Kingdom Economy Class no Solo Leisure 3
United Kingdom Economy Class no Couple Leisure 3
United Kingdom Business Class no Family Leisure 5
United Kingdom Business Class yes Business 5
United Kingdom Business Class no Couple Leisure 3
United Kingdom Economy Class no Couple Leisure 3
United Kingdom Premium Economy no Couple Leisure 1
United States Economy Class no Business 9
United Kingdom Economy Class no Family Leisure 7
United Kingdom Premium Economy no Solo Leisure 3
  • To get started with ChartExpo, install ChartExpo in Google Sheets.
  • Go to Extensions > Charts, Graphs & Visualizations by ChartExpo > Open.
Import CSV to Google Sheets
  • To access the charts library, click the Add new chart button.
Import CSV to Google Sheets
  • Once ChartExpo is loaded. Click on “Sankey Chart”.
Import CSV to Google Sheets
  • Put the data table in the sheet first. Then, choose the Sheet name from the drop-down in the ChartExpo section.
  • Select the metric column; metric is the numeric column in your data sheet.
  • Select the dimensions column; the dimension is the categorical column in your datasheet that contains text information.
  • Click the Create chart button to complete the process.
Import CSV to Google Sheets
  • ChartExpo will generate the visualization below for you.
Import CSV to Google Sheets
  • If you want to have the chart’s title, click Edit Chart, as shown in the above image.
  • Click the pencil icon next to the Chart Header to change the title.
  • It will open the properties dialog. Under the Text section, you can add a heading in Line 1 and enable Show.
  • Give the appropriate title of your chart and click the Apply button.
Import CSV to Google Sheets
  • You can disable the percentage values as follows:
Import CSV to Google Sheets
  • You can add color in Nodes and set the direction as follows:
Import CSV to Google Sheets
  • Click the “Save Changes” button to persist the changes.
Import CSV to Google Sheets
  • Your final Sankey Plot will appear as follows.
Import CSV to Google Sheets

Insights

  • Business Class is the top recommendation, especially for Family Leisure and Solo Leisure travelers.
  • The United Kingdom appears most frequently, mainly in Economy Class, with lower star ratings.
  • Premium Economy shows wide rating variation, reflecting mixed traveler experiences.

Disadvantages of Converting CSV to Google Spreadsheet

Importing CSV to Google Sheets is quick and easy. But it’s not always perfect. Despite its speed, this process has limits—issues may arise with large data, sensitive info, or complex reports. Here’s what to watch out for:

  • Data size limitations: Google Sheets has limits of 10 million cells per spreadsheet. Try importing a massive CSV, which might freeze or cut off your data.
  • Formatting loss: CSV files don’t carry over styles, formulas, or charts. When you convert, you may lose the important structure in another app.
  • Limited functionality for complex data: Nested tables, pivot reports, or multi-sheet logic may not transfer well. If your original data is heavily structured, Sheets might flatten it too much.
  • Automatic type detection errors: Google Sheets tries to guess data types. Sometimes, it gets it wrong—converting IDs to dates or trimming leading zeros. That can break formulas, especially VLOOKUP for Google Sheets, where exact matches matter.
  • Security and privacy risks: Imported data is stored in the cloud by default. Use extra caution with client data or sensitive figures like business budgets in Google Sheets.

What are the Tips for Importing CSV in Google Sheets?

Are you ready to import CSV to Google Sheets? A few smart steps before and after can save you hours of cleanup. Think of it like prepping your ingredients before cooking. The cleaner your data, the smoother the process.

Here are tips to make your import quick, accurate, and frustration-free:

  • Clean your CSV file first: Before uploading, remove blank rows, stray commas, or corrupted characters. This keeps your spreadsheet from getting cluttered or breaking formulas.
  • Use proper data types: Dates, currencies, and numbers should be formatted clearly in your CSV. This prevents type errors, keeping processes, such as the What If Analysis in Google Sheets, accurate.
  • Choose the right import option: When uploading, Google Sheets asks how to handle the data. Choose “Insert new sheet” to stay organized, especially with a Google Sheets automation extension.
  • Use the IMPORTDATA function for online files: Instead of downloading and uploading every time, use =IMPORTDATA(“URL”). It pulls live web data, which is great for tracking with Google Sheets time tracking.
  • Check for encoding issues: Weird characters or broken accents? That’s likely an encoding problem. Save your CSV as UTF-8 to make sure Google Sheets reads it correctly.

FAQs

Can you import CSV into Google Sheets?

Yes, you can import CSV into Google Sheets. It’s fast and simple. Use the File menu or a formula, and your data will load into rows and columns. This helps with analysis, sharing, and automation.

Does Google Sheets accept CSV files?

Google Sheets accepts CSV files easily. You can upload them directly or open them from Google Drive. It reads the content and structures it cleanly. CSV is a supported format. It’s perfect for managing data on the cloud.

Wrap Up

Importing CSV to Google Sheets means transferring data from a CSV file into a Google spreadsheet. It helps you work with large or structured data more easily. The process is quick and doesn’t need advanced skills.

Once the data is in, you can organize, sort, or clean it. Google Sheets offers tools to make this fast. You can even remove duplicates from Google Sheets with one click. That’s a huge time-saver for busy users.

After importing, it’s easy to collaborate. Use the techniques on how to share a Google Sheet to give others access. You control who can view or edit – perfect for teams or clients.

Want real-time stock data? Try Google Finance in Google Sheets. It lets you track market or company performance next to your CSV data. No extra apps are needed.

Need to test outcomes? Use what-if analysis in Google Sheets. Adjust numbers and see possible results instantly. It’s ideal for planning and decision-making.

Importing CSV files brings data to life, and Google Sheets makes it smarter. With the right tools, it works better for everyone. So, start importing your CSV data to Google Sheets today and install ChartExpo for better visualization.

How much did you enjoy this article?

GSAd1
Start Free Trial!
155540

Related articles

next previous
Google Sheets8 min read

How to Duplicate a Google Sheet: A Complete Guide

How to duplicate a Google Sheet involves creating an exact copy for reuse or backup. Learn quick methods and smart tips to boost your spreadsheet workflow.

Google Sheets9 min read

Business Expenses Spreadsheet: Improving Insights

A spreadsheet for business expenses helps track and manage company costs. Click here to learn how to build one, analyze data, and boost financial control.

Google Sheets8 min read

Debt Tracker in Google Sheets: A Complete Guide

A debt tracker Google Sheet helps you manage and monitor debt easily. Learn how to build, customize, and analyze it for smarter financial decisions.

Google Sheets8 min read

Assignment Tracker Google Sheet Template: Quick Insights

An assignment tracker Google Sheet template helps track tasks and deadlines. Click here to learn how to create one, who can use it, and see real examples.

Google Sheets7 min read

Goal Tracking Spreadsheet: A Complete Walkthrough

A goal-tracking spreadsheet helps you set and track goals. Click here to learn how to build one, use it in Google Sheets, and boost your progress.

ChartExpo logo

Turn Data into Visual
Stories

CHARTEXPO

  • Home
  • Gallery
  • Videos
  • Services
  • Pricing
  • Contact us
  • FAQs
  • Privacy policy
  • Terms of Service
  • Sitemap

TOOLS

  • ChartExpo for Google Sheets
  • ChartExpo for Microsoft Excel
  • Power BI Custom Visuals by ChartExpo
  • Word Cloud

CATEGORIES

  • Bar Charts
  • Circle Graphs
  • Column Charts
  • Combo Charts
  • Comparison Charts
  • Line Graphs
  • PPC Charts
  • Sentiment Analysis Charts
  • Survey Charts

TOP CHARTS

  • Sankey Diagram
  • Likert Scale Chart
  • Comparison Bar Chart
  • Pareto Chart
  • Funnel Chart
  • Gauge Chart
  • Radar Chart
  • Radial Bar Chart
  • Sunburst Chart
  • see more
  • Scatter Plot Chart
  • CSAT Survey Bar Chart
  • CSAT Survey Chart
  • Dot Plot Chart
  • Double Bar Graph
  • Matrix Chart
  • Multi Axis Line Chart
  • Overlapping Bar Chart
  • Control Chart
  • Slope Chart
  • Clustered Bar Chart
  • Clustered Column Chart
  • Box and Whisker Plot
  • Tornado Chart
  • Waterfall Chart
  • Word Cloud
  • see less

RESOURCES

  • Blog
  • Resources
  • YouTube
SIGN UP FOR UPDATES

We wouldn't dream of spamming you or selling your info.

© 2025 ChartExpo, all rights reserved.