• Home
  • Tools dropdown img
    • Spreadsheet Charts

      • ChartExpo for Google Sheets
      • ChartExpo for Microsoft Excel
    • Power BI Charts

      • Power BI Custom Visuals by ChartExpo
    • Word Cloud

  • Charts dropdown img
    • Chart Category

      • Bar Charts
      • Circle Graphs
      • Column Charts
      • Combo Charts
      • Comparison Charts
      • Line Graphs
      • PPC Charts
      • Sentiment Analysis Charts
      • Survey Charts
    • Chart Type

      • Box and Whisker Plot
      • Clustered Bar Chart
      • Clustered Column Chart
      • Comparison Bar Chart
      • Control Chart
      • CSAT Survey Bar Chart
      • CSAT Survey Chart
      • Dot Plot Chart
      • Double Bar Graph
      • Funnel Chart
      • Gauge Chart
      • Likert Scale Chart
      • Matrix Chart
      • Multi Axis Line Chart
      • Overlapping Bar Chart
      • Pareto Chart
      • Radar Chart
      • Radial Bar Chart
      • Sankey Diagram
      • Scatter Plot Chart
      • Slope Chart
      • Sunburst Chart
      • Tornado Chart
      • Waterfall Chart
      • Word Cloud
    • Google Sheets
      Microsoft Excel
  • Services
  • Pricing
  • Contact us
  • Blog
  • Support dropdown img
      • Gallery
      • Videos
      • Contact us
      • FAQs
      • Resources
    • Please feel free to contact us

      atsupport@chartexpo.com

Categories
All Data Visualizations Data Analytics Surveys
Add-ons/
  • Google Sheets
  • Microsoft Excel
  • Power BI
All Data Visualizations Data Analytics Surveys
Add-ons
  • Google Sheets
  • Microsoft Excel
  • Power BI

We use cookies

This website uses cookies to provide better user experience and user's session management.
By continuing visiting this website you consent the use of these cookies.

Ok

ChartExpo Survey


Home > Blog > Google Sheets

Google Sheets Time Tracking and Charting Techniques

What is Google Sheets time tracking? It’s a cost-effective solution for businesses and individuals. Many startups and freelancers use this spreadsheet software to manage work hours and productivity.

Google Sheets customizes templates, automates calculations, and creates visualizations. It’s a better way to track attendance, monitor project timelines, or log billable hours. Businesses use spreadsheets for operational tasks, including time management.

Google Sheets Time Tracking

Time tracking is essential. Knowing where your hours go boosts efficiency when managing teams or personal schedules. With Google Sheets time tracking, you can analyze data using formulas, conditional formatting, and pivot tables. These tools simplify complex tasks and give clear insights into your daily activities.

Google Sheets’ accessibility adds to its appeal. You can collaborate with team members, access files from any device, and ensure data security. It’s a scalable option that grows with your needs and it’s free for anyone with a Google account.

As the demand for smarter work solutions increases, tools like Google Sheets continue to prove their value. Google Sheets time tracking offers a way to stay organized, save money, and track progress.

Let’s learn more about this tool;

Table of Contents:

  1. What is Time Tracking in Google Sheets?
  2. Why Should You Track Time in Google Sheets Time Sheets?
  3. What are the Applications of Google Sheets Time Tracking?
  4. What are the Approaches to Google Sheets Time Tracking?
  5. How to Use Google Sheets for Time Tracking?
  6. What are Google Sheets Time Tracking Templates Daily, Weekly, and Monthly?
  7. How to Visualize Time Tracking in Google Sheets?
  8. What are the Advantages of Time Tracking in Google Sheets?
  9. Wrap Up

First…

What is Time Tracking in Google Sheets?

Definition: Time tracking in Google Sheets involves recording and monitoring hours worked using the platform. It helps you organize tasks, track attendance, and manage project timelines. You can create templates, use formulas, and set up automated calculations.

Google Sheets makes it easy to analyze data and visualize trends. It’s accessible from anywhere and allows collaboration. Whether for personal use or team management, Google Sheets offers a simple, cost-effective solution to track and manage time efficiently.

Why Should You Track Time in Google Sheets Time Sheets?

Tracking time in a Google Sheets timesheet helps you take control of your schedule, boost productivity, and make data-driven decisions. It offers benefits that extend far beyond simple time tracking:

  • Cost-effective: Google Sheets is free; it is an ideal solution for individuals and businesses on a budget. It eliminates the need for pricey software while still offering powerful tracking capabilities.
  • Customizable: Create a timesheet that works exactly how you need it. Whether tracking billable hours or managing employee shifts, Google Sheets adapts to any scenario.
  • Real-time collaboration: Team members update the same timesheet simultaneously, ensuring everyone is aligned. This feature is perfect for remote teams and dynamic work environments.
  • Automation: Google Sheets saves you time by automating tedious tasks. With formulas and functions, you instantly calculate totals, flag overtime, or generate summaries.
  • Data analysis: Use built-in tools to analyze trends and identify inefficiencies. Charts, graphs, and pivot tables help turn your time data into actionable insights.
  • Cloud-based: Access your timesheet from anywhere with an internet connection. Changes are saved automatically, so you don’t have to worry about losing data.
  • Simple integration: Easily connect Google Sheets with tools like Google Calendar or Slack. This streamlines workflows and ensures your time tracking aligns with your broader processes.

What are the Applications of Google Sheets Time Tracking?

Google Sheets time tracking is a versatile solution for countless needs. Whether tracking hours for a client, managing a team, or analyzing productivity, it adapts to suit your goals. Here are some of the most impactful ways it’s used.

  • Freelancers and contractors: Freelancers track billable hours accurately and ensure clients receive clear breakdowns. It’s an easy way to stay organized and streamline invoicing.
  • Small businesses and startups: Small teams use Google Sheets to monitor employee hours and allocate resources effectively. Its cost-saving benefits make it ideal for tight budgets.
  • Project management: Google Sheets helps track task progress, deadlines, and resource allocation. Teams can collaborate and stay on top of their goals.
  • Education: Teachers and students use it to manage study schedules, log teaching hours, and track project timelines. It’s a simple way to bring order to academic responsibilities.
  • Nonprofit organizations: Nonprofits track volunteer hours and manage time for events and campaigns. It helps them focus on impact while keeping operational efficiency in check.
  • Data analysis and reporting: Transform raw time data into actionable insights with charts and graphs. Google Sheets makes identifying patterns, optimizing workflows, and presenting findings easy.

What are the Approaches to Google Sheets Time Tracking?

Are you tracking time in Google Sheets? There are plenty of ways to do it:

  • Manual entry method: Open your Google Sheet and log hours directly. Create columns for date, task, and time spent. This method is customizable and gives you full control.
  • Automated time logging: Why do the work when automation can handle it? Use tools like Zapier to connect your favorite time trackers to Google Sheets. Data gets updated automatically, saving you time and reducing errors.
  • Pre-built templates: Do you prefer to start from scratch? Search for time-tracking templates in Google Sheets. They come pre-formatted, with formulas and layouts ready to go.
  • Time tracking with Google Forms: Combine Google Forms with Sheets. Team members or clients fill out a simple form, and the responses will populate your Sheet automatically.
  • Use of add-ons: Google Sheets Add-ons take your Sheets game to the next level. Tools like TimeSheet or Clockify integrate directly with Google Sheets for seamless tracking. They add functionality you didn’t know you needed.

How to Use Google Sheets for Time Tracking?

Google Sheets makes time tracking simple and efficient. It offers everything you need to organize tasks, manage schedules, and log hours. Setting it up is easy, and you can start tracking time with a few quick steps.

  1. Add data and select the data to format: Begin by entering your time-tracking data into Google Sheets. Use columns for key details, such as tasks, start, and end times, and highlight the cells you want to format. This step ensures your time entries are organized and easy to read.
Highlight Cells You Want to Format for Doing Google Sheets Time Tracking
  1. Format as time: Click on “Format” in the top menu, then select “Number” and choose “Time”. Your data will be displayed in the proper time format.
Click Format Then Select Number and Choose Time for Doing Google Sheets Time Tracking
  1. Set up time tracking columns: Decide which columns will track time “In” and “Out”. Label them clearly for quick reference.
Label Them Clearly for Quick Reference for Doing Google Sheets Time Tracking
  1. Apply duration formatting: Go to “Format”, click on “Number”, and select “Duration”. It ensures the data calculates time differences correctly.
Go to Format Click on Number and Select Duration for Doing Google Sheets Time Tracking
  1. Use a formula for calculations: Input a formula to calculate the difference between “In” and “Out” times. For example: =C2-B2 (End time – Start time).
Input Formula to Calculate Difference for Doing Google Sheets Time Tracking
  1. Drag the formula down: Once it works for one row, drag it down to apply to other cells. This saves time and keeps calculations consistent.
Once it Work for One Row Drag it Down to Apply for Doing Google Sheets Time Tracking

What are Google Sheets Time Tracking Templates Daily, Weekly, and Monthly?

Keeping track of your time feels overwhelming. But with the right Google Sheets templates, managing your daily, weekly, or monthly schedule becomes simple and fun. Let’s break it down;

  1. Daily time tracking template: Focus on each day, one at a time. This template is perfect for detailed tracking. It includes:
    • Hourly time slots to capture every task or meeting.
    • A color-coded system to highlight priorities.
    • Sections for notes, goals, and reflections.
  1. Weekly time tracking template: Zoom out and see the bigger picture. With this template, you can:
    • Plan and track tasks for the entire week in one view.
    • Categorize your time (e.g., work, personal, health).
    • Add totals to understand where your energy is going.
  1. Monthly time tracking template: A monthly template helps you keep a broader overview. It features:
    • A calendar format to track habits, projects, or progress.
    • Space for goals and achievements.
    • A summary section to analyze trends.

How to Visualize Time Tracking in Google Sheets?

Time tracking in Google Sheets is simple, versatile, and widely used. It helps organize your hours, tasks, and productivity in one place.

Visuals are key in data analysis, turning numbers into insights. However, Google Sheets can feel flat with data visualization.

Enter ChartExpo—a powerful add-on that transforms boring spreadsheets into compelling examples of visual storytelling. Let’s explore how it bridges the gap and elevates your time-tracking game.

But first….

Here are the top 5 charts created using ChartExpo.

Horizontal Waterfall Chart

Horizontal Waterfall Chart After Doing Google Sheets Time Tracking

Control/Run Chart

Control Chart After Doing Google Sheets Time Tracking

Comparison Bar Chart

Comparison Bar Chart After Doing Google Sheets Time Tracking

Multi Axis Line Chart

Multi Axis Line Chart After Doing Google Sheets Time Tracking

Progress Circle Chart

Progress Circle Chart After Doing Google Sheets Time Tracking

Let’s learn how to install ChartExpo in Google Sheets.

  1. To start using ChartExpo, download it directly from the Google Sheets program. To do this, select Extensions from the top toolbar.
  2. A menu will appear. Click the Get add-ons option.
  3. Search for ChartExpo, and click on Charts, Graphs & Visualizations by ChartExpo when it appears in the results.
  4. Click the Install button. You will have to confirm your Google account and accept some permissions.

ChartExpo charts are available both in Google Sheets and Microsoft Excel. Please use the following CTAs to install the tool of your choice and create beautiful visualizations in a few clicks in your favorite tool.

Example

Let’s visualize and delve into analyzing and interpreting data from the time-tracking sample in Google Sheets using ChartExpo.

Day Hours Worked
Monday 10
Tuesday 15
Wednesday 12
Thursday 16
Friday 14
  • To get started with ChartExpo, install ChartExpo in Google Sheets.
  • Go to Extensions > Charts, Graphs & Visualizations by ChartExpo > Open.
open chartexpo in google sheets
  • To access the charts library, click the Add new chart button.
add new chart in google sheets
  • Once ChartExpo is loaded. Click on “Progress Circle Chart”.
search progress circle chart in google sheets
  • First, insert the data table into the sheet. Then, choose the Sheet name from the drop-down menu in the ChartExpo section.
  • Select the metric column; the numeric column in your data sheet.
  • Select the dimensions column; the dimension is the categorical column in your datasheet that contains text information.
  • Click the Create chart button to complete the process.
Click Create Chart Button After Doing Google Sheets Time Tracking
  • Your tabular data will turn into a Progress Circle Chart, as shown below.
  • Click the Edit chart button to make custom changes.
Click Edit Chart After Doing Google Sheets Time Tracking
  • To change the title of the chart, click the pencil icon next to the Chart Header.
  • It will open the properties dialog. Under the Text section, you can add a heading in Line 1 and enable the Show option. Give the appropriate title of your chart and click the Apply button.
Add Chart Header After Doing Google Sheets Time Tracking
  • You can add the “hrs” sign with all values as follows:
Add Hrs Sign with All Values After Doing Google Sheets Time Tracking
  • Click the “Save” button:
Click Save Button After Doing Google Sheets Time Tracking
  • Your final chart will appear as shown below.
Final Google Sheets Time Tracking

Insights

  • High work engagement: Consistent productivity across the week.
  • Thursday peak: Most hours worked (16).
  • Friday dip: Least hours logged (14).
  • Stable trend: Minimal fluctuations in daily work hours.

Unlock Efficiency Insights with Google Sheets Time Tracking Charts:

  1. Open your Google Sheets Application.
  2. Install ChartExpo Add-in for Google Sheets from Google Workspace Marketplace.
  3. Select the Progress Circle Chart from the list of charts.
  4. Fill in the necessary fields.
  5. Click on the “Create Chart” button.
  6. Customize your chart properties to add header, axis, legends, and other required information.
  7. Export your chart and share it with your audience.

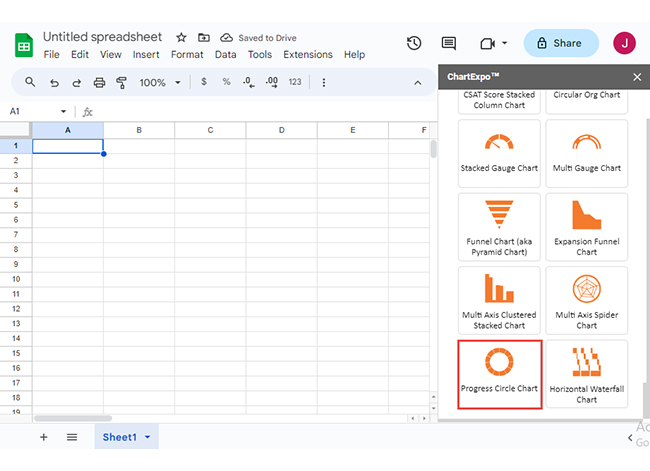
The following video will help you to create a Progress Circle Chart in Google Sheets.

What are the Advantages of Time Tracking in Google Sheets?

Time tracking doesn’t have to be complicated or expensive. Google Sheets makes it easy and efficient. Let’s see why it’s such a great choice.

  • Cost-effective: Google Sheets costs nothing and provides everything you need for time tracking. There are no subscriptions or hidden fees—just good old functionality at zero cost.
  • Customizable: Design your sheet the way you like it. Add columns, formulas, or color codes to make it truly yours. It adapts to your needs, not the other way around.
  • Real-time collaboration: Google Sheets lets everyone update and view the time tracker simultaneously. Stay synced without the endless back-and-forth emails.
  • Automation: Integrate tools like Google Forms, Zapier, or add-ons to automate entries. Focus on your work, and let Sheets handle the busy work.
  • Cloud-based: You can access your time tracker from anywhere, anytime. Your data is always safe and available in the cloud, whether on your laptop, tablet, or phone.

Disadvantages of Google Sheets Time Tracking

Google Sheets is great for time tracking, but it’s not perfect. Like every tool, it has its quirks. Let’s explore some downsides so you know what to expect.

  • Manual data entry: It works for small tasks, but manual entry can be time-wasting for bigger projects.
  • Limited advanced features: Google Sheets is powerful but basic. It’s not designed to replace full-featured time-tracking software.
  • Scalability: It’s great for solo work or small teams. But as your project or team grows, Sheets can become cluttered and harder to manage. Scaling beyond a point may require more robust tools.

FAQs

Is there a time function in Google Sheets?

Yes, the TIME function creates a specific time using hours, minutes, and seconds. You can also use functions like NOW for the current time or HOUR to extract time components.

How do I make an automatic timeline in Google Sheets?

To create an automatic timeline in Google Sheets:

  1. Enter your dates and events in separate columns.
  2. Use conditional formatting or charts to visualize them.
  3. Use functions like ARRAY FORMULA or SPARKLINE to update automatically as data changes.

How to use Google Sheets to calculate hours worked?

To calculate hours worked in Google Sheets:

  1. Enter start and end times in separate cells.
  2. Find hours using the formula =(End Time – Start Time)×24.
  3. Format the result as a number for accuracy.

Wrap Up

Google Sheets time tracking is a powerful, flexible tool that simplifies time management for individuals and teams. From freelancers to businesses, it caters to diverse needs, and its accessibility and customization make it stand out.

This tool offers more than just tracking hours. It helps visualize data, spot trends, and improve productivity. Features like formulas and charts take it beyond a simple spreadsheet. This makes it a practical solution for efficient time management.

Google Sheets is cost-effective – ideal for startups, nonprofits, and those on a budget. Moreover, it makes collaboration effortless. Teams can update timesheets in real-time, no matter where they are. It boosts communication and ensures everyone stays aligned.

Automation is another key advantage. Tasks like calculations and formatting become effortless. It saves time and reduces errors, making processes smoother.

Google Sheets provides an easy, reliable way to stay organized. Whether for personal use or team management, it helps you stay on track and reach your goals. It’s a tool worth considering for smarter time management.

How much did you enjoy this article?

GSAd2
Start Free Trial!
145873

Related articles

next previous
Google Sheets10 min read

Google Workspace for Education for Better Insights

Google Workspace for Education boosts collaboration and remote learning. Explore its features, benefits, and how ChartExpo enhances data analysis.

Google Sheets9 min read

Google Workspace Marketplace for Boosting Insights

Google Workspace Marketplace provides apps to enhance Gmail, Drive, and Docs. Learn about this tool and how to improve data visualization and analysis.

Google Sheets12 min read

Google Sheets CRM Templates for Insightful Decisions

Google Sheets CRM templates help businesses track contacts, sales, and customer data. Learn their benefits, setup steps, and expert tips to boost efficiency.

Google Sheets10 min read

Histogram Chart in Google Sheets: A Quick Walkthrough

A Google Sheets Histogram makes data visualization simple by revealing patterns. Learn how to create, customize, and optimize histograms for better insight.

Google Sheets10 min read

Google Sheets Amortization Schedule with Clear Visuals

A Google Sheets Amortization Schedule tracks loan payments, interest, and balances. Learn how to create your schedule for better loan management.

ChartExpo logo

Turn Data into Visual
Stories

CHARTEXPO

  • Home
  • Gallery
  • Videos
  • Services
  • Pricing
  • Contact us
  • FAQs
  • Privacy policy
  • Terms of Service
  • Sitemap

TOOLS

  • ChartExpo for Google Sheets
  • ChartExpo for Microsoft Excel
  • Power BI Custom Visuals by ChartExpo
  • Word Cloud

CATEGORIES

  • Bar Charts
  • Circle Graphs
  • Column Charts
  • Combo Charts
  • Comparison Charts
  • Line Graphs
  • PPC Charts
  • Sentiment Analysis Charts
  • Survey Charts

TOP CHARTS

  • Sankey Diagram
  • Likert Scale Chart
  • Comparison Bar Chart
  • Pareto Chart
  • Funnel Chart
  • Gauge Chart
  • Radar Chart
  • Radial Bar Chart
  • Sunburst Chart
  • see more
  • Scatter Plot Chart
  • CSAT Survey Bar Chart
  • CSAT Survey Chart
  • Dot Plot Chart
  • Double Bar Graph
  • Matrix Chart
  • Multi Axis Line Chart
  • Overlapping Bar Chart
  • Control Chart
  • Slope Chart
  • Clustered Bar Chart
  • Clustered Column Chart
  • Box and Whisker Plot
  • Tornado Chart
  • Waterfall Chart
  • Word Cloud
  • see less

RESOURCES

  • Blog
  • Resources
  • YouTube
SIGN UP FOR UPDATES

We wouldn't dream of spamming you or selling your info.

© 2025 ChartExpo, all rights reserved.