Categories
What is a survey in Google Sheets? More people are asking this question as data collection becomes an integral part of daily decision-making. A survey in Google Sheets pairs data collection with instant analysis.


As responses roll in, trends form in seconds. You can apply filters, charts, and formulas without leaving the spreadsheet. That means faster decisions, more transparent reporting, and less guesswork.
Google Forms are easy to build, share, and instantly connect to Sheets. Results land in real-time, and you don’t need advanced tech skills to gain insights.
Do you need to run a CSAT or a Net Promoter survey? Google Forms can handle both. You can choose from pre-made templates or build one from scratch. Then, watch as the data flows into Sheets, ready for action.
Surveys don’t need to be long or complicated. Google’s tools can be efficient and informative. Whether you’re tracking customer feedback, team satisfaction, or event RSVPs, these tools have got you covered. It all starts with the proper setup, and everything flows smoothly.
And yes, people are using it. From teachers to HR teams to solo entrepreneurs. The ease of using Google Forms, paired with the data power of Sheets, changes how we think about feedback.
This blog walks you through what a survey in Google Sheets is. You’ll also see why more people are choosing this method to capture and understand what matters.
Let’s get started.
Definition: A survey in Google Sheets is a method of collecting and analyzing responses directly within a spreadsheet. Typically, the survey is created using Google Forms, which allows you to design questions in multiple formats such as multiple choice, checkboxes, short answers, and more. Once respondents submit their answers, the data is automatically stored in a connected Google Sheet.
This integration makes it easy to organize, manage, and analyze survey results in one place. You can filter responses, create charts, or even apply formulas to uncover trends and insights. Because it’s cloud-based, a Google Sheets survey is highly collaborative, allowing multiple people to view and work with the data in real time.
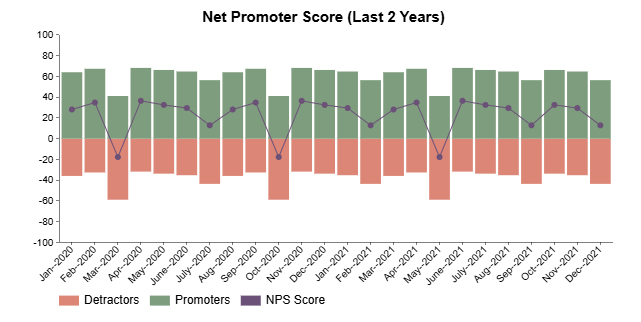
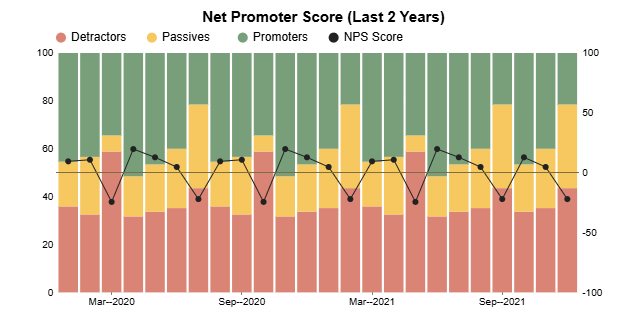
Are you looking for the best charts to use in Google Sheets for surveys? You can draw inspiration from these sample charts. These charts were created in Google Sheets using ChartExpo:
Why do people keep turning to Google Forms for survey tasks? Because it works. It’s fast, simple, and makes sense—whether you’re running a quick CSAT survey or tracking team feedback. No fancy tools. No extra costs – everything connects to Google Sheets.
Here’s why using Google Sheets for surveys matters:
Here are some practical examples of how surveys work with Google Sheets:
Organizations often run internal surveys to understand employee satisfaction. With Google Sheets, HR teams can group responses by department, compare engagement levels, and highlight areas needing attention. Heatmaps or Likert scale charts can make this data more actionable.
If you’re hosting an event, you can collect attendee registrations and later gather feedback through surveys. Google Sheets will automatically record responses, allowing you to track participation rates and measure event success.
Marketers can use Google Sheets to collect consumer insights about products, pricing, or brand perception. With built-in formulas and add-ons like ChartExpo, you can quickly visualize patterns and create shareable dashboards for decision-making.
Teachers and students often use Google Sheets for quick classroom polls, quizzes, or research projects. The responses can then be turned into charts for presentations or reports.
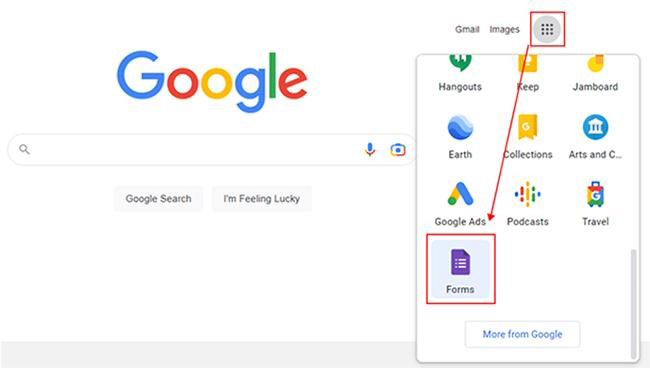
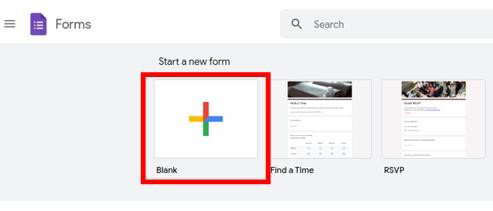
Here is a step-by-step process through you know how to create a survey in Google Sheets:
What is a survey in Google Sheets? It’s the go-to method for collecting feedback with speed and simplicity. Responses drop into your spreadsheet like magic. However, the real challenge is understanding the data when it starts stacking up.
Sure, Google Sheets offers basic charts, but they’re often underwhelming. Basic bar charts won’t cut it when you’re trying to present clear insights.
That’s where ChartExpo steps in. It turns your flat survey data into vibrant, interactive visuals. For example, using a Pareto chart in Google Sheets (powered by ChartExpo) makes it easy to identify the most significant trends and responses. It’s the upgrade your Google Sheets survey never knew it needed.
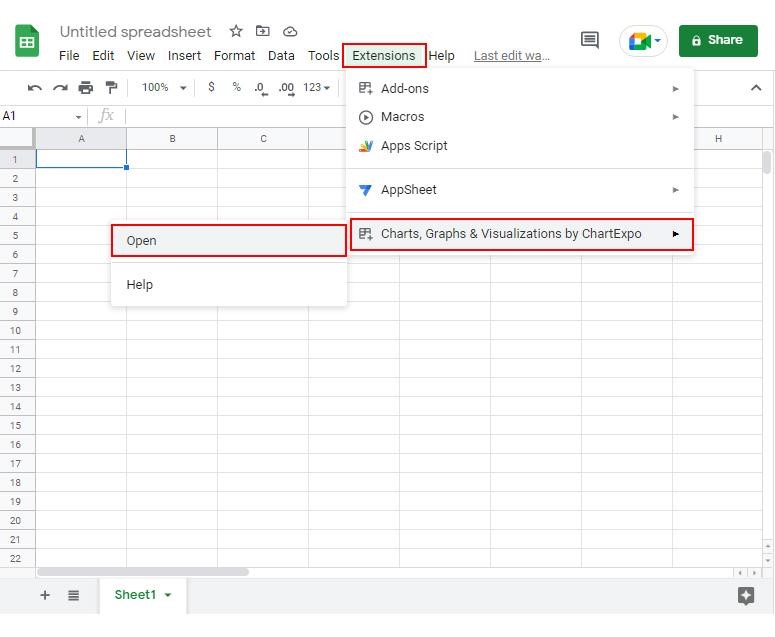
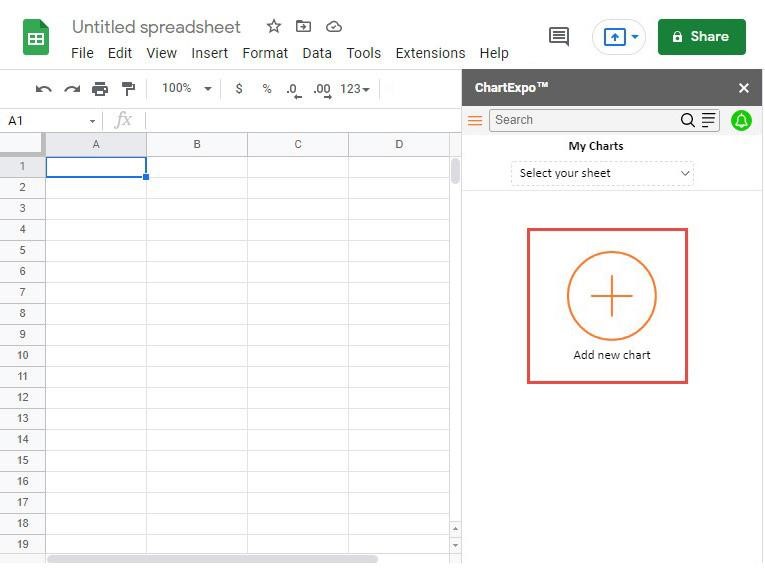
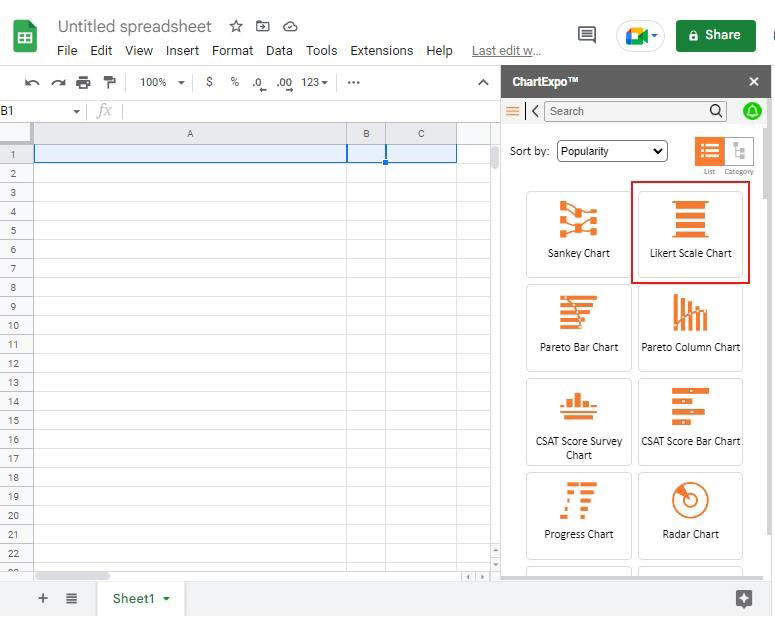
How to Install ChartExpo in Google Sheets?
ChartExpo charts are available both in Google Sheets and Microsoft Excel. Please use the following CTAs to install the tool of your choice and create beautiful visualizations in a few clicks in your favorite tool.
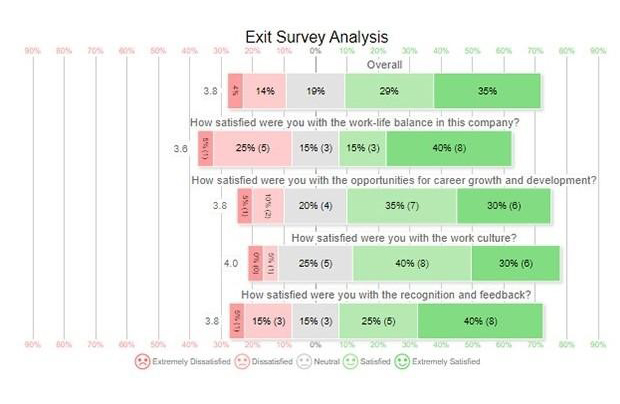
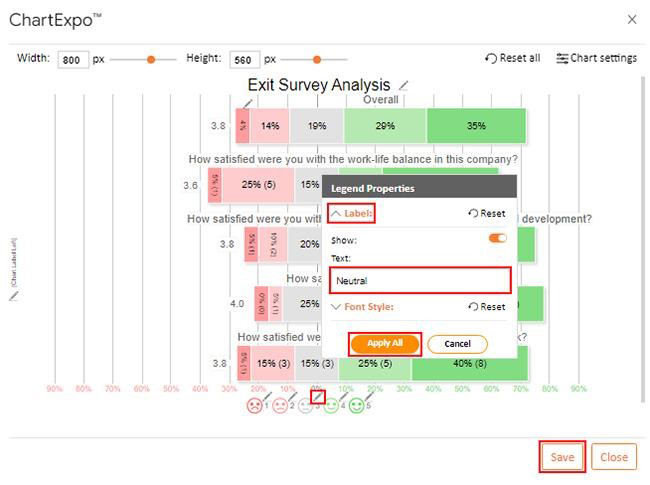
The most effective way to demonstrate the value of Likert Scale Charts is by showcasing real examples.
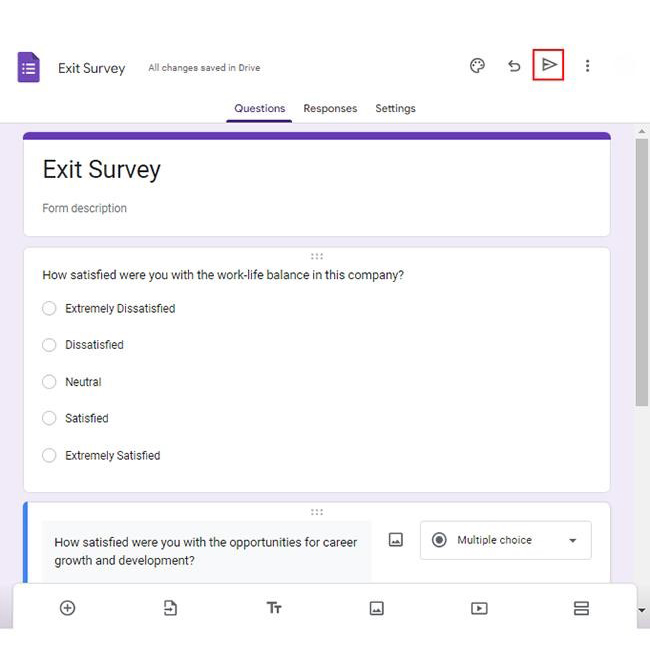
Let’s see how to make a Google Survey. Then, we’ll see how to build a Likert Scale Chart using feedback gathered from your Google Sheets questionnaire.
Assume you’ve received responses in the following format:
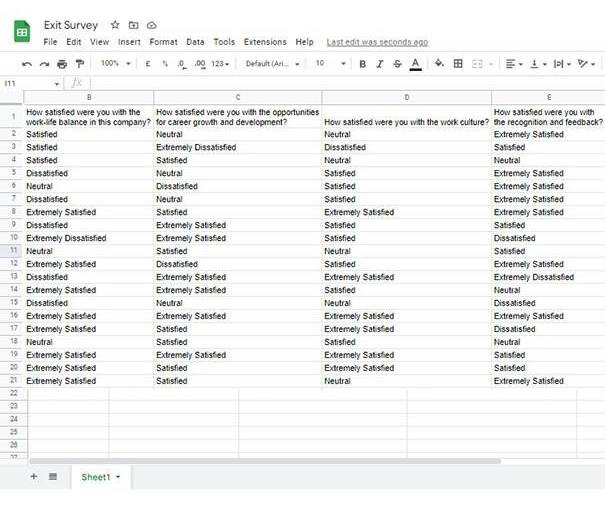
The answer options are:
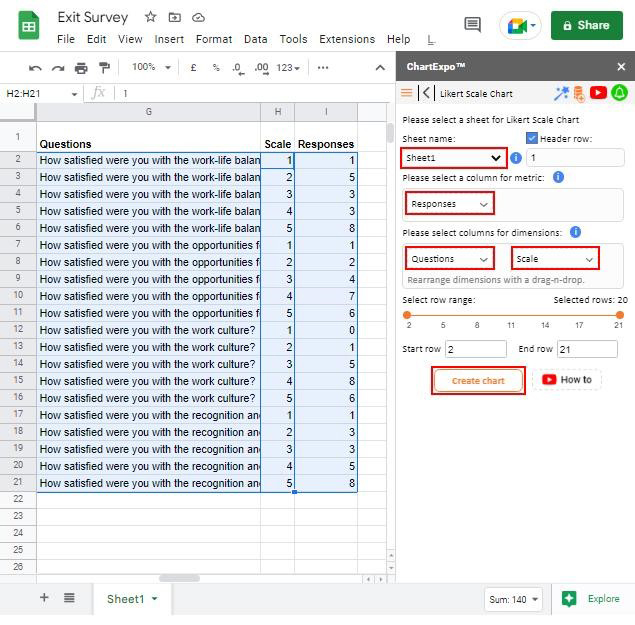
You’ll need to convert this input into a more structured format:
| Questions | Scale | Responses |
| How satisfied were you with the work-life balance in this company? | 1 | 1 |
| How satisfied were you with the work-life balance in this company? | 2 | 5 |
| How satisfied were you with the work-life balance in this company? | 3 | 3 |
| How satisfied were you with the work-life balance in this company? | 4 | 3 |
| How satisfied were you with the work-life balance in this company? | 5 | 8 |
| How satisfied were you with the opportunities for career growth and development? | 1 | 1 |
| How satisfied were you with the opportunities for career growth and development? | 2 | 2 |
| How satisfied were you with the opportunities for career growth and development? | 3 | 4 |
| How satisfied were you with the opportunities for career growth and development? | 4 | 7 |
| How satisfied were you with the opportunities for career growth and development? | 5 | 6 |
| How satisfied were you with the work culture? | 1 | 0 |
| How satisfied were you with the work culture? | 2 | 1 |
| How satisfied were you with the work culture? | 3 | 5 |
| How satisfied were you with the work culture? | 4 | 8 |
| How satisfied were you with the work culture? | 5 | 6 |
| How satisfied were you with the recognition and feedback? | 1 | 1 |
| How satisfied were you with the recognition and feedback? | 2 | 3 |
| How satisfied were you with the recognition and feedback? | 3 | 3 |
| How satisfied were you with the recognition and feedback? | 4 | 5 |
| How satisfied were you with the recognition and feedback? | 5 | 8 |
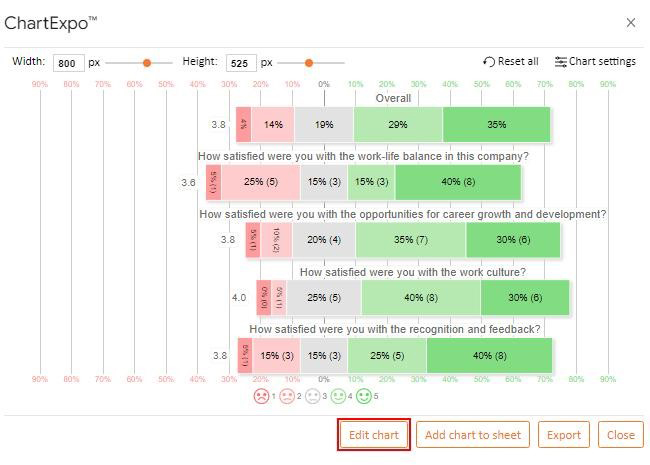
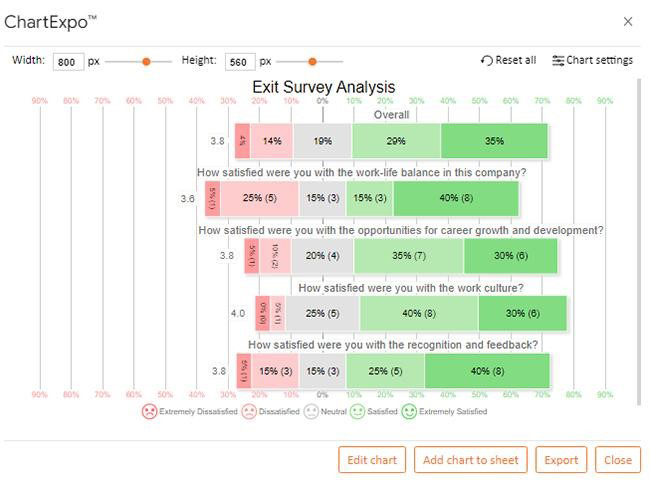
Work-life balance:
Career growth opportunities:
Work culture:
Recognition & feedback:
Overall employee satisfaction:
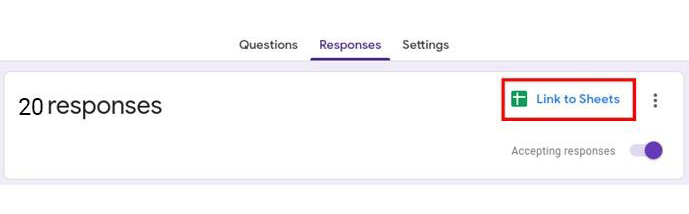
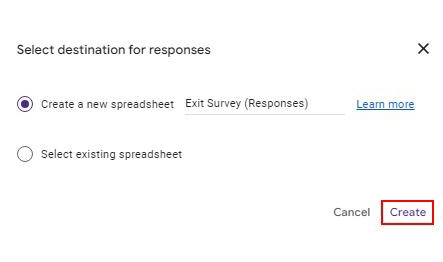
Design your survey in Google Forms and link it to Google Sheets. This way, every response is automatically recorded in a structured format.
Use built-in functions in Sheets to filter, sort, or remove duplicates. This ensures your survey data is accurate and easy to analyze.
Turn raw data into visuals by creating bar charts, pie charts, or line graphs in Google Sheets. This helps you quickly identify patterns and insights.
Since Sheets is cloud-based, you can share the survey results with your team in real time. Add comments, assign tasks, and work together on the same file.
Instead of building a survey from scratch, a ready-made Google Sheets survey template gives you a framework to start immediately. You only need to customize questions and adjust formatting.
Responses are stored directly in Google Sheets, eliminating manual entry. This keeps data organized, accurate, and ready for analysis.
Since Google Sheets is cloud-based, multiple team members can access and analyze survey results at the same time. This makes collaboration simple and efficient.
Templates can be tailored to your needs. You can add new questions, adjust layouts, or connect with Google Forms to create a seamless survey workflow.
Unlike many survey tools that require subscriptions, Google Sheets templates are completely free and easy to use. Even beginners can set up and manage surveys without technical skills.
You can convert raw survey responses into easy-to-understand charts and graphs directly in Google Sheets. This helps in spotting trends and patterns quickly.
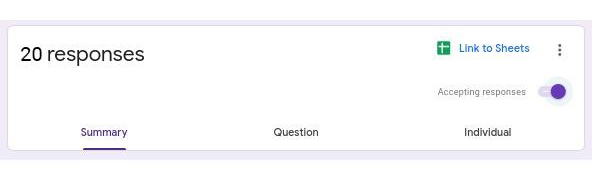
When linked with Google Forms, responses appear instantly in Sheets. This real-time update ensures you always have the latest data without manual entry.
Sheets allows you to filter responses, sort them by categories, or apply conditions to focus only on specific data points for deeper analysis.
Google Sheets supports add-ons like ChartExpo and other third-party tools, which enhance reporting and help create more advanced survey visualizations.
Want cleaner data, easier tracking, and faster insights? A few minor tweaks can make a big difference. These tips will help you get the most from every response:
In Qualtrics, export your survey results as a CSV or Excel file. Then, open Google Sheets and import the file. This allows you to view, organize, and analyze the survey responses directly in Sheets.
Google Sheets itself doesn’t have built-in survey tools. Instead, you create a survey using Google Forms. Once responses are collected, they are automatically stored and updated in a linked Google Sheet for easy analysis.
A Survey in Google Sheets is an innovative, simple way to collect feedback. It starts with Google Forms, and responses land directly in a connected Google Sheet. This setup is quick and saves time. Anyone with a Google account can use it; No coding skills are required.
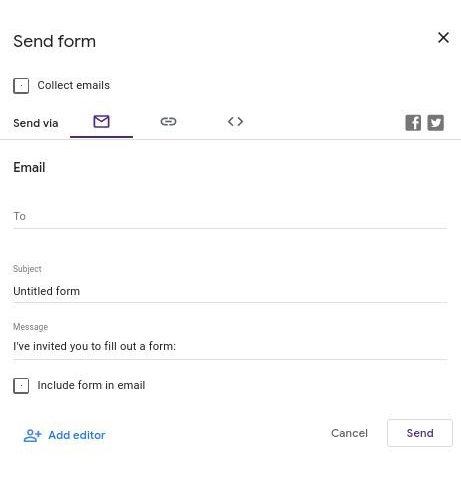
You can create surveys using a Google Forms Survey Template or start from scratch. The Google survey format is flexible and easy to edit. Add questions, send the form, and wait for results.
Once responses come in, Google Sheets helps you organize the data. Use filters, formulas, and charts. You can even track trends in a CSAT Survey or team feedback.
However, basic Sheet tools may fall short when it comes to creating better visuals. That’s where ChartExpo comes in. It turns raw survey results into visuals you can use and share.
In conclusion, using Google Forms to Google Sheets makes surveys easier. You get fast answers, thoughtful insights, and a straightforward way to act on feedback. To take your data further, install ChartExpo. It will help you create clear, impactful charts that bring your survey results to life.
Net Promoter, NPS, NPS Prism, and many other terms related to NPS are registered trademarks of Bain & Company Inc., Satmetrix Systems Inc., and Fred Reichheld.
How much did you enjoy this article?


Google Forms to Google Sheets keeps your data organized and current with every submission. Learn the steps, methods, and tips now!

Product survey questions reveal what customers truly think. Learn how to ask the right ones and act on the survey results. Read on!

Learn how the 5-Point Performance Rating Scale improves employee evaluations with clear, consistent, and fair performance reviews across teams.


