• Home
  • Tools dropdown img
    • Spreadsheet Charts

      • ChartExpo for Google Sheets
      • ChartExpo for Microsoft Excel
    • Power BI Charts

      • Power BI Custom Visuals by ChartExpo
    • Word Cloud

  • Charts dropdown img
    • Chart Category

      • Bar Charts
      • Circle Graphs
      • Column Charts
      • Combo Charts
      • Comparison Charts
      • Line Graphs
      • PPC Charts
      • Sentiment Analysis Charts
      • Survey Charts
    • Chart Type

      • Box and Whisker Plot
      • Clustered Bar Chart
      • Clustered Column Chart
      • Comparison Bar Chart
      • Control Chart
      • CSAT Survey Bar Chart
      • CSAT Survey Chart
      • Dot Plot Chart
      • Double Bar Graph
      • Funnel Chart
      • Gauge Chart
      • Likert Scale Chart
      • Matrix Chart
      • Multi Axis Line Chart
      • Overlapping Bar Chart
      • Pareto Chart
      • Radar Chart
      • Radial Bar Chart
      • Sankey Diagram
      • Scatter Plot Chart
      • Slope Chart
      • Sunburst Chart
      • Tornado Chart
      • Waterfall Chart
      • Word Cloud
    • Google Sheets
      Microsoft Excel
  • Services
  • Pricing
  • Contact us
  • Blog
  • Support dropdown img
      • Gallery
      • Videos
      • Contact us
      • FAQs
      • Resources
    • Please feel free to contact us

      atsupport@chartexpo.com

Categories
All Data Visualizations Data Analytics Surveys
Add-ons/
  • Google Sheets
  • Microsoft Excel
  • Power BI
All Data Visualizations Data Analytics Surveys
Add-ons
  • Google Sheets
  • Microsoft Excel
  • Power BI

We use cookies

This website uses cookies to provide better user experience and user's session management.
By continuing visiting this website you consent the use of these cookies.

Ok

ChartExpo Survey


Home > Blog > Microsoft Excel

Business Budget Template in Excel: Simplified

What is a business budget template in Excel, and why do so many businesses rely on it? Because money matters—and so does tracking it right.

Every dollar counts. Yet, according to CBInsights, 38% of startups fail due to poor cash management. That’s not a small number. Even established companies struggle without precise budgeting.

Business Budget Template in Excel

A business budget template in Excel can help avoid those blind spots. It gives structure. It offers clarity. And most importantly, it keeps finances in check.

Think about this: Excel is used by over 750 million people globally. Its power isn’t just in formulas. It’s in how it helps organize data in ways that make sense. A business budget template in Excel brings that power to your fingertips. Whether you have a small business or one growing fast, this tool can guide your financial decisions. No fluff. No guesswork.

You don’t need to be a finance expert to start. A structured template simplifies tracking expenses, forecasting revenue, and managing cash flow. No more scrambling at month-end. No more hoping the numbers line up. You stay in control; every row and column brings you closer to smarter decisions.

Whether preparing for tax season, pitching to investors, or simply trying to avoid overspending, a budget template helps you get there. No fancy tools are required. Excel, used right, is more than enough.

Let’s dive right in…

Table of Contents:

  1. What is a Business Budget Template in Excel?
  2. Why is the Excel Business Budget Template Important?
  3. What Should Be Included in an Excel Business Expenses Template?
  4. How to Create a Company Budget Format in Excel?
  5. How to Analyze a Business Budget Template in Excel?
  6. Best Practices of the Excel Business Budget Template
  7. FAQs
  8. Wrap Up

What is a Business Budget Template in Excel?

Definition: A business budget template in Excel is a spreadsheet tool designed to help you plan and track your finances. It allows you to enter income, expenses, and other financial data. This template aids in business forecasting by comparing projected results with actual outcomes.

You can also use a business budget template to create monthly budget examples and analyze trends. It is a valuable tool for managing cash flow and business metrics. The built-in formulas simplify calculations and improve accuracy.

Why is the Excel Business Budget Template Important?

A business budget template in Excel is more than just a spreadsheet; it’s a tool for clarity. It helps businesses organize and manage finances easily. Here’s why it’s important:

  • Organized financial tracking: This Excel template tracks income and expenses, giving you a clear financial overview. This organization helps you track metrics and stay on top of your finances.
  • Improved decision-making: The template provides insights into your financial status. Using analytics tools for business helps you analyze data and make informed decisions.
  • Cash flow management: A business budget template helps you monitor cash flow. Cash flow management improves business forecasting accuracy and ensures you have enough for future expenses.
  • Financial forecasting: The template compares historical data with projections. This helps adjust plans based on forecasting and prepare for economic changes.
  • Simplified reporting: Excel templates save time with built-in formulas. Use them to create monthly financial report templates in Excel for stakeholders or analysis.
  • Cost control: The budget template helps identify overspending areas. Use it alongside profit and loss templates in Excel to keep costs in check and boost profitability.

What Should Be Included in an Excel Business Expenses Template?

An Excel business expenses template is an innovative tool for tracking and managing spending. It helps you stay organized and makes financial decisions easier.

Here’s what you should include in the template:

  • Expense categories: Categorize your expenses into office supplies, utilities, travel, etc. This will give you a clear idea of where your money goes.
  • Expense description: Describe each expense briefly. This will assist in keeping things clear and remind you of its purpose later.
  • Amount spent: Use this to log the amount paid. It’s critical for staying on track with your budget and cash flow.
  • Date of expense: Record the date of each expense. This will assist you in communicating your damages over time and being organized.
  • Payment method: Specify whether the expense was paid with a bank, credit, or cash. This ensures your records match your payment method.
  • Vendor/recipient name: Include the name of the vendor or recipient. It helps track who you’ve paid and can be helpful for future reference.

How to Create a Company Budget Format in Excel?

Creating a company budget in Excel doesn’t have to be complicated. This essential tool helps you keep your finances organized. Follow these steps to make your company budget format:

  1. Open a new Excel spreadsheet: Open a new Excel sheet. This will serve as the foundation for your budget.
  2. Define income categories: List all income sources for your business. This could include sales, investments, or other revenue streams.
  3. Add expense categories: Create categories for all business expenses. Include rent, salaries, utilities, and marketing costs.
  4. Create a monthly or annual format: Decide if you want a monthly or annual budget. Monthly formats give you a detailed view of cash flow.
  5. Input budgeted amounts: Enter your planned income and expenses. Be realistic about what you expect to earn and spend.
  6. Track actual amounts: Input actual income and expenses as the month progresses. This helps you compare projections with real numbers.
  7. Calculate totals and variance: Sum up the totals for income and expenses. Then, compare your budgeted amounts to actual figures to track variance.
  8. Format for clarity: Use bold text, borders, and colors to make your budget easy to read. Clear formatting helps you spot trends quickly.

How to Analyze a Business Budget Template in Excel?

Data analysis can feel like herding cats – numbers everywhere and patterns hiding. Nothing makes sense at first glance. You scroll through rows, squint at columns, and still miss the big picture.

That’s where data visualization comes in. It turns chaos into clarity. Especially when working with a business budget template in Excel. But here’s the catch—Excel’s charts often fall flat; limited types, clunky designs, and are hard to customize. You end up spending more time fixing the chart than understanding the data.

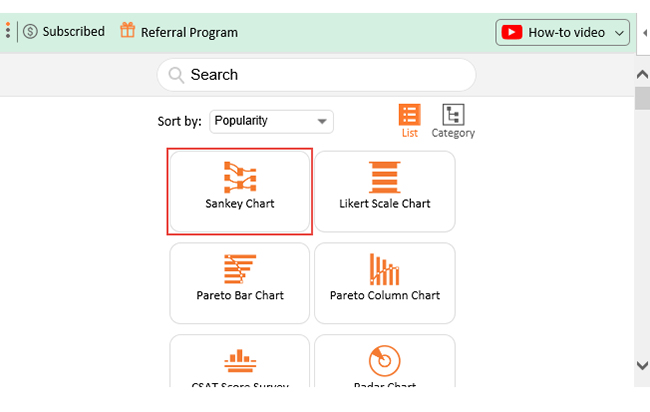
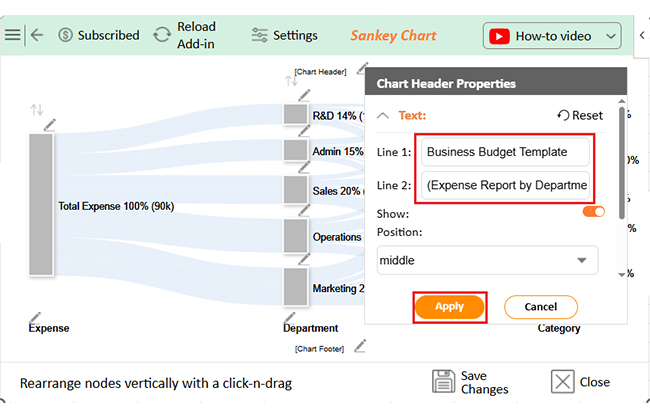
Enter ChartExpo. It plugs into Excel and fixes the mess. How? It brings smart, beautiful, ready-to-use charts right where you need them. Suddenly, your budget data speaks, trends pop, insights shine, and decision-making gets faster.

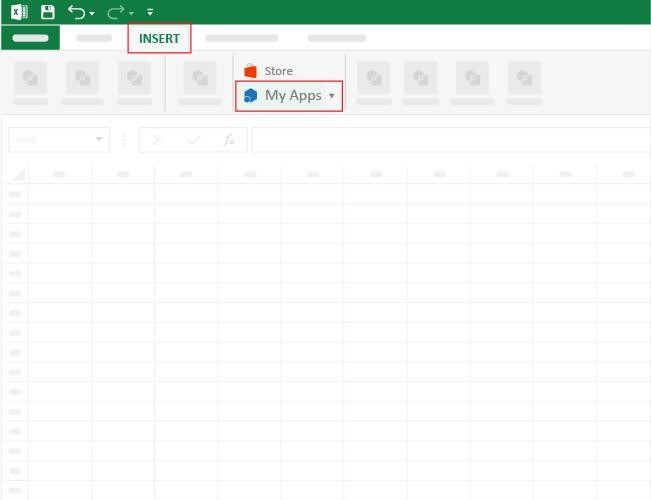
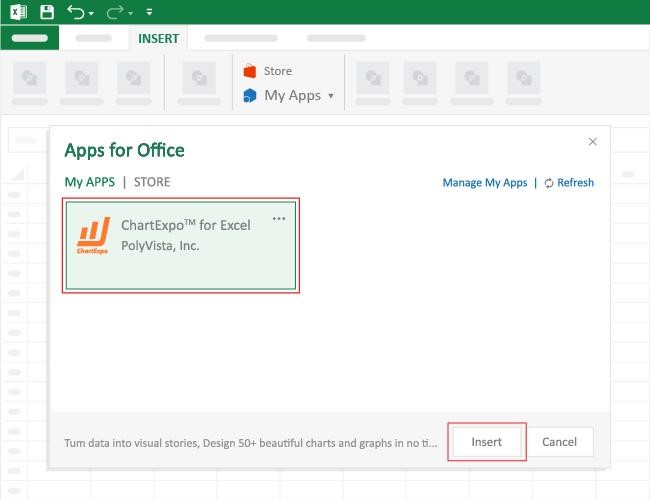
How to Install ChartExpo in Excel?

  1. Open your Excel application.
  2. Open the worksheet and click the “Insert” menu.
  3. You’ll see the “My Apps” option.
  4. In the Office Add-ins window, click “Store” and search for ChartExpo on the My Apps Store.
  5. Click the “Add” button to install ChartExpo in your Excel.

ChartExpo charts are available both in Google Sheets and Microsoft Excel. Please use the following CTAs to install the tool of your choice and create beautiful visualizations with a few clicks in your favorite tool.

Example

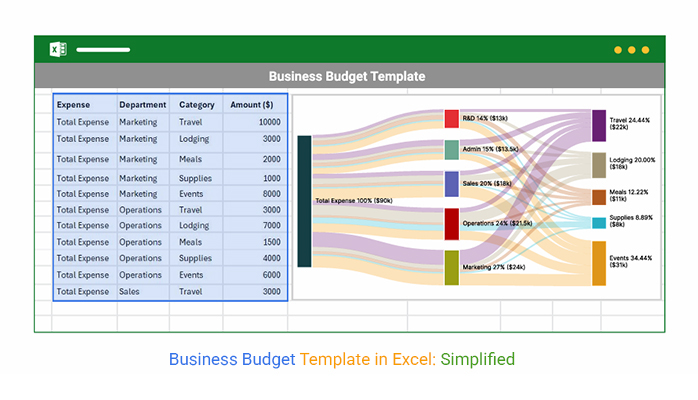
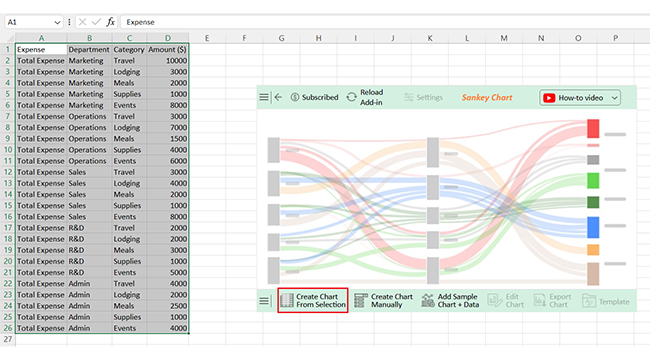
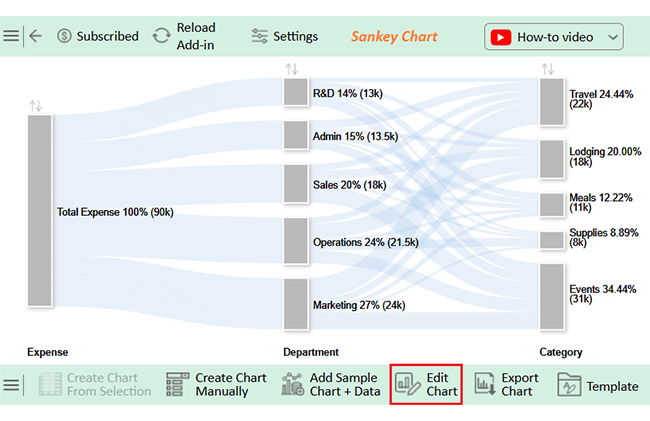
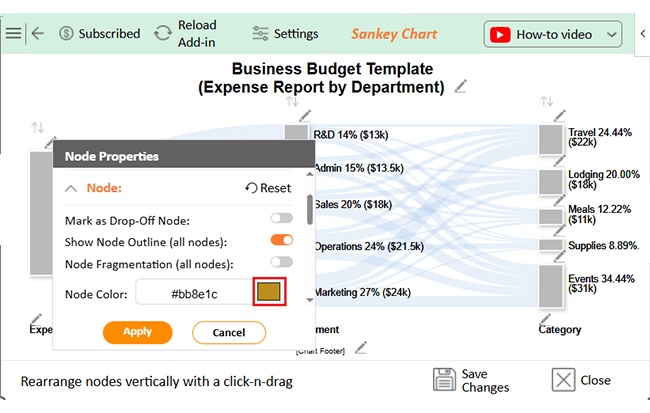
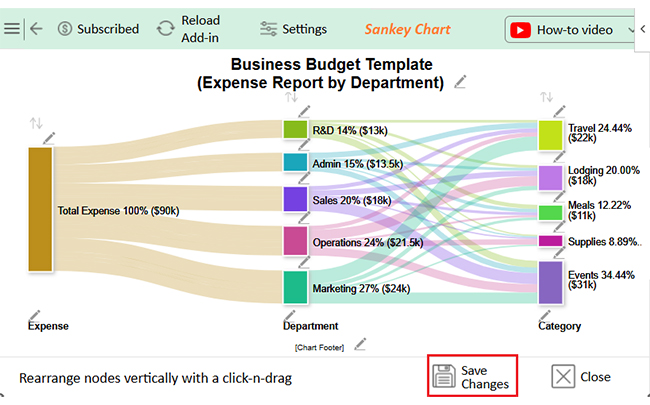
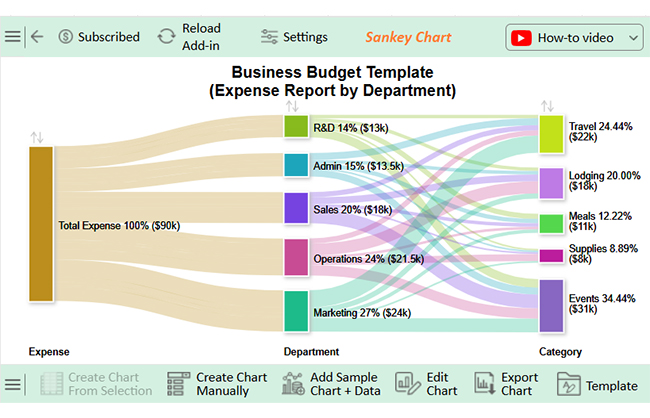
Let’s learn how to create a monthly budget in Excel in Excel using ChartExpo. We’ll use the small business budget spreadsheet below:

Expense Department Category Amount ($)
Total Expense Marketing Travel 10,000
Total Expense Marketing Lodging 3,000
Total Expense Marketing Meals 2,000
Total Expense Marketing Supplies 1,000
Total Expense Marketing Events 8,000
Total Expense Operations Travel 3,000
Total Expense Operations Lodging 7,000
Total Expense Operations Meals 1,500
Total Expense Operations Supplies 4,000
Total Expense Operations Events 6,000
Total Expense Sales Travel 3,000
Total Expense Sales Lodging 4,000
Total Expense Sales Meals 2,000
Total Expense Sales Supplies 1,000
Total Expense Sales Events 8,000
Total Expense R&D Travel 2,000
Total Expense R&D Lodging 2,000
Total Expense R&D Meals 3,000
Total Expense R&D Supplies 1,000
Total Expense R&D Events 5,000
Total Expense Admin Travel 4,000
Total Expense Admin Lodging 2,000
Total Expense Admin Meals 2,500
Total Expense Admin Supplies 1,000
Total Expense Admin Events 4,000
  • To get started with ChartExpo, install ChartExpo in Excel.
  • Now, click on My Apps from the INSERT menu.
Business Budget Template in Excel
  • Choose ChartExpo from My Apps, then click Insert.
Business Budget Template in Excel
  • Once it loads, choose the “Sankey Chart” from the charts list.
Business Budget Template in Excel
  • Click the “Create Chart From Selection” button after selecting the data from the sheet, as shown.
Business Budget Template in Excel
  • ChartExpo will generate the visualization below for you.
Business Budget Template in Excel
  • If you want to have the chart’s title, click Edit Chart, as shown in the above image.
  • Click the pencil icon next to the Chart Header to change the title.
  • It will open the properties dialog. Under the Text section, you can add a heading in Line 1 and enable Show.
  • Give the appropriate title of your chart and click the Apply button.
Business Budget Template in Excel
  • You can add the dollar sign with all values as follows:
Business Budget Template in Excel
  • Let’s give colors to the nodes. Click the pencil icon at the top of the nodes and go to “Node“. Select the color and click the “Apply” button to save all changes.
Business Budget Template in Excel
  • Click the “Save Changes” button to persist the changes.
Business Budget Template in Excel
  • Your final chart will appear below.
Business Budget Template in Excel

Insights

  • The size of each node represents the expenses.
  • Total expenses amount to $90k.
  • Marketing has the highest expenditure among departments.
  • R&D and Admin departments have nearly equal expenses with slight differences.
  • Events are the highest expense category at $31k, while supplies are the lowest at $8k.

Best Practices of the Excel Business Budget Template

An Excel business budget template can simplify financial management, but best practices are key to making it effective. Here are the best practices to follow for a seamless experience:

  • Use clear and consistent categories: Set up well-defined categories for income and expenses. This makes it easier to track your data and analyze spending.
  • Separate budgeted vs. actual amounts: Clearly distinguish between planned and actual figures. This helps with business forecasting and identifying discrepancies.
  • Include monthly and annual breakdowns: Break down the budget into monthly and annual sections. This provides a detailed view of financial forecasting and long-term planning.
  • Incorporate formulas for automatic calculations: Use formulas to calculate totals automatically. This saves time and reduces errors when tracking your template’s data in Excel.
  • Update the template regularly: Updating the template regularly will keep it current. This ensures your budget reflects real-time data, especially for monthly financial reports.
  • Visualize data with charts and graphs: Create charts or graphs to visualize your data. It enhances analytics tools for business, making financial trends clear and decisions.

FAQs

How to make a business budget in Excel?

  • Open a new Excel spreadsheet.
  • Define income and expense categories.
  • Input estimated amounts for income and expenses.
  • Use Excel formulas to calculate totals.
  • Track actual costs and compare them to the budget.
  • Regularly update the budget for accuracy.

How do I create a budget for my small business?

  • Identify your income sources.
  • List all fixed and variable expenses.
  • Estimate expected income and costs.
  • Enter the figures into an Excel template.
  • Review and adjust the budget monthly.
  • Track actual performance and adjust accordingly.

How do you calculate a business budget?

  • Estimate all income sources and expenses.
  • Subtract total expenses from income to calculate profit.
  • Use Excel formulas to simplify calculations.
  • Track actual results and compare them with budgeted figures.
  • Adjust the budget as needed based on performance.

Wrap Up

A business budget template in Excel is a valuable tool for any business. It helps track income and expenses in an organized way. This template lets you plan and manage your finances effectively, improving business finance management.

This template allows you to break down income sources and categorize expenses. It’s simple to input data and track your financial health over time. You can compare projected numbers with actual results, which helps improve data analysis and decision-making.

Excel offers built-in formulas to calculate totals, making budgeting easier. It saves time and reduces errors, ensuring accuracy in your financial reports.

One of the benefits of using this template is the ability to create monthly or annual budgets. This provides a clear picture of your business’s financial status. Based on profit and loss templates in Excel, you can monitor cash flow and adjust strategies.

Regularly updating the template keeps your budget current and relevant. This helps you make informed decisions and identify financial issues early. It’s a tool that can improve business forecasting and overall financial planning.

An Excel business budget template is essential for effective financial management. It simplifies budgeting, enhances accuracy, and helps businesses stay on track. To use it better, install ChartExpo for easy visualization and analysis of the data.

How much did you enjoy this article?

ExcelAd2
Start Free Trial!
151660

Related articles

next previous
Microsoft Excel13 min read

How to Analyze Survey Data in Excel? Easy-to-Follow Steps

Discover step-by-step methods on how to analyze survey data in Excel. Explore how to organize, compute, examine, and interpret survey results effectively.

Microsoft Excel9 min read

Advanced Excel Charts: Create Impactful Data Visuals

Excel has a wide range of advanced charts and graphs to present your data comprehensively. Learn about top advanced Excel charts and how to create them.

Microsoft Excel13 min read

How to Parse Data in Excel: A Complete Guide

How to parse data in Excel? It’s the process of breaking data into structured segments. Learn the techniques, formulas, and best practices for efficiency.

Microsoft Excel13 min read

How to Make Cool Excel Charts & Graphs?

Explore cool Excel charts and graphs that turn your data into engaging visuals. Perfect for making your reports clear, creative, and impactful.

Microsoft Excel9 min read

Workout Tracking Spreadsheet for Smarter Workout Insights

A workout tracking spreadsheet helps record and track your fitness progress. This blog demonstrates how to utilize it, providing tips, templates, and benefits.

ChartExpo logo

Turn Data into Visual
Stories

CHARTEXPO

  • Home
  • Gallery
  • Videos
  • Services
  • Pricing
  • Contact us
  • FAQs
  • Privacy policy
  • Terms of Service
  • Sitemap

TOOLS

  • ChartExpo for Google Sheets
  • ChartExpo for Microsoft Excel
  • Power BI Custom Visuals by ChartExpo
  • Word Cloud

CATEGORIES

  • Bar Charts
  • Circle Graphs
  • Column Charts
  • Combo Charts
  • Comparison Charts
  • Line Graphs
  • PPC Charts
  • Sentiment Analysis Charts
  • Survey Charts

TOP CHARTS

  • Sankey Diagram
  • Likert Scale Chart
  • Comparison Bar Chart
  • Pareto Chart
  • Funnel Chart
  • Gauge Chart
  • Radar Chart
  • Radial Bar Chart
  • Sunburst Chart
  • see more
  • Scatter Plot Chart
  • CSAT Survey Bar Chart
  • CSAT Survey Chart
  • Dot Plot Chart
  • Double Bar Graph
  • Matrix Chart
  • Multi Axis Line Chart
  • Overlapping Bar Chart
  • Control Chart
  • Slope Chart
  • Clustered Bar Chart
  • Clustered Column Chart
  • Box and Whisker Plot
  • Tornado Chart
  • Waterfall Chart
  • Word Cloud
  • see less

RESOURCES

  • Blog
  • Resources
  • YouTube
SIGN UP FOR UPDATES

We wouldn't dream of spamming you or selling your info.

© 2025 ChartExpo, all rights reserved.