• Home
  • Tools dropdown img
    • Spreadsheet Charts

      • ChartExpo for Google Sheets
      • ChartExpo for Microsoft Excel
    • Power BI Charts

      • Power BI Custom Visuals by ChartExpo
    • Word Cloud

  • Charts dropdown img
    • Chart Category

      • Bar Charts
      • Circle Graphs
      • Column Charts
      • Combo Charts
      • Comparison Charts
      • Line Graphs
      • PPC Charts
      • Sentiment Analysis Charts
      • Survey Charts
    • Chart Type

      • Box and Whisker Plot
      • Clustered Bar Chart
      • Clustered Column Chart
      • Comparison Bar Chart
      • Control Chart
      • CSAT Survey Bar Chart
      • CSAT Survey Chart
      • Dot Plot Chart
      • Double Bar Graph
      • Funnel Chart
      • Gauge Chart
      • Likert Scale Chart
      • Matrix Chart
      • Multi Axis Line Chart
      • Overlapping Bar Chart
      • Pareto Chart
      • Radar Chart
      • Radial Bar Chart
      • Sankey Diagram
      • Scatter Plot Chart
      • Slope Chart
      • Sunburst Chart
      • Tornado Chart
      • Waterfall Chart
      • Word Cloud
    • Google Sheets
      Microsoft Excel
  • Services
  • Pricing
  • Contact us
  • Blog
  • Support dropdown img
      • Gallery
      • Videos
      • Contact us
      • FAQs
      • Resources
    • Please feel free to contact us

      atsupport@chartexpo.com

Categories
All Data Visualizations Data Analytics Surveys
Add-ons/
  • Google Sheets
  • Microsoft Excel
  • Power BI
All Data Visualizations Data Analytics Surveys
Add-ons
  • Google Sheets
  • Microsoft Excel
  • Power BI

We use cookies

This website uses cookies to provide better user experience and user's session management.
By continuing visiting this website you consent the use of these cookies.

Ok

ChartExpo Survey


Home > Blog > Microsoft Excel

Excel Bookkeeping for Small Business: Insights at a Glance

What is Excel bookkeeping for small businesses, and why does it matter?

Many small business owners struggle with tracking expenses, revenue, and financial health. Without clear records, profits slip through the cracks, and growth stalls. Excel offers a simple, affordable way to manage finances without complex software.

Excel Bookkeeping for Small Business

More than 60% of small businesses fail within three years, often due to poor financial management. Spreadsheets help prevent this by organizing cash flow, tracking expenses, and monitoring KPIs for accounting. With Excel, business owners stay in control, analyzing data with advanced charts and automated formulas.

A well-structured Excel file can act as an expense report and a profit and loss statement for a small business. And it doesn’t stop here; it even acts as a forecasting tool. With customizable templates, you can track daily transactions, manage invoices, and monitor KPIs without hassle. Pivot tables, conditional formatting, and cool Excel charts and graphs turn spreadsheets into visual dashboards that highlight trends.

Financial clarity drives success. Whether tracking daily transactions or planning for future growth, Excel bookkeeping for small businesses is a game-changer. It helps you stay organized, make smarter decisions, and build a stronger foundation.

How?

Let’s find out.

Table of Contents:

  1. What is Bookkeeping in Excel?
  2. Why Use Excel Bookkeeping Templates for Small Businesses?
  3. How to Create a Bookkeeping System in Excel?
  4. How to Analyze Bookkeeping for Small Businesses in Excel?
  5. How to Use the Small Business Accounting Excel Template?
  6. Pros and Cons of Bookkeeping with Excel
  7. FAQs
  8. Wrap Up

What is Bookkeeping in Excel?

Definition: Bookkeeping in Excel involves tracking financial transactions using spreadsheets. It allows small businesses to organize income and expenses efficiently. With Excel, you can create custom reports, track sales, and manage budgets.

The flexibility of Excel formulas and templates makes monitoring financial performance easier. You can maintain clear records, identify trends, and stay on top of your financial responsibilities. This method also helps generate accurate reports for taxes and budgeting purposes.

Top 10 Charts for Bookkeeping in Excel

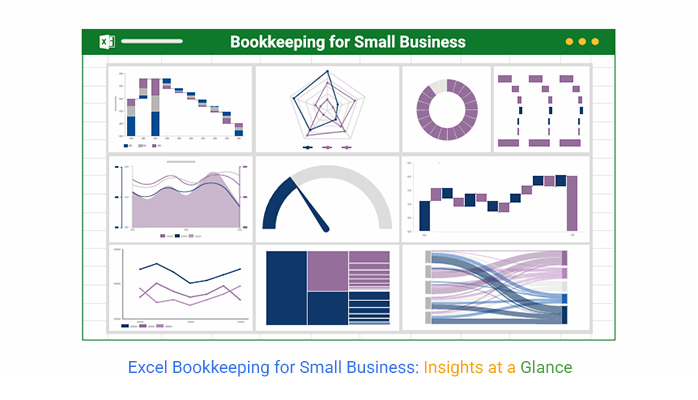
Want to take your Excel bookkeeping to the next level? Check out these 10 top charts you can use to turn those boring numbers into something fun and insightful! These charts were created using ChartExpo, a tool that works for your data.

Multi Axis Line Chart

Excel Bookkeeping for Small Business

Sankey Chart

Excel Bookkeeping for Small Business

Progress Circle Chart

Excel Bookkeeping for Small Business

Waterfall Chart

Excel Bookkeeping for Small Business

Horizontal Waterfall Chart

Excel Bookkeeping for Small Business

Stacked Waterfall Chart

Excel Bookkeeping for Small Business

Multi-Axis Spider Chart

Excel Bookkeeping for Small Business

Multi-Series Line Chart

Excel Bookkeeping for Small Business

Tree Diagram

Excel Bookkeeping for Small Business

Why Use Excel Bookkeeping Templates for Small Businesses?

Why use an Excel bookkeeping template for your small business? Well, for starters, it’s cost-effective and easy to use. You don’t need expensive software to manage your finances—just a good template and Excel.

Let me tell you more:

  • User-friendly and customizable: Excel templates are easy to understand and use, even for novice users. You can tweak them to suit the specific needs of your business and make bookkeeping a breeze.
  • Automatic calculations: Excel automatically processes totals, taxes, profits, etc. This saves you time and makes committing to other critical things easier.
  • Improves financial organization: Using a bookkeeping template in Excel helps you stay on top of your finances. The organized structure lets you quickly see where your money is going, helping you make better financial decisions.
  • Cost-effective: Excel bookkeeping templates are a cost-effective solution to high-priced guest accounting software. This simple tool allows you to track small business expenses and set your accounts straight within budget.
  • Generates financial reports: Excel allows you to create critical financial reports quickly. This allows you to assess your business’s performance easily and ensure everything is set for tax season.
  • Assist in decision-making: Organized data means you can make informed decisions about your business’s future more seamlessly. Using Excel templates helps you identify trends and opportunities and make decisions to drive your long-term financial goals, examples, and growth.

How to Create a Bookkeeping System in Excel?

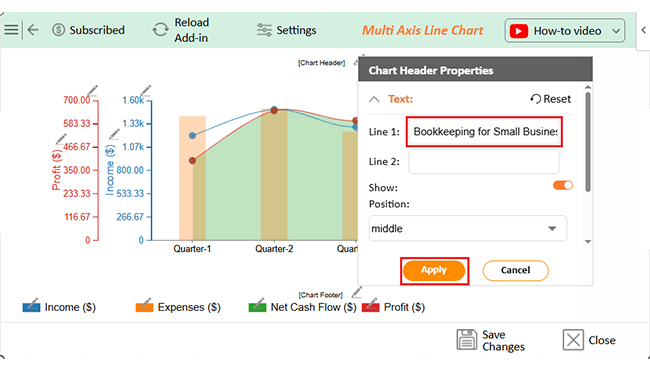
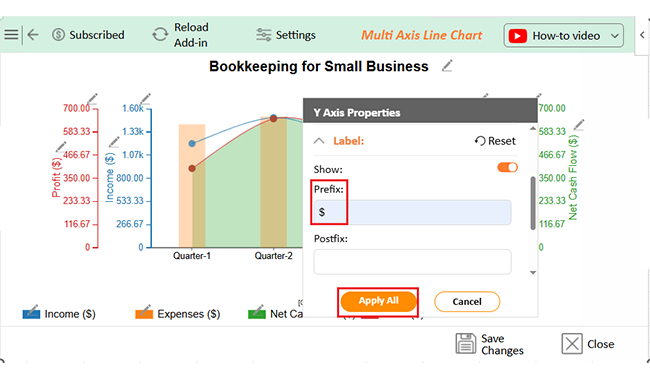
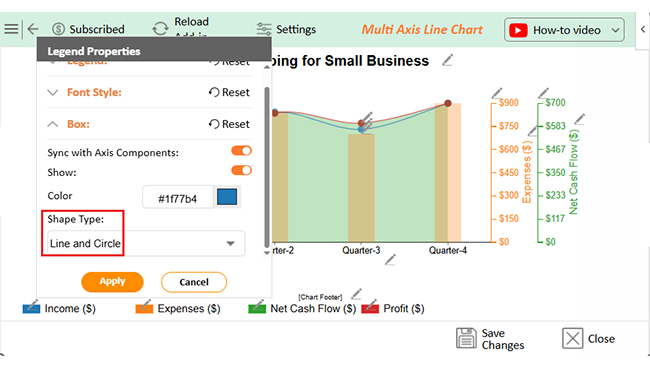
Creating a bookkeeping system in Excel is easy and effective. It helps you stay organized and manage your finances. Here’s how to set it up step by step:

  1. Set up a new workbook: Open a new Excel workbook and create sheets for income, expenses, accounts, and reports. This makes your bookkeeping clear and organized. (Pro tip: Use a bookkeeping template in Excel to get started quickly.)
  2. Create an income tracker: Track all income sources in a sheet. Add columns for date, description, payment method, and amount. This helps with creating financial models in Excel and analyzing your financial performance.
  3. Create an expense tracker: Record all expenses in another sheet and categorize them by type, like rent or salaries. This helps you manage business overhead costs and effectively visualize trends in your small business expense report.
  4. Track accounts payable & receivable: Track what you owe and what’s owed to you. Create separate sheets for accounts payable and accounts receivable. This ensures accurate financial reporting.
  5. Generate financial reports: Use Excel to generate financial reports like your profit and loss statement. You can also use a monthly financial report template in Excel. These reports are essential for your financial performance analysis examples.
  6. Automate calculations: Use Excel formulas to automate calculations. Set up SUM, AVERAGE, and other formulas to track totals. This will save time and ensure accuracy in your analysis.

How to Analyze Bookkeeping for Small Businesses in Excel?

Analyzing bookkeeping for a small business in Excel is like cooking a great meal with basic ingredients. It works, but it could be a lot more exciting.

While Excel’s powerful formulas and functions help track finances, it falls short regarding data visualization. Excel charts often lack the flair needed to truly analyze trends.

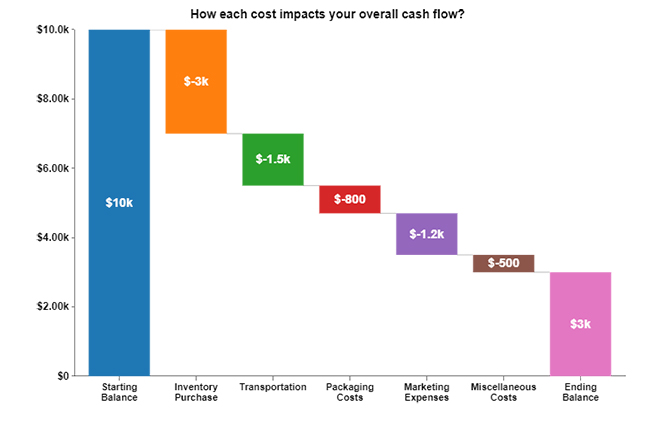
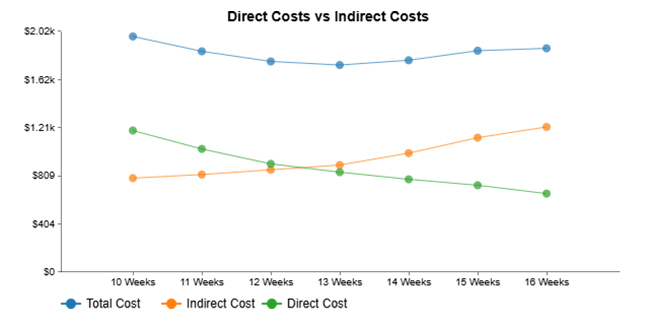
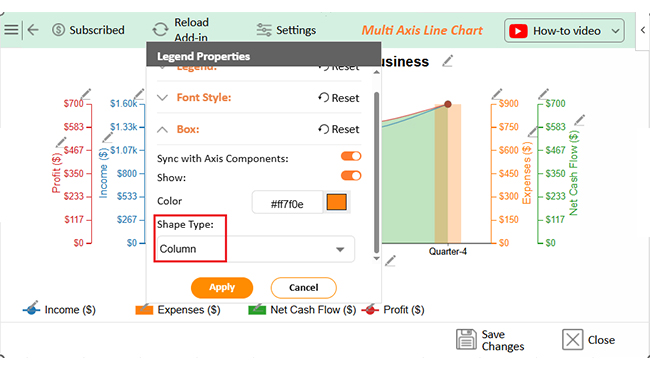
Enter ChartExpo. This tool transforms Excel’s raw data into insightful, easy-to-understand visualizations. Its advanced Excel charts are the perfect solution for any small business looking to improve its financial analysis.

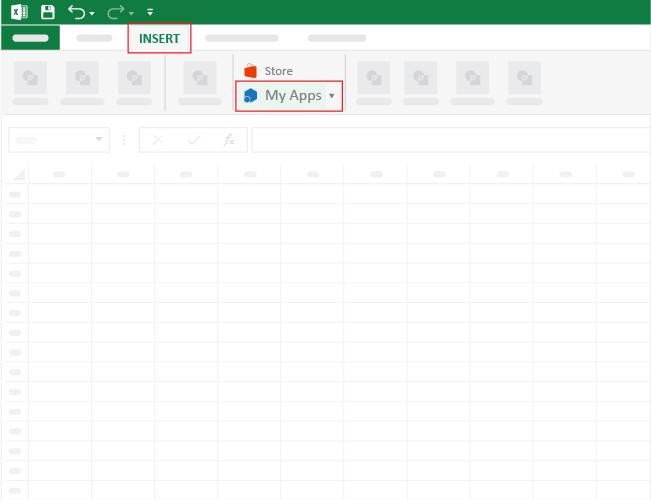
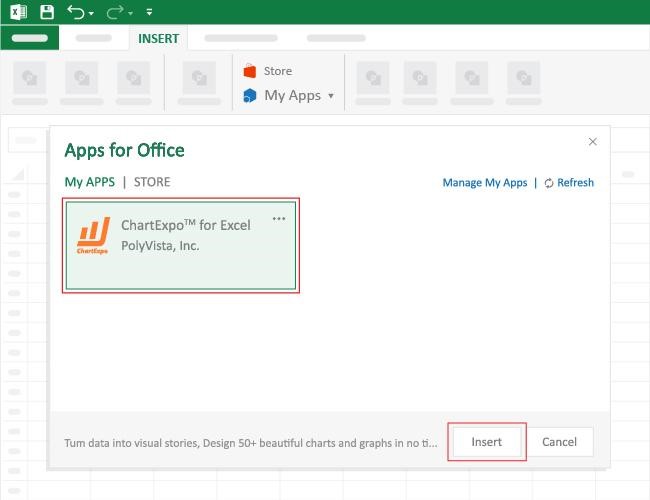
How to Install ChartExpo in Excel?

  1. Open your Excel application.
  2. Open the worksheet and click the “Insert” menu.
  3. You’ll see the “My Apps” option.
  4. In the Office Add-ins window, click “Store” and search for ChartExpo on the My Apps Store.
  5. Click the “Add” button to install ChartExpo in your Excel.

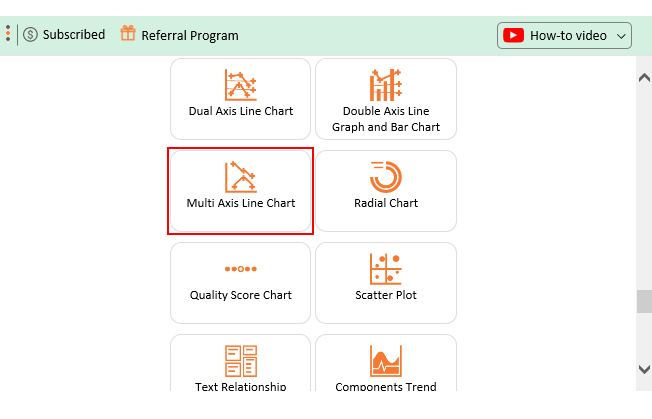
ChartExpo charts are available both in Google Sheets and Microsoft Excel. Please use the following CTAs to install the tool of your choice and create beautiful visualizations with a few clicks in your favorite tool.

Example

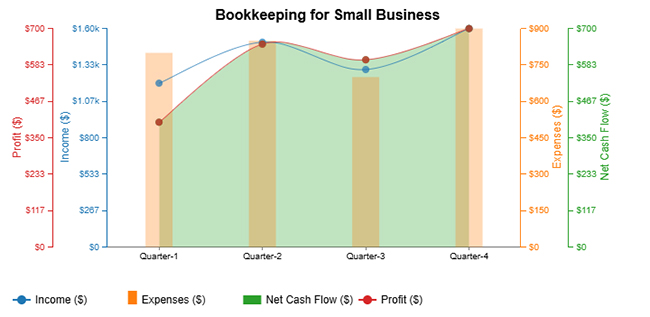
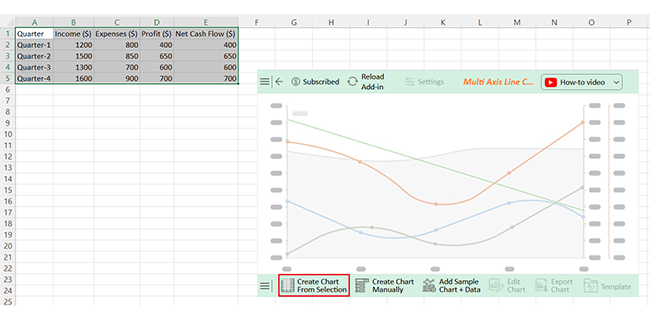
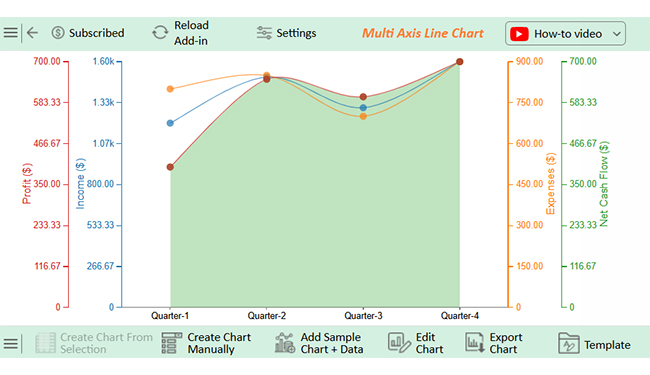
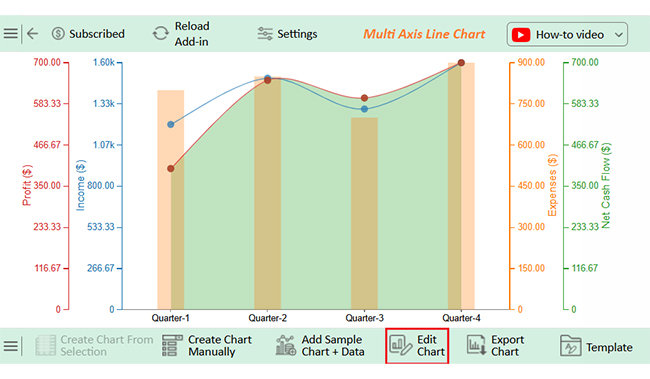
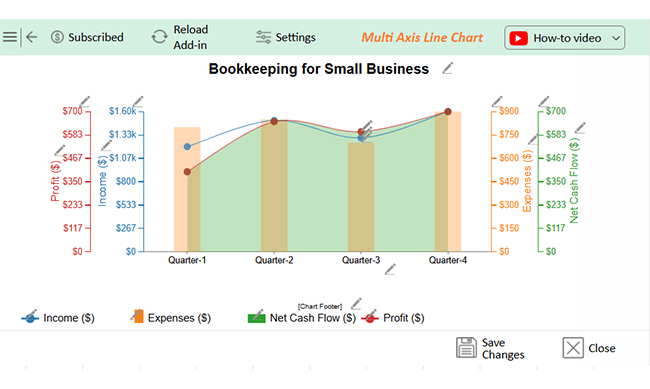
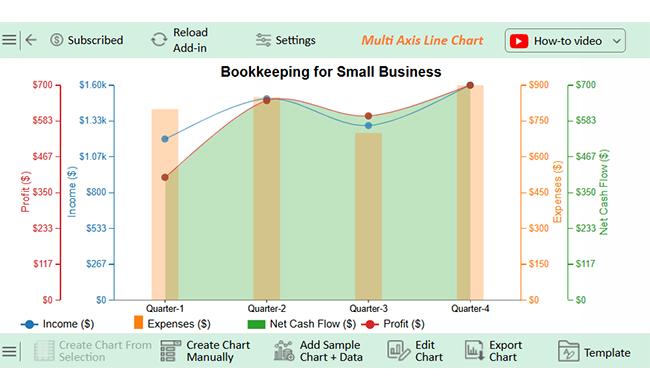
Let me use the data below to show you how to analyze financial statements in Excel using ChartExpo.

Quarter Income ($) Expenses ($) Profit ($) Net Cash Flow ($)
Quarter-1 1200 800 400 400
Quarter-2 1500 850 650 650
Quarter-3 1300 700 600 600
Quarter-4 1600 900 700 700
  • To get started with ChartExpo, install ChartExpo in Excel.
  • Now, click on My Apps from the INSERT menu.
Excel Bookkeeping for Small Business
  • Choose ChartExpo from My Apps, then click Insert.
Excel Bookkeeping for Small Business
  • Once it loads, scroll through the charts list to locate and choose the “Multi Axis Line Chart”.
Excel Bookkeeping for Small Business
  • Click the “Create Chart From Selection” button after selecting the data from the sheet, as shown.
Excel Bookkeeping for Small Business
  • ChartExpo will generate the visualization below for you.
Excel Bookkeeping for Small Business
  • Click on Settings and change the “Data Representation” as follows.
Excel Bookkeeping for Small Business
  • If you want to add anything to the chart, click the Edit Chart button:
Excel Bookkeeping for Small Business
  • Click the pencil icon next to the Chart Header to change the title.
  • It will open the properties dialog. Under the Text section, you can add a heading in Line 1 and enable Show.
  • Give the appropriate title of your chart and click the Apply button.
Excel Bookkeeping for Small Business
  • You can add the sign of ($) with all field values and also change the precision value to zero:
Excel Bookkeeping for Small Business
  • Change the Legend shape of “Income and Profit” into a Line and Circle, and click the “Apply” button.
Excel Bookkeeping for Small Business
  • Change the Legend shape of “Expenses” to Column and click the “Apply” button.
Excel Bookkeeping for Small Business
  • Click the “Save Changes” button to persist the changes made to the chart.
Excel Bookkeeping for Small Business
  • Your final Multi Axis Line Chart will look like the one below.
Excel Bookkeeping for Small Business

Insights

  • The data shows a steady rise in income and profit each quarter.
  • Quarter 4 has the highest figures.
  • Expenses stay stable, ensuring positive net cash flow.
  • Quarters 2 and 4 show the highest profitability, indicating efficient cost management.

How to Use the Small Business Accounting Excel Template?

A small business accounting Excel template can save you time and keep your finances in check. It’s a simple way to organize your data and track key metrics.

Here’s how you can make the most of it.

  1. Download or create an Excel template: You can start by downloading a pre-made Excel template or creating your own. Templates make it easy to get started. They usually come with predefined categories for income, expenses, and more.
  2. Input business income: Enter your business income into the template. Add columns for the date, source, payment method, and amount. This is key for tracking your revenue.
  3. Record business expenses: Next, record all business expenses. Categorize them by type, such as rent, utilities, and supplies. This will help you understand your business overhead costs and track spending trends.
  4. Monitor accounts payable & receivable: Track what you owe and what customers owe you. Set up two sections: one for accounts payable and one for accounts receivable. This keeps your cash flow organized.
  5. Generate financial reports: Use the data in your template to generate financial reports. A profit and loss statement for small businesses is a good start.
  6. Automate calculations: Use Excel’s formulas to automate your calculations for totals, averages, and projections. This will help with your analysis and make the bookkeeping process smoother.

Pros and Cons of Bookkeeping with Excel

Bookkeeping with Excel is a popular choice for small business owners. It’s an affordable and flexible solution to manage finances. But, like anything, there are both pros and cons. Let’s break them down:

Pros of Bookkeeping with Excel

  • Cost-effective: Excel is free or comes with a low-cost Microsoft Office subscription. It’s a great option for small businesses on a budget.
  • Customizable: You can easily set up Excel to match your business needs. Customize it with categories for income, expenses, and more.
  • Easy to use: Excel is user-friendly. You don’t need advanced skills to start tracking your finances.
  • Automation capabilities: Excel’s formulas and functions can automate calculations, saving time and ensuring accuracy in financial reports.
  • Offline access: Excel works offline. You don’t need an internet connection to update or access your financial data.

Cons of Bookkeeping with Excel

  • Prone to errors: Manual data entry can lead to mistakes. Even small errors can cause significant problems in your financial reports.
  • Limited scalability: As your business grows, Excel might not keep up. Large datasets can make Excel slow and more challenging to manage.
  • No real-time data syncing: Unlike cloud-based software, Excel doesn’t sync data in real-time. This means you’ll need to update everything manually.
  • Security concerns: Excel files are vulnerable to unauthorized access. Without strong security measures, sensitive financial data can be at risk.
  • No built-in tax or compliance features: Excel doesn’t have built-in tax calculations or compliance tools. You’ll need to do this manually or use external resources.

FAQs

Can you use Excel for small business bookkeeping?

Yes, you can use Excel for small business bookkeeping. It’s affordable and flexible. Excel helps track income, expenses, and profits. However, it lacks advanced data visualization and real-time syncing features. So, consider additional tools for more complex needs.

Is Excel good for bookkeeping?

Excel is good for basic bookkeeping. It’s affordable and customizable, and you can easily track income, expenses, and profits. However, it lacks advanced features like real-time syncing and built-in tax tools. It’s best for small businesses with simple needs.

Can you do double-entry bookkeeping in Excel?

Yes, you can do double-entry bookkeeping in Excel. Create two columns for debits and credits. Each transaction is recorded in both, ensuring accuracy. Excel’s formulas can help balance the accounts. It’s an excellent option for small businesses.

Wrap Up

Excel bookkeeping: One of the best solutions for small businesses. You can use it to monitor revenue, expenditures, and earnings, informing you how well the business is financially.

In Excel, you can tailor templates to your specific requirements. This helps you track cash flow, generate reports, and review your business performance. But no matter how powerful Excel is, it has its limitations. Charting in Excel can be difficult, especially when needing advanced charts. Why? The charts available in Excel are often too basic for in-depth financial analysis.

This is where ChartExpo comes into the picture. ChartExpo is a powerful tool that enhances Excel’s data visualization capabilities. It turns your raw financial data into insightful, easy-to-understand visual reports. With ChartExpo, you can create detailed charts and graphs that help you better analyze and interpret your bookkeeping data.

If you want to improve your small business bookkeeping, don’t hesitate to try ChartExpo. Install it now and start creating insightful financial reports that will help you make better business decisions.

Excel bookkeeping is good; ChartExpo makes it great.

How much did you enjoy this article?

ExcelAd1
Start Free Trial!
150891

Related articles

next previous
Microsoft Excel9 min read

Advanced Excel Charts: Create Impactful Data Visuals

Excel has a wide range of advanced charts and graphs to present your data comprehensively. Learn about top advanced Excel charts and how to create them.

Microsoft Excel13 min read

How to Parse Data in Excel: A Complete Guide

How to parse data in Excel? It’s the process of breaking data into structured segments. Learn the techniques, formulas, and best practices for efficiency.

Microsoft Excel13 min read

How to Make Cool Excel Charts & Graphs?

Explore cool Excel charts and graphs that turn your data into engaging visuals. Perfect for making your reports clear, creative, and impactful.

Microsoft Excel9 min read

Workout Tracking Spreadsheet for Smarter Workout Insights

A workout tracking spreadsheet helps record and track your fitness progress. This blog demonstrates how to utilize it, providing tips, templates, and benefits.

Microsoft Excel12 min read

Weighted Average on Excel Simplified for Accurate Analysis

Improve your analysis with the weighted average on Excel. This guide explains how to apply it for more accurate insights in grading, finance, and performance.

ChartExpo logo

Turn Data into Visual
Stories

CHARTEXPO

  • Home
  • Gallery
  • Videos
  • Services
  • Pricing
  • Contact us
  • FAQs
  • Privacy policy
  • Terms of Service
  • Sitemap

TOOLS

  • ChartExpo for Google Sheets
  • ChartExpo for Microsoft Excel
  • Power BI Custom Visuals by ChartExpo
  • Word Cloud

CATEGORIES

  • Bar Charts
  • Circle Graphs
  • Column Charts
  • Combo Charts
  • Comparison Charts
  • Line Graphs
  • PPC Charts
  • Sentiment Analysis Charts
  • Survey Charts

TOP CHARTS

  • Sankey Diagram
  • Likert Scale Chart
  • Comparison Bar Chart
  • Pareto Chart
  • Funnel Chart
  • Gauge Chart
  • Radar Chart
  • Radial Bar Chart
  • Sunburst Chart
  • see more
  • Scatter Plot Chart
  • CSAT Survey Bar Chart
  • CSAT Survey Chart
  • Dot Plot Chart
  • Double Bar Graph
  • Matrix Chart
  • Multi Axis Line Chart
  • Overlapping Bar Chart
  • Control Chart
  • Slope Chart
  • Clustered Bar Chart
  • Clustered Column Chart
  • Box and Whisker Plot
  • Tornado Chart
  • Waterfall Chart
  • Word Cloud
  • see less

RESOURCES

  • Blog
  • Resources
  • YouTube
SIGN UP FOR UPDATES

We wouldn't dream of spamming you or selling your info.

© 2025 ChartExpo, all rights reserved.