Categories
The DAX filters function in Power BI allows a user to filter data based on specific criteria. Users can use the function to extract a subset of data from a larger dataset. This way, the user will be able to focus on the information that is most relevant to the analysis.


This guide will help you figure out what the DAX filters function is, why the DAX filters function is important, and what the purpose of the DAX filters function in Power BI is.
First…
Here are the major DAX filters functions:
The DAX Filters function is important in Power BI and other tools leveraging the Data Analysis Expressions (DAX) language because it plays a critical role in refining and customizing data analysis. Here’s why the Filters function matters:
In this section, you’ll discover the syntax of the filter function.
filter
Here’s how to implement the FILTER function in Power BI:
In the example, you’ll notice the creation of a Power BI report of Internet sales outside the United States using a measure that filters out sales in the US. There’s slicing by calendar year and product categories. To create the measure, you’ll filter the table, Internet Sales USD, by using Sales Territory. After that, use the filtered table in a SUMX function.
The expression for the example is:
FILTER(’InternetSales USD’, RELATED(’SalesTerritory’[SalesTerritoryCountry])<>”United States”)
Return the table that is a subset of Internet Sales minus all rows that belong to the United States sales territory. The RELATED function links the Territory Key in the Internet Sales table to SalesTerritoryCountry in the SalesTerritory table.
The table below shows a proof of concept for the measure, NON-USA Internet Sales, the formula is provided in the code section. The table compares all Internet sales with non-USA Internet sales, and it shows that the filter expression works, by excluding the US from the computation.
To recreate the table, add the field, SalesTerritoryCountry, to the Row Labels area of the report or PivotTable.
| Row Labels | Internet Sales |
Non-USA Internet Sales
|
| Australia | $4,999,021.84 | $4,999,021.84 |
| Canada | $1,343,109.10 | $1,343,109.10 |
| France | $2,490,944.57 | $2,490,944.57 |
| Germany | $2,775,195.60 | $2,775,195.60 |
| United Kingdom | $5,057,076.55 | $5,057,076.55 |
| United States | $9,389,479.79 | 0 |
| Grand Total | $26,054,827.45 | $16,665,347.67 |
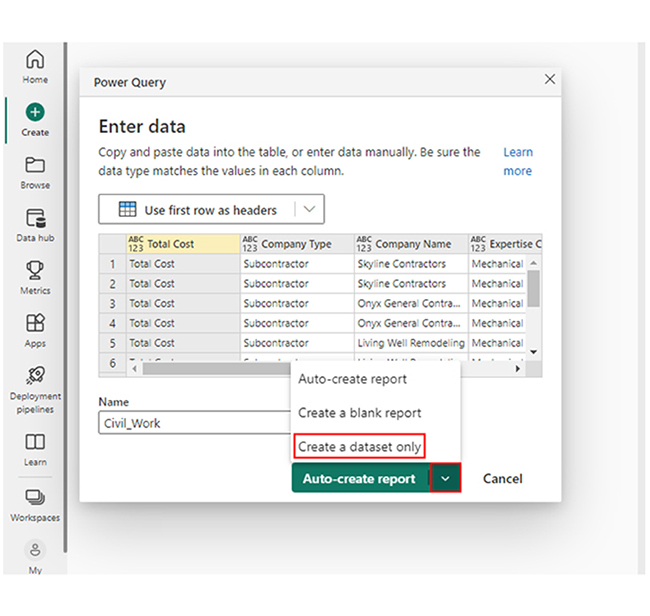
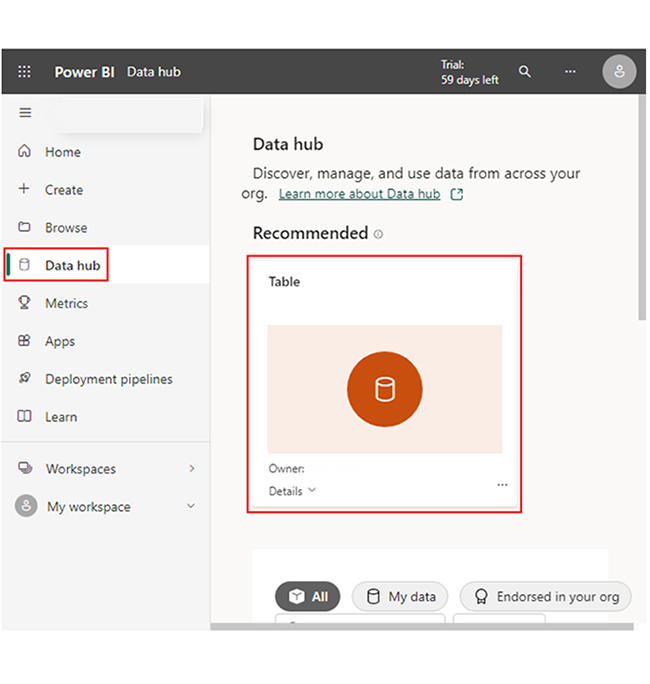
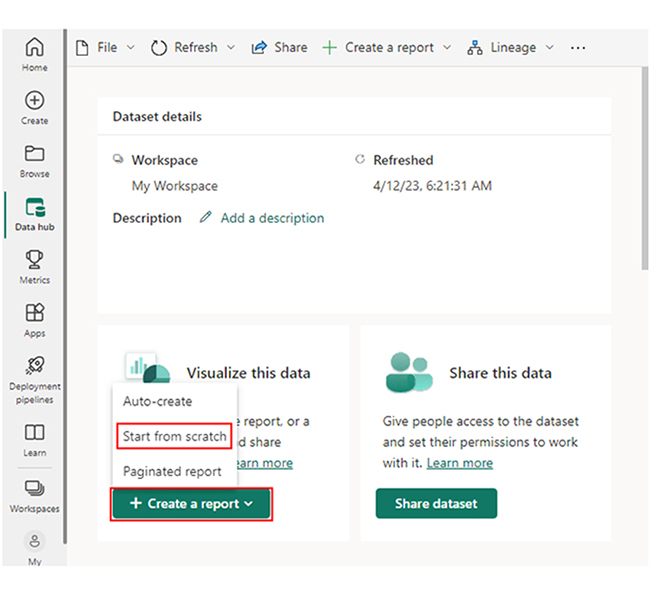
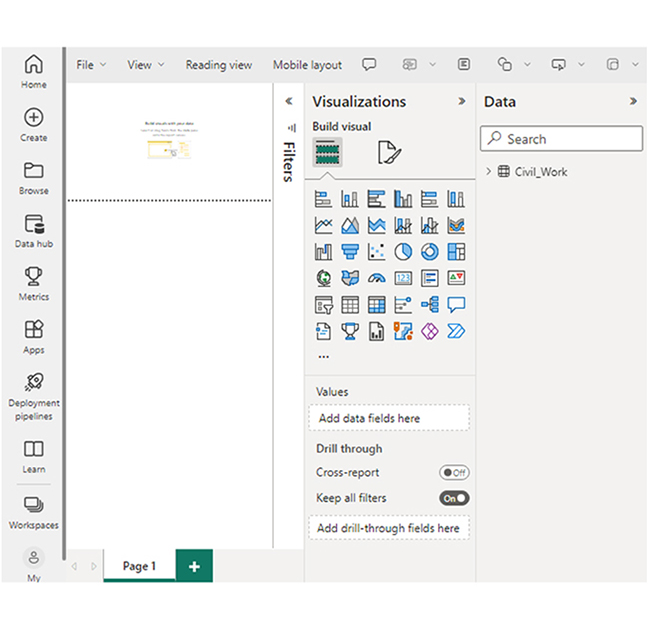
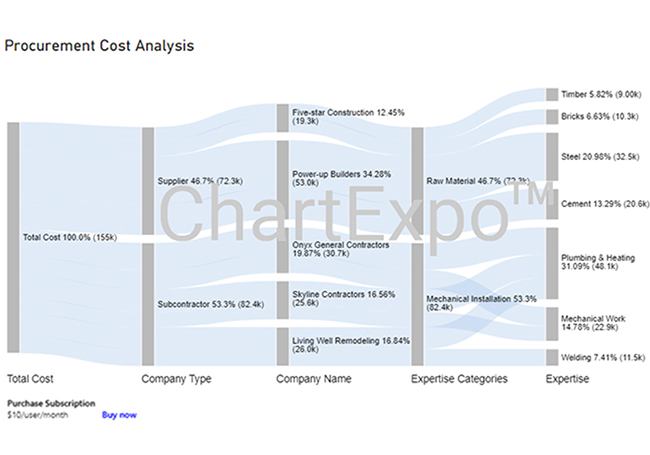
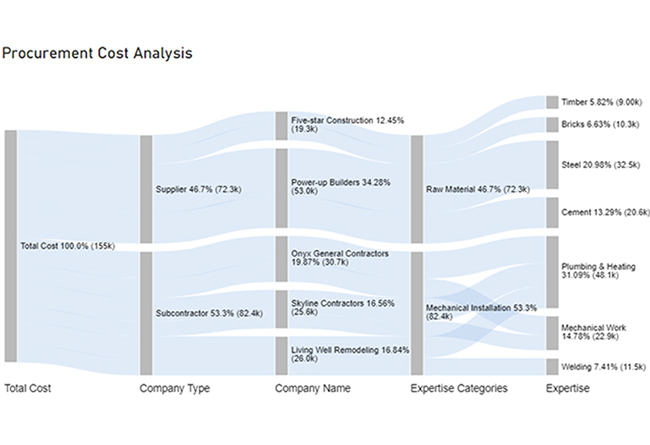
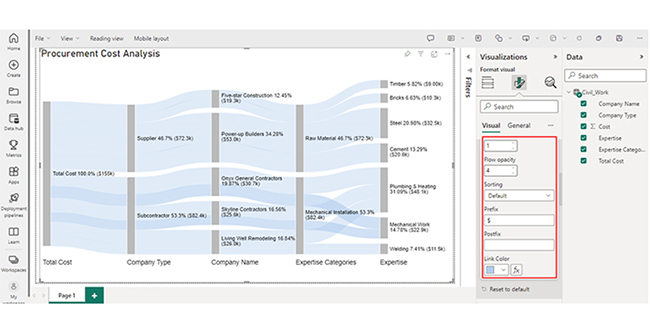
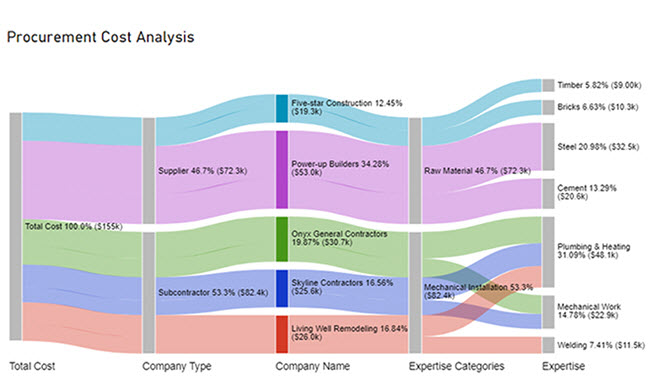
Learn how to analyze the DAX FILTERS function in Power BI and visualize the results effectively using Power BI charts.


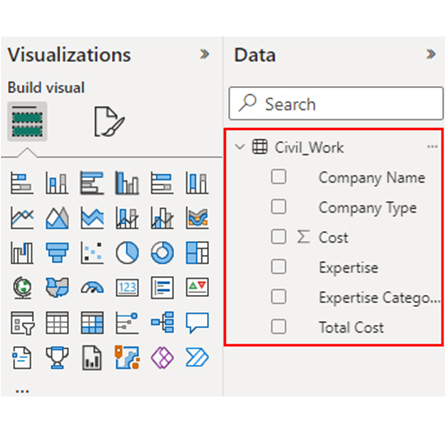
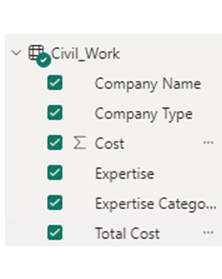
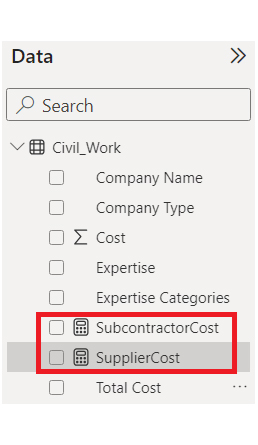
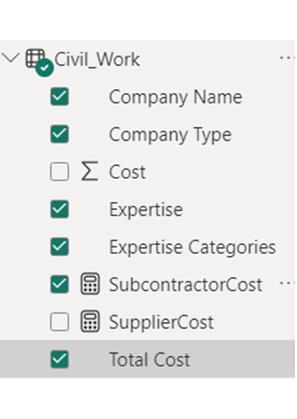
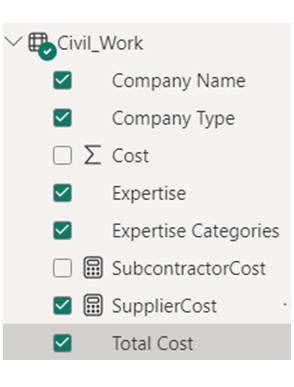
| Total Cost | Company Type | Company Name | Expertise Categories | Expertise | Cost |
| Total Cost | Subcontractor | Skyline Contractors | Mechanical Installation | Plumbing & Heating | 15456 |
| Total Cost | Subcontractor | Skyline Contractors | Mechanical Installation | Mechanical Work | 10159 |
| Total Cost | Subcontractor | Onyx General Contractors | Mechanical Installation | Plumbing & Heating | 18045 |
| Total Cost | Subcontractor | Onyx General Contractors | Mechanical Installation | Mechanical Work | 12695 |
| Total Cost | Subcontractor | Living Well Remodeling | Mechanical Installation | Plumbing & Heating | 14589 |
| Total Cost | Subcontractor | Living Well Remodeling | Mechanical Installation | Welding | 11456 |
| Total Cost | Supplier | Power-up Builders | Raw Material | Cement | 20561 |
| Total Cost | Supplier | Power-up Builders | Raw Material | Steel | 32456 |
| Total Cost | Supplier | Five-star Construction | Raw Material | Bricks | 10253 |
| Total Cost | Supplier | Five-star Construction | Raw Material | Timber | 9000 |
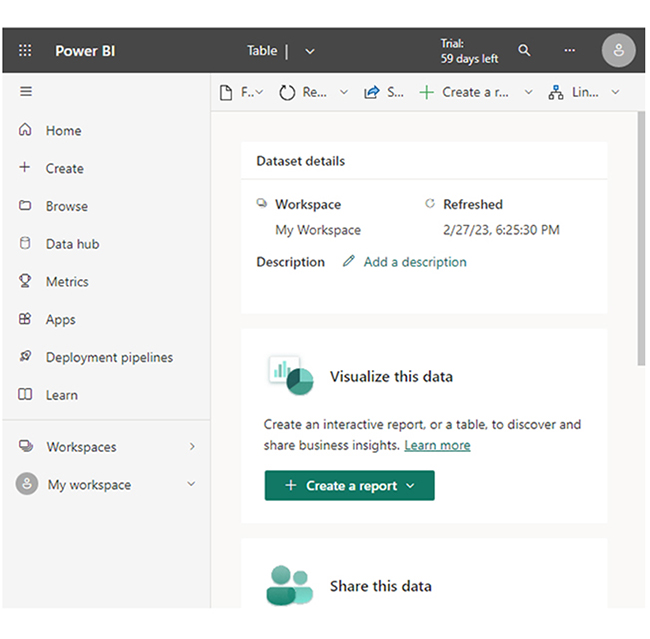
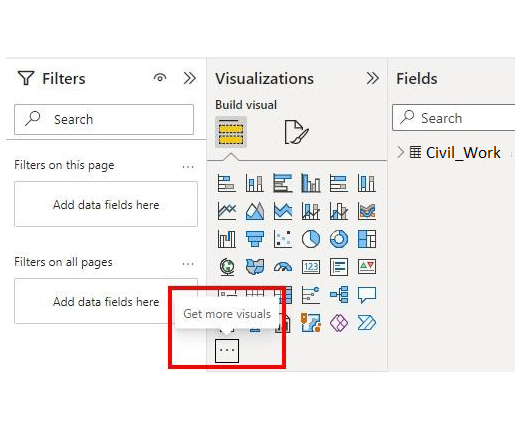
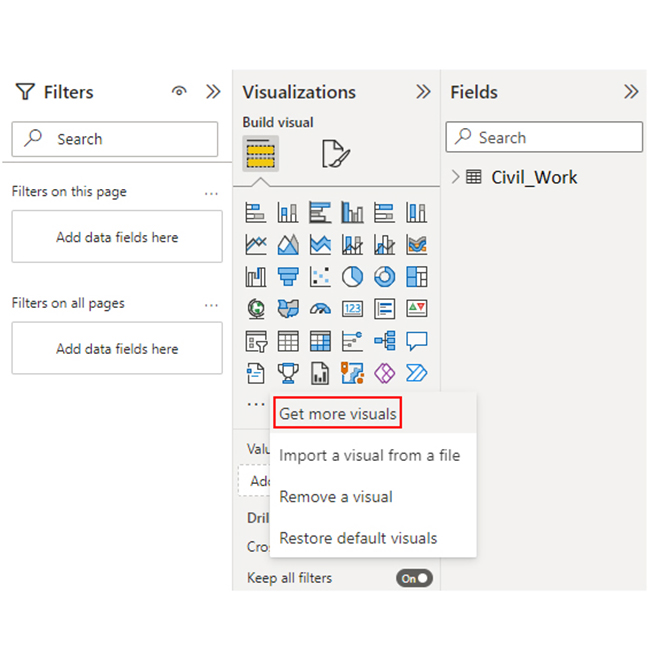
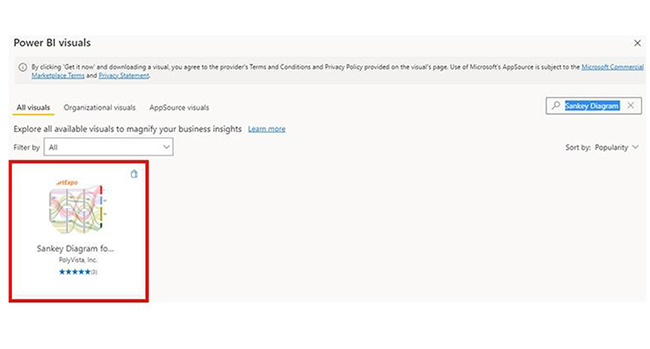
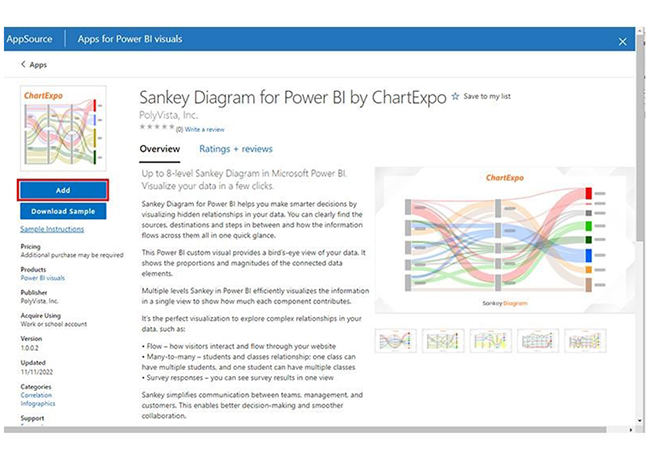

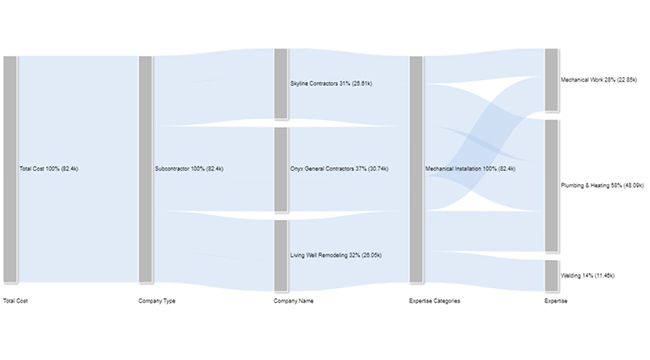
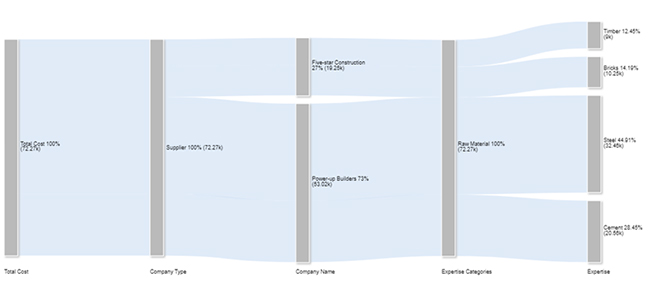
The following video will help you create a Sankey Chart in Microsoft Power BI.
The DAX filters function is used to select and apply specific criteria (or conditions). It gives room for tailored analyses based on the user-defined filters (or slicer selections) in Power BI.
No, the FILTER function in DAX is not an iterator. It’s a table function that filters data based on specified conditions.
You’ll have to use functions like FILTER or CALCULATETABLE.
The DAX function plays a major role in specifying conditions for filter data, and that enables dynamic calculations and analysis. It shapes the calculation context and allows for targeted and meaningful data manipulation in Power BI.
One of the major importance of the DAX filters function is row-level security. With the DAX filters function, the user will easily define security filters to restrict data access based on the permissions and roles of the user.
The DAX filters function also comes in handy when performing complex calculations. It’s a great fit for complex calculations that involve multiple criteria or conditions. With the DAX filters function, users can create sophisticated expressions to handle various scenarios.
Now you know how the DAX filters function works, how will you integrate it into your data analysis?
How much did you enjoy this article?


Discover diverse and high-quality Power BI report examples for inspiration and insights. Elevate your reporting with strategic visualization techniques.

A Customer Relationship Management Dashboard centralizes data, tracks key metrics, and drives smarter business decisions. Discover now!

Explore Healthcare Dashboard Examples and learn how to turn complex healthcare data into clear, actionable insights for better decision-making.


