Categories
By ChartExpo Content Team
Numbers don’t lie, but they don’t always tell the full story unless you know how to present them. That’s where statistical graphs come in. Whether you’re analyzing sales data, tracking user behavior, or looking for trends, statistical graphs can help you visualize the patterns hidden in the numbers. By turning raw data into clear visuals, you’ll gain insights that are easy to understand and act on.
Statistical graphs are more than charts. They’re tools that let you see relationships, spot anomalies, and understand data faster. When you’re dealing with a lot of numbers, it’s easy to feel overwhelmed. But with the right graph, you can quickly identify what matters most without getting lost in the details. Whether it’s a simple bar graph or a complex scatter plot, statistical graphs help you make data-driven decisions with confidence.


Why should you care about statistical graphs? Because they save time and make your findings clear to everyone, even if they’re not data experts. You don’t have to be a statistician to use them effectively. With the right approach, statistical graphs will make your data work for you and your audience.
First…
In today’s fast-paced world, making data-driven decisions is key, and that’s where statistical graphs enter the picture. They turn raw data into visual stories, making it easier to see patterns, trends, and outliers.
Think about it: when data points transform into a graph, insights become clearer and decisions become sharper.
Statistical graphs are tools that show numbers in a visual way. They make it easier to understand data by turning it into shapes like bars, lines, or pie slices. Instead of looking at a bunch of numbers, you can look at a graph and get the big picture fast.
These graphs help you spot trends, compare things, or see how something changes over time. They’re like maps for numbers, helping you find your way through all the data.
Imagine trying to find a pattern in a sea of numbers. Tough, right? Now, picture those numbers as a colorful bar chart or a dynamic line graph. Suddenly, you spot trends and correlations in no time!
Statistical graphs do not just present data; they highlight the insights hidden within, making them indispensable for anyone looking to understand the full picture quickly and effectively.
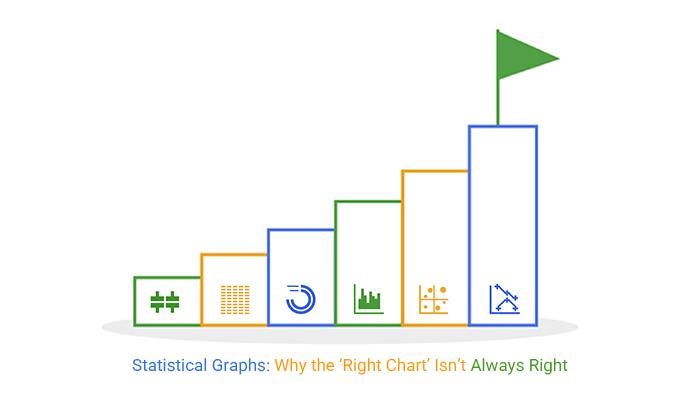
Each chart type serves a unique purpose. Let’s break it down:
When you’re swimming in data, picking the right chart can seem like finding a needle in a haystack. Fear not! The right chart can turn your data swamp into a clear lake.
Start by asking, “What do I want to know?” Are you comparing values, showing distribution, or understanding relationships? Line charts are great for trends over time, while bar charts highlight comparisons among categories.
So, next time you pick a chart, think about your data story. What tale are you telling?
Sorting your data for graph types can be a bit like sorting laundry – get it wrong, and things can mix up! First, identify whether your data is categorical (labels or names) or numerical (numbers).
Categorical data loves pie charts and bar graphs; they show data slices and comparisons well.
Numerical data? It’s all about histograms and scatter plots, which display distributions and relationships. By categorizing your data first, you ensure your graph fits like a glove!
Imagine a toolbox – each tool has a purpose. It’s the same with charts. Here’s a simple framework to avoid the hammer-when-you-need-a-screwdriver scenario.
Step 1: Identify your data type – is it categorical, numerical, or time-based?
Step 2: Define your goal. Looking for trends, relationships, or distributions?
Step 3: Match your data and goal to the chart type.
This framework acts like a roadmap, guiding you to the right chart without detours.
Visual tools are your friends in the graph-making journey. These are software and apps that help you turn raw data into clear, eye-catching graphs, including tools for creating a Control chart in Excel. Think of them as your data’s best stylists – making it ready for the big stage.
From basic tools like Excel to more advanced ones like Power BI, these tools offer templates and features to create nearly any type of charts and graphs. Whether you’re a data rookie or a pro, there’s a tool that can help you present your data at its best.
Ever feel overwhelmed by huge chunks of data? Don’t fret! Using the right statistical graph types can turn that mountain of data into a walk in the park. Think of it as choosing the right glasses to see clear patterns and trends. Bar graphs, line charts, and scatter plots aren’t just pretty pictures; they help us spot what matters in a sea of numbers.
Let’s tidy up those messy graphs! Aggregation is all about simplifying. By summarizing data into groups or categories, we can get a clearer, cleaner view of the information. It’s like cleaning up your room so you can find your stuff faster. Sum, average, or median – pick your tool and start making those graphs neat and meaningful.
Binning data is like sorting your candy by color or size; it helps you see what you’ve got more clearly. By grouping continuous data into bins or intervals, we create easier-to-digest graphs. This technique reduces noise and lets the true shape of the data distribution stand out. It’s a simple trick that can make your graphs much more insightful.
Dealing with a gigantic dataset? Sampling is your best buddy. Instead of wrestling with all that data, we take a smaller, manageable “sample” that represents the whole. It’s like checking a few pieces of a jigsaw puzzle to guess the big picture. This way, we can make graphs and analyze data without getting bogged down by the volume.
When creating stat graphs, it’s essential to keep them clean and easy to read. Too much information can overwhelm your audience, making it hard for them to understand the key points, especially when presenting structured data like a population pyramid types. Start by including only the most necessary data.
If a piece of information doesn’t directly support your main message, leave it out. Use simple designs and avoid heavy text labeling or overly complex visual elements. Clear, direct graphs are more effective than those crammed with data.
To make your statistics graphs as impactful as possible, concentrate on the key variables. Highlight the main data points that are critical for your analysis or story. This focus helps your audience quickly grasp what’s important without getting lost in less relevant details.
Use color and size to draw attention to these key variables, ensuring they stand out at first glance.
Layering data can be a fantastic way to present complex information in an understandable way. Start with a base layer that shows the general trend or the background context. Then, add a second layer with more specific data. This method allows viewers to get the overall picture first and then the detailed insights as they continue to look at the graph.
Make sure each layer is distinct but complementary, using different colors or styles to differentiate them clearly.
Grouping related data together in your graphs can significantly enhance clarity. Organize the data into logical groups that make sense for your data analysis or the story you’re telling. This organization helps prevent confusion and makes it easier for your audience to follow along.
Use clear labels and consistent formatting for each group to maintain a cohesive look and feel across your graph. This not only aids in understanding but also makes your graph more visually appealing.
When presenting data, accuracy in your graphs and charts is key. Start by double-checking the data you input. A simple error in data entry can lead to a graph that misleads rather than informs.
Next, use software that’s reliable. Opt for well-known tools that are trusted in the industry. This reduces the risk of errors that can occur with less robust programs.
Proper labeling and scaling on graphs are crucial for clarity. Make sure every axis is clearly labeled with the correct units of measurement. The scale should be even and appropriate for the range of data. Avoid scales that are too cramped or too spread out, as they can distort the perception of how values relate to each other.
Annotations and legends add necessary context to your charts. An annotation can highlight key points and data trends, making the information easier to understand at a glance. Legends are essential, especially when your chart includes multiple data sets or variables. They help decode the colors and symbols used, making your chart accessible to everyone.
To avoid misinterpretation, keep your graphs simple and focused. Don’t overload your charts with too much information. Stick to one main idea per graph. Choose the right type of chart for your data.
For instance, use a bar chart for categorical data and a line chart for continuous data. This helps the viewer instantly grasp the message without confusion.
Ever felt tangled in a web of complex statistical terms? We’re here to clear the fog. When you see the term “mean,” think average. Easy, right? And “median”? It’s simply the middle value when all numbers are lined up.
Standard deviation might sound fancy, but it’s just a measure of how spread out the numbers are. Keep these simplifications in mind, and you’re on your way to mastering those graph examples!
Diving deeper into statistical graphs, let’s decode some more terms. “Variance” scares many, but it’s just how much numbers differ from the average. Think of it as a sibling of standard deviation.
“Frequency” is merely how often something happens.
Lastly, “correlation” tells us about the relationship between two things, and a correlation matrix in Excel helps you see these relationships clearly across multiple variables. Positive means they move together, negative means they move apart. Got it? Great!
Visual aids can be game changers in understanding statistical charts. For instance, pie charts are like pizza slices showing parts of a whole.
Bar charts? They’re like measuring sticks for different categories.
Line graphs are timelines, showing trends over time. Using these familiar comparisons, statistical charts become less intimidating and more relatable.
Interactive learning brings life to statistical graph examples. Imagine dragging bars in a bar chart to see how the mean changes or adjusting points on a scatter plot to observe correlation shifts. This hands-on approach not only makes learning fun but also cements your understanding of how statistics work in real time.
When you want to see the big picture, nothing does the job like a good graph. Statistical graphs aren’t just lines and bars; they tell stories, showing trends in data over time. By observing these visual representations, you can quickly grasp upward or downward movements and the overall direction of your data set.
Ever looked at a graph and felt overwhelmed by all the ups and downs? Smoothing techniques are here to save the day! These methods help simplify the visual noise, making the trends clearer without altering the raw data.
Whether it’s moving averages or loess – a local regression method – smoothing techniques make graphs easier to understand, helping you focus on the broader trend rather than getting lost in daily fluctuations.
Adding a trend line to a statistical graph is like having a guide through a busy street. It helps you see where things are heading. By fitting a line through the data points, trend lines show the general direction of the data, helping predict future movements. Whether linear, exponential, or polynomial, these lines make it easier to identify the overall trend amidst the noise.
Not all that glitters is gold, and not all spikes in your graph are crucial trends. Noise refers to those random variations or fluctuations in data that might look important but don’t actually signify anything consistent. Identifying noise helps in focusing on true trends. It’s about separating the wheat from the chaff, ensuring that decisions are based on solid, reliable patterns.
When you’re eyeballing stats, choosing the right graph can make or break your understanding. Bar graphs? Great for comparing categories. Line graphs? Ideal for spotting trends over time. Pie charts? They show parts of a whole, so you see what’s eating up your pie, so to speak. Every graph type has its strengths, so picking the right one can light up your data like a Christmas tree!
Ever seen a graph where the axes look like they’re playing hopscotch? Consistent scales are your best friend here. Whether it’s a bar chart or a scatter plot, lining up those axes makes your data comparison as smooth as a jazz tune. Standard axes let you avoid the mess and see the actual trends. It’s about keeping things on the level – literally.
Imagine you’ve got a bunch of data and you want to see it all side by side. That’s where faceting comes into play. It’s like those split-screen scenes in movies, showing different angles all at once. Faceting in graphs lets you compare multiple subsets of your data under the same conditions. It’s a neat trick to see how different pieces stack up against each other without flipping back and forth.
When you look at a statistical graph, the last thing you want is to be tricked! Misleading graphs can make it tough to understand real trends and make smart decisions. So, what’s the trick to avoiding them?
Always check the scales on the axes. If they’re too stretched or squished, they could give the wrong impression.
Also, watch out for missing data labels or data points that don’t add up. Keeping an eye on these things helps keep those graphs honest!
Setting up your axes right is key in statistical graphs. You want everyone to get what the graph is about without scratching their heads. Always start your y-axis at zero to avoid exaggerating your data. It’s like keeping your feet on the ground – keeps things real, especially when comparing outputs like a confidence interval graph, where accurate scaling is important.
Also, keep your axis intervals consistent. Imagine climbing stairs where each step is a different height – not fun, right? The same goes for your graph intervals.
Getting proportionality right in statistical graphs is like making sure every player on a basketball team gets the chance to shoot. If the scale is off, it can make a small thing look too big or a big thing look too small. Always use the same scale for similar data sets to avoid confusion. Remember, fair play is key in statistics too!
When we dive into the vibrant world of marketing, statistics are our best friends. They tell us stories about consumer behavior, market trends, and campaign performance in a way that’s both insightful and visually appealing. Let’s explore how statistical graphs can transform raw data into marketing gold!
Imagine you’re trying to figure out which part of your marketing campaign is doing the magic. Is it the catchy Facebook ads, the Instagram stories, or those snappy tweets? Here’s where statistical graphs come in handy. By plotting key metrics like click-through rates, conversion rates, and engagement levels, you can see at a glance what’s working and what’s not. No more guessing games!
Now, let’s say your campaign just wrapped up, and it’s time to show off your results. A well-crafted bar graph or line chart can showcase your successes in a way that’s easy for everyone to understand. Whether you’re presenting to your team, stakeholders, or clients, these graphs can help everyone see the fruits of your labor without getting bogged down by numbers.
Keeping an eye on trends is like having a marketing crystal ball. It lets you predict the future by understanding the past. By using different types of statistical graphs, such as time series charts in Excel or moving averages, you can spot patterns and trends in consumer behavior. This insight is priceless when planning future campaigns or adjusting your current strategy to stay ahead of the curve.
The following video will help you create the Box and Whisker Chart in Microsoft Excel.


The following video will help you to create the Box and Whisker Chart in Google Sheets.
Let’s dig into some advanced techniques that can really make your statistical graphs and charts stand out. When you’re dealing with data visualization, the goal is to communicate information clearly and effectively, and these techniques can help you do just that.
Ever felt overwhelmed by too many details in a graph? That’s where dimensionality reduction steps in. This technique simplifies your graphs by reducing the number of variables you see without losing the essence of the data.
Techniques like Principal Component Analysis (PCA) and t-SNE are popular choices. They help in distilling complex data into simpler, two-dimensional plots while retaining the patterns and structures. It’s like finding the needle in the data haystack efficiently!
Colors and sizes aren’t just for show – they play a crucial role in how we perceive data. Choosing the right colors can mean the difference between a forgettable graph and one that sticks with your audience. Use colors to group related data points or to highlight outliers.
Similarly, varying sizes can emphasize important data points or trends. Remember, the goal is to make your data easy to read, not to turn it into a rainbow explosion!
When you look at statistics graphs, you’re basically peeking into the relationships between different variables. Think of it as a detective finding clues in the data. A graph can show whether two factors move together: maybe as one increases, the other does too, or perhaps one goes up while the other goes down.
Diving into the world of stat graphs, you meet something called correlation coefficients. These guys are like the thermometers for measuring the strength of the relationship between two variables.
A coefficient close to +1 or -1 means the variables are in a strong dance together, either moving in the same direction or opposite ones. If it’s around zero, the variables are like strangers – they don’t really relate.
Trend lines are your best pals in the graph world. They draw the path that data points follow, showing you the main direction of their movement over time. By looking at a trend line, you can quickly get the gist of what’s happening: are sales going up as advertising dollars increase?
Is the temperature rise impacting ice cream sales? A trend line sums this up visually, making it simple to grasp complex data relationships at a glance.
When diving into the world of statistical graphs, the choice of color can make or break the clarity and impact of your data representation. Let’s say you’re presenting profit margins across different departments. Using distinct, easily distinguishable colors helps viewers spot trends and outliers at a glance, without straining their eyes or getting confused.
Choosing the right color palette isn’t just about picking your favorite shades. It’s about communication. For instance, a monochromatic scheme can be perfect for showing different intensities of the same data point. Lighter shades could indicate lower values, while darker shades show higher values.
On the other hand, a contrasting color palette can highlight differences between categories or groups. Imagine you’re tracking customer satisfaction across multiple products. Assigning a unique color to each product can help your audience quickly see which ones are delighting customers and which aren’t.
Consistency is key in color usage across your statistical charts. Why? Because when colors flip-flop without a clear reason, it confuses the heck out of everyone. If blue represents the tech department in one graph, keep it the same across all others, including visuals like an exponential growth chart.
This consistency helps in building a visual language that your audience begins to understand intuitively, enhancing their ability to analyze the data.
Also, consider the background of your charts. A neutral background lets your colors shine. Bright backgrounds can clash or distort your color coding, making the data harder to read.
Graphs make data clear. They show relationships between different things. You can spot outliers and trends quickly. Graphs also help you compare groups of data. They’re great for presentations and reports.
They let you see the story behind the data. Without graphs, data is just a pile of numbers. Statistical graphs highlight relationships, comparisons, and changes over time, which makes understanding data easier and quicker. Whether you’re running a business or analyzing school performance, graphs simplify decision-making.
There are many types. Bar graphs compare categories. Line graphs show changes over time. Pie charts display parts of a whole. Scatter plots reveal relationships between variables. Histograms show data distribution.
Yes, they can. Watch out for manipulated scales or missing data. Always check the source and context. Look at the axes and labels carefully. Don’t let fancy designs distract you from the actual data.
Stick to simple, contrasting colors that are easy on the eyes. Avoid using too many colors – it can confuse your audience. Make sure your colors mean something. For instance, use one color for positive values and another for negative.
Practice! Try making graphs with different kinds of data. Look at graphs in newspapers and online. Ask yourself what they’re trying to show. The more you work with graphs, the better you’ll get at understanding and creating them.
Statistical graphs simplify complex data and make insights easy to understand. They transform numbers into visuals, showing trends, patterns, and comparisons. This makes decision-making faster and smarter. From bar charts to scatter plots, each graph type serves a specific purpose, helping you see the full picture.
The right graph can highlight what’s important and hide the noise. Whether you’re tracking business growth or monitoring school performance, graphs are the tools that keep your data clear. Remember, simplicity and accuracy are key. A cluttered or misleading graph does more harm than good.
As you work with graphs, focus on clarity. Label axes correctly, choose the right colors, and ensure your data is honest. These small actions make a big difference in how your audience interprets the information.
Graphs aren’t just for presenting data – they’re essential for understanding it. Use them well, and they’ll guide you to better insights.
In the end, graphs don’t just show data – they tell a story. What story will yours tell?
How much did you enjoy this article?


Calculate accounts receivable turnover ratio to measure credit collection speed, improve cash flow, and strengthen your financial strategy. Read on!

Change Management KPIs are the key to tracking adoption, performance, and ROI during transitions. Find out which metrics matter. Read on!

Data collection methods and techniques determine the quality of every insight you act on. Explore key approaches for gathering reliable data. Read on!


