• Home
  • Tools dropdown img
    • Spreadsheet Charts

      • ChartExpo for Google Sheets
      • ChartExpo for Microsoft Excel
    • Power BI Charts

      • Power BI Custom Visuals by ChartExpo
    • Word Cloud

  • Charts dropdown img
    • Chart Category

      • Bar Charts
      • Circle Graphs
      • Column Charts
      • Combo Charts
      • Comparison Charts
      • Line Graphs
      • PPC Charts
      • Sentiment Analysis Charts
      • Survey Charts
    • Chart Type

      • Box and Whisker Plot
      • Clustered Bar Chart
      • Clustered Column Chart
      • Comparison Bar Chart
      • Control Chart
      • CSAT Survey Bar Chart
      • CSAT Survey Chart
      • Dot Plot Chart
      • Double Bar Graph
      • Funnel Chart
      • Gauge Chart
      • Likert Scale Chart
      • Matrix Chart
      • Multi Axis Line Chart
      • Overlapping Bar Chart
      • Pareto Chart
      • Radar Chart
      • Radial Bar Chart
      • Sankey Diagram
      • Scatter Plot Chart
      • Slope Chart
      • Sunburst Chart
      • Tornado Chart
      • Waterfall Chart
      • Word Cloud
    • Google Sheets
      Microsoft Excel
  • Services
  • Pricing
  • Contact us
  • Blog
  • Support dropdown img
      • Gallery
      • Videos
      • Contact us
      • FAQs
      • Resources
    • Please feel free to contact us

      atsupport@chartexpo.com

Categories
All Data Visualizations Data Analytics Surveys
Add-ons/
  • Google Sheets
  • Microsoft Excel
  • Power BI
All Data Visualizations Data Analytics Surveys
Add-ons
  • Google Sheets
  • Microsoft Excel
  • Power BI

We use cookies

This website uses cookies to provide better user experience and user's session management.
By continuing visiting this website you consent the use of these cookies.

Ok

ChartExpo Survey


Home > Blog > Data Analytics

What is an ESG score and How is it Calculated?

What is ESG Score? You are an investor seeking to invest in a promising company.

What is ESG Score

Nevertheless, you want to guarantee that it will yield significant financial gains while practicing ethical and responsible behavior. This is where ESG scores come into play.

What does the ESG score stand for?

ESG is an acronym for Environmental, Social, and Governance ratings. Simply put, an ESG score indicates how well a company is performing in three areas:

Environmental: Carbon footprint, energy efficiency, waste;

Social: Employee relationships, diversity, influence on society;

Governance: Company management, CEO compensation, shareholders.

The ESG score is not a trendy concept. Rather, investments are vital in the modern world. According to Morgan Stanley research, 77% of investors want to explore the possibility of investing sustainably, responsibly, and impactfully. In addition, Harvard Business School shows that strong ESG performance is associated with market outperformance.

So, why should you be concerned about ESG scores? They offer an understanding of a company’s enduring viability and moral standards. Investors consider ESG scores while assessing investment possibilities in today’s socially conscious market. Do not forget that when investing, you are not just making money; you are making a difference.

This blog post will explore the impact of ESG scores on the investment industry. Get ready to see ethics and sustainability in a new light in finance.

Table of Contents:

  1. What is ESG Score?
  2. Why are ESG Ratings Important to Companies?
  3. How is ESG Score Calculated?
  4. What is a Good ESG Risk Score?
  5. How are ESG Scores Used in the Market?
  6. How to Evaluate ESG Scores for Companies?
  7. Wrap Up

First…

What is ESG Score?

Definition: An ESG score assesses a company’s performance in terms of Environmental, Social, and Governance practices. It evaluates a company’s ability to handle risks and take advantage of opportunities associated with these factors.

  • Environmental: This element evaluates a company’s influence on the environment. It incorporates carbon emissions, energy consumption, waste disposal, and resource preservation.
  • Social: This dimension assesses how a company handles interactions with its employees, suppliers, customers, and communities. It includes labor practices, human rights, diversity, and community impact.
  • Governance: This assesses a company’s top executives, board composition, executive compensation, financial checks, internal regulations, and shareholders’ privileges. Effective governance guarantees responsibility and openness.

Investors evaluate the sustainability and ethical impact of their investments using ESG scores. These scores assist in pinpointing companies that are expected to be sustainable and responsible over the long run. Strong management of environmental, social, and governance issues is reflected in high ESG scores.

Why are ESG Ratings Important to Companies?

ESG ratings offer numerous benefits, helping companies succeed in the increasingly sustainability-focused business environment.

  • Validation: ESG ratings validate a company’s sustainability and ethical practices efforts. High ratings demonstrate commitment to responsible business practices, enhancing reputation and stakeholder trust.
  • Peer comparison: These ratings allow companies to compare themselves with peers. Understanding their position relative to competitors helps identify strengths and areas for improvement, driving better performance.
  • Benchmarking: ESG ratings are benchmarks for companies to set and achieve sustainability goals. Regularly tracking these ratings ensures continuous improvement in ESG practices and strategies.
  • Managing progress: Companies use ESG ratings to monitor and manage progress over time. This continuous evaluation helps to maintain focus on long-term sustainability objectives and adapt to emerging challenges.
  • Investor attraction: High ESG ratings attract socially conscious investors. As more investors prioritize sustainability, companies with strong ESG performance gain access to a broader and more supportive investor base.
  • Risk management: ESG ratings aid in identifying and managing risks associated with environmental, social, and governance factors. Proactive management of these risks can prevent potential financial losses and operational disruptions.

How is ESG Score Calculated?

ESG (Environmental, Social, and Governance) score calculation systematically assesses a company’s performance across these three critical areas. The process aims to provide a comprehensive, standardized measure of how well a company manages its ESG responsibilities.

  1. Data collection: The first step is gathering relevant data. This includes collecting information from company reports, regulatory filings, third-party data providers, and direct company disclosures.
  2. Selection of Key Performance Indicators (KPIs): Next, specific KPIs are selected. These indicators are chosen based on their relevance to the industry and the company’s operations. KPIs might include carbon emissions, employee turnover rates, board diversity, and transparency in reporting.
  3. Weighting of criteria: Each KPI is assigned a weight based on its importance. The weighting reflects the significance of each criterion to the overall ESG performance. For example, environmental factors may carry more weight in industries with high environmental impacts.
  4. Scoring methodology: A scoring methodology is applied to the data. Each KPI is rated on a predefined scale, often from 0 to 100. This step involves evaluating the company’s performance against industry standards and best practices.
  5. Aggregation of scores: The individual scores for each KPI are aggregated. This involves summing the weighted scores to produce a total score for each ESG category. The aggregation ensures a balanced representation of all aspects of ESG performance.
  6. Normalization and benchmarking: The aggregated scores are then normalized to allow for comparison across companies and industries. This step adjusts the scores to a common scale, facilitating benchmarking against peers and industry averages.
  7. Final score and reporting: The final ESG score is calculated and reported. This comprehensive score provides a snapshot of the company’s overall ESG performance. It is typically presented in a format accessible to investors, stakeholders, and the public.

What is a Good ESG Risk Score?

A good ESG risk score indicates that a company has low exposure to environmental, social, and governance risks. Moreover, it effectively manages the risks it faces. The specific interpretation of what constitutes a “good” ESG risk score can vary depending on the rating agency or framework used. Here’s a general overview of how to interpret ESG risk scores from some of the major rating providers:

Sustainalytics

Sustainalytics provides ESG Risk Ratings on a scale that measures a company’s unmanaged ESG risks:

  • Negligible Risk: 0-10
  • Low Risk: 10-20
  • Medium Risk: 20-30
  • High Risk: 30-40
  • Severe Risk: 40+

Good ESG Score: Companies with scores between 0-10 (Negligible Risk) or 10-20 (Low Risk) are considered to have good ESG risk management.

MSCI ESG Ratings

MSCI rates companies on a AAA to CCC scale:

  • AAA and AA: Leaders in managing ESG risks and opportunities.
  • A, BBB, and BB: Average performance in managing ESG issues.
  • B and CCC: Laggards with poor ESG risk management.

Good ESG Score: Companies with AAA or AA ratings are considered to have excellent ESG risk management practices.

S&P Global ESG Scores

S&P Global rates companies on a numerical scale from 0 to 100 based on their Corporate Sustainability Assessment (CSA):

  • 80-100: Excellent performance.
  • 60-79: Good performance.
  • 40-59: Average performance.
  • 20-39: Below average performance.
  • 0-19: Poor performance.

Good ESG Score: Scores above 60 indicate good to excellent ESG performance.

General Interpretation:

Across these different frameworks, a good ESG risk score generally falls within the following ranges:

  • Sustainalytics: 0-20 (Negligible to Low Risk)
  • MSCI: AAA or AA ratings
  • S&P Global: 60-100

How are ESG Scores Used in the Market?

ESG scoring systems are developed for various purposes and parties (based on their specific needs). Some are tailored to aid in making decisions related to distributing funds (such as investments or evaluating credit risk). Others may assist in managing human resources and making staffing choices.

CDP, or The Carbon Disclosure Project, is an NGO evaluation system that rates corporate performance on environmental issues such as:

  • Carbon emissions
  • Climate change
  • Water
  • Forestry

Asset managers commonly use CDP in the investment community to pinpoint top or bottom performers in environmental issues. They do this through positive or negative screening.

Just Capital is a consumer-focused NGO system that evaluates a company’s performance on stakeholder matters. Consumers or potential employees can utilize Just Capital to find a company to purchase products from or work for.

In most instances, these approaches are consistently being modified. This underscores the significance of staying informed on changing ESG factors when interpreting. Or when deriving practical information from a specific score.

How to Evaluate ESG Scores for Companies?

Data analysis involves numbers, figures, and trends – all clamoring for attention.

But making sense of it all? That’s where the real challenge lies.

Now, imagine adding ESG scores into the mix of environmental, social, and governance factors swirling around in a sea of data. This is where data visualization swoops in as the hero of the story.

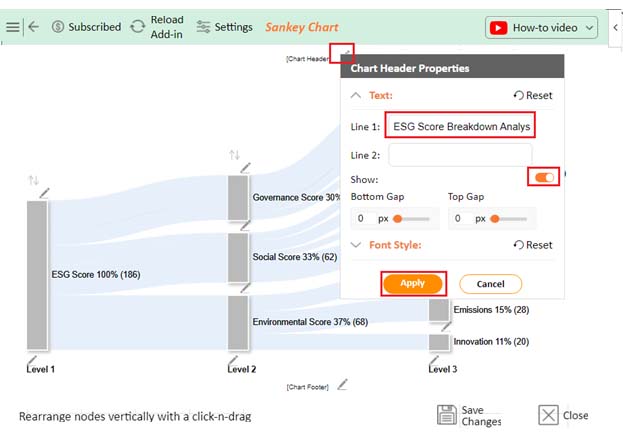
Excel is the trusty sidekick in data management and analysis. But alas, it falls short when bringing the ESG scores to life.

Fear not, for ChartExpo emerges as the knight in shining armor, ready to revolutionize data visualization. It rescues you from drowning in a sea of uninspiring charts and graphs.

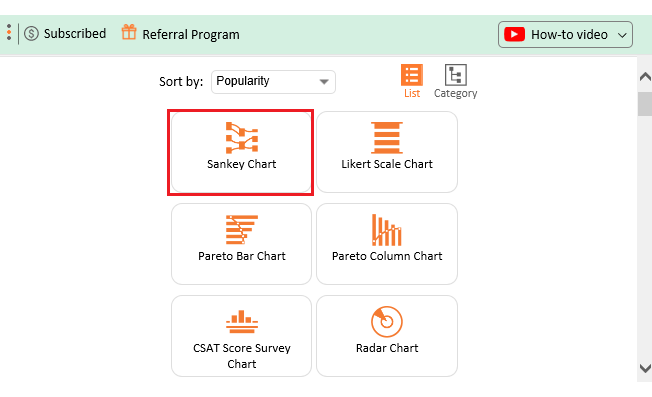
Let’s learn how to install ChartExpo in Excel.

  1. Open your Excel application.
  2. Open the worksheet and click the “Insert” menu.
  3. You’ll see the “My Apps” option.
  4. In the Office Add-ins window, click “Store” and search for ChartExpo on my Apps Store.
  5. Click the “Add” button to install ChartExpo in your Excel.

ChartExpo charts are available both in Google Sheets and Microsoft Excel. Please use the following CTAs to install the tool of your choice and create beautiful visualizations with a few clicks in your favorite tool.

Example

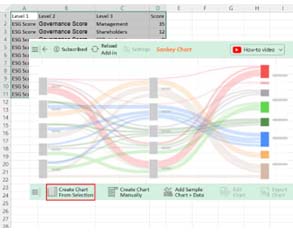
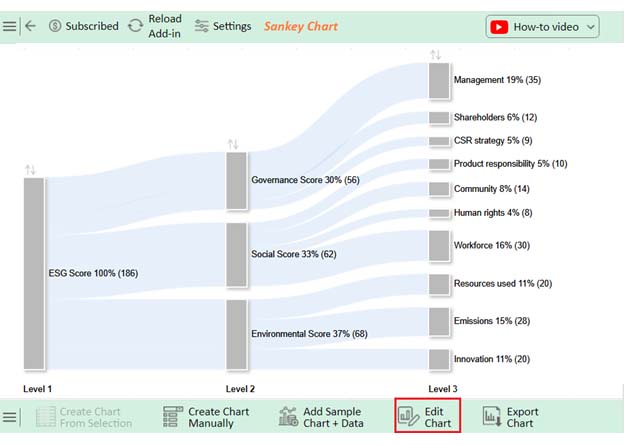
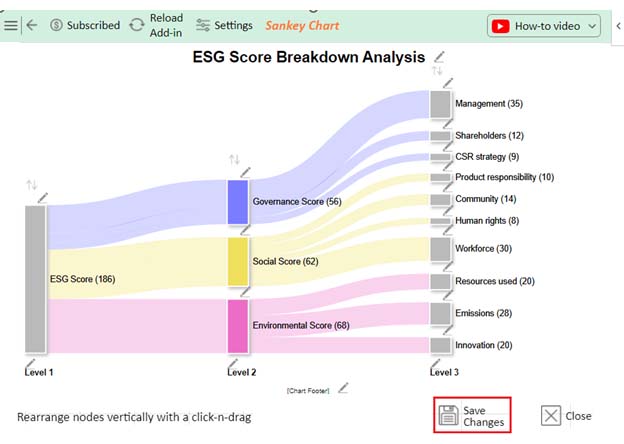
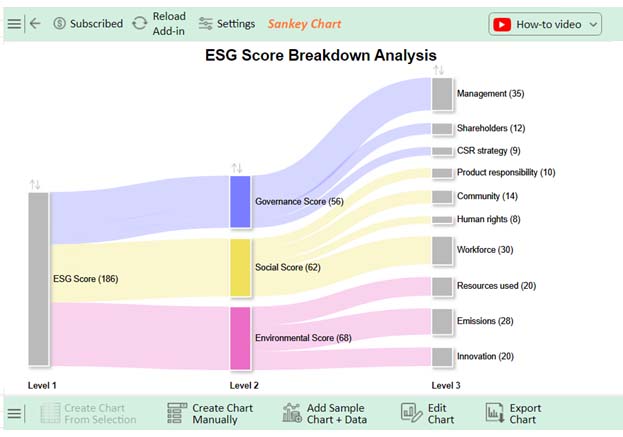
Let’s analyze the ESG scores for companies data below.

Level 1 Level 2 Level 3 Score
ESG Score Governance Score Management 35
ESG Score Governance Score Shareholders 12
ESG Score Governance Score CSR strategy 9
ESG Score Environmental Score Resources used 20
ESG Score Environmental Score Emissions 28
ESG Score Environmental Score Innovation 20
ESG Score Social Score Product responsibility 10
ESG Score Social Score Community 14
ESG Score Social Score Human rights 8
ESG Score Social Score Workforce 30
  • To get started with ChartExpo, install ChartExpo in Excel.
  • Now Click on My Apps from the INSERT menu.
insert chartexpo in excel
  • Choose ChartExpo from My Apps, then click Insert.
open chartexpo in excel
  • Once it loads, choose the “Sankey Chart” from the charts list.
search sankey chart in excel
  • Click the “Create Chart From Selection” button after selecting the data from the sheet, as shown.
Click Create Chart From Selection After Learning What is ESG Score
  • ChartExpo will generate the visualization below for you.
Edit Chart After Learning What is ESG Score
  • If you want to have the chart’s title, click Edit Chart, as shown in the above image.
  • Click the pencil icon next to the Chart Header to change the title.
  • It will open the properties dialog. Under the Text section, you can add a heading in Line 1 and enable Show.
  • Give the appropriate title of your chart and click the Apply button.
Add Chart Header After Learning What is ESG Score
  • You can disable the percentage sign values by clicking on the small pencil icon as follows:
Disable Percentage Sign After Learning What is ESG Score
  • Let’s give colors to the nodes. Click the pencil icon at the top of the nodes and go to “Node“. Select the color and click the “Apply” button to save all changes.
Change Node Color After Learning What is ESG Score
  • Click the “Save Changes” button to persist the changes.
Save Changes After Learning What is ESG Score
  • Your final Sankey Chart will appear below.
Final What is ESG Score

Insights

  • The highest scores in ESG governance are in “Management” (35), followed by “Shareholders” (12) and “CSR strategy” (9).
  • Due to environmental factors, ‘Emissions’ (28) and ‘Resources used’ (20) have significant scores.
  • Strong scores are emphasized in social aspects such as “Workforce” (30), “Community” (14), and “Product responsibility” (10).

FAQs

Is ESG good or bad?

ESG is generally good. It promotes sustainable and ethical business practices. Companies with strong ESG practices are better at managing risks and opportunities. This often leads to long-term benefits for the environment, society, and shareholders.

What is negative about ESG?

Negative aspects of ESG include the potential for greenwashing, high compliance costs, and inconsistent reporting standards. Some companies might superficially adopt ESG practices without genuine commitment. Additionally, varying standards can make comparisons difficult and reduce transparency.

How is the ESG rating calculated?

ESG ratings are calculated by assessing a company’s performance across environmental, social, and governance criteria. Data is collected, and key performance indicators (KPIs) are scored and weighted. Scores are aggregated, and results are normalized to provide a comprehensive rating.

Wrap Up

Comprehending ESG ratings is essential for assessing a company’s sustainability and ethical behaviors. ESG stands for Environmental, Social, and Governance. These scores evaluate the company’s ability to handle risks and seize opportunities in these areas.

Some environmental factors to consider are carbon emissions, energy consumption, and waste control. Organizations that receive high scores are exceptionally effective in reducing their environmental footprint. Social factors assess labor practices, community impact, and human rights. High-scoring companies demonstrate a strong commitment to social responsibility. Governance factors cover leadership, board diversity, and shareholder rights. Effective governance practices lead to high ESG scores.

A good ESG score indicates that a company effectively manages its ESG risks. Companies with high ESG scores are seen as more sustainable and responsible. Investors increasingly use ESG scores to make informed decisions. High ESG scores can attract investment and enhance a company’s reputation.

In conclusion, ESG scores comprehensively evaluate a company’s sustainability practices, covering environmental, social, and governance factors.

Therefore, understanding ESG scores is essential for navigating the modern business landscape.

How much did you enjoy this article?

ExcelAd1
Start Free Trial!
135879

Related articles

next previous
Data Analytics10 min read

Supplier Comparison Template: Download It Now

A supplier comparison template streamlines vendor evaluation by comparing cost and quality. Click here to learn its benefits and how to analyze them.

Data Analytics32 min read

Ecommerce Analytics: How to Fix What It Often Gets Wrong

Ecommerce analytics often lead to mixed signals and costly misreads. Fix attribution gaps, align teams, and act on the right data. Get started now!

Data Analytics30 min read

When Sales Funnel Breaks: Failures, Fixes, & Funnel Debt

Is your sales funnel hiding costly gaps? Learn how pipeline stalls, false metrics, and handoff chaos could be draining revenue. Get started now!

Data Analytics9 min read

Procurement Key Performance Indicators for Quick Insights

Procurement Key Performance Indicators track costs, efficiency, and supplier reliability. Learn to use these KPIs effectively, their importance, and examples.

Data Analytics29 min read

Correlation Analysis: Don’t Worship Correlation, Question It.

Correlation analysis helps spot patterns, avoid costly mistakes, and guide decisions with data that matters. Want smarter strategy? Get started now!

ChartExpo logo

Turn Data into Visual
Stories

CHARTEXPO

  • Home
  • Gallery
  • Videos
  • Services
  • Pricing
  • Contact us
  • FAQs
  • Privacy policy
  • Terms of Service
  • Sitemap

TOOLS

  • ChartExpo for Google Sheets
  • ChartExpo for Microsoft Excel
  • Power BI Custom Visuals by ChartExpo
  • Word Cloud

CATEGORIES

  • Bar Charts
  • Circle Graphs
  • Column Charts
  • Combo Charts
  • Comparison Charts
  • Line Graphs
  • PPC Charts
  • Sentiment Analysis Charts
  • Survey Charts

TOP CHARTS

  • Sankey Diagram
  • Likert Scale Chart
  • Comparison Bar Chart
  • Pareto Chart
  • Funnel Chart
  • Gauge Chart
  • Radar Chart
  • Radial Bar Chart
  • Sunburst Chart
  • see more
  • Scatter Plot Chart
  • CSAT Survey Bar Chart
  • CSAT Survey Chart
  • Dot Plot Chart
  • Double Bar Graph
  • Matrix Chart
  • Multi Axis Line Chart
  • Overlapping Bar Chart
  • Control Chart
  • Slope Chart
  • Clustered Bar Chart
  • Clustered Column Chart
  • Box and Whisker Plot
  • Tornado Chart
  • Waterfall Chart
  • Word Cloud
  • see less

RESOURCES

  • Blog
  • Resources
  • YouTube
SIGN UP FOR UPDATES

We wouldn't dream of spamming you or selling your info.

© 2025 ChartExpo, all rights reserved.