• Home
  • Tools dropdown img
    • Spreadsheet Charts

      • ChartExpo for Google Sheets
      • ChartExpo for Microsoft Excel
    • Power BI Charts

      • Power BI Custom Visuals by ChartExpo
    • Word Cloud

  • Charts dropdown img
    • Chart Category

      • Bar Charts
      • Circle Graphs
      • Column Charts
      • Combo Charts
      • Comparison Charts
      • Line Graphs
      • PPC Charts
      • Sentiment Analysis Charts
      • Survey Charts
    • Chart Type

      • Box and Whisker Plot
      • Clustered Bar Chart
      • Clustered Column Chart
      • Comparison Bar Chart
      • Control Chart
      • CSAT Survey Bar Chart
      • CSAT Survey Chart
      • Dot Plot Chart
      • Double Bar Graph
      • Funnel Chart
      • Gauge Chart
      • Likert Scale Chart
      • Matrix Chart
      • Multi Axis Line Chart
      • Overlapping Bar Chart
      • Pareto Chart
      • Radar Chart
      • Radial Bar Chart
      • Sankey Diagram
      • Scatter Plot Chart
      • Slope Chart
      • Sunburst Chart
      • Tornado Chart
      • Waterfall Chart
      • Word Cloud
    • Google Sheets
      Microsoft Excel
  • Services
  • Pricing
  • Contact us
  • Blog
  • Support dropdown img
      • Gallery
      • Videos
      • Contact us
      • FAQs
      • Resources
    • Please feel free to contact us

      atsupport@chartexpo.com

Categories
All Data Visualizations Data Analytics Surveys
Add-ons/
  • Google Sheets
  • Microsoft Excel
  • Power BI
All Data Visualizations Data Analytics Surveys
Add-ons
  • Google Sheets
  • Microsoft Excel
  • Power BI

We use cookies

This website uses cookies to provide better user experience and user's session management.
By continuing visiting this website you consent the use of these cookies.

Ok

ChartExpo Survey


Home > Blog > Data Analytics

Cash Burn Rate: What It Is, Types, & Formula

What is cash burn rate?

Is it about setting money on fire?

No. But it involves watching it disappear – the rate at which a company spends its cash reserves.

What is cash burn rate

Picture this: a startup with a brilliant idea, investors on board, and a rapidly dwindling bank balance. That’s the cash burn rate in action.

Now, you might be thinking, “Why does it matter?”

Understanding the cash burn rate is crucial for investors and company management. It’s like watching your fuel gauge during a road trip. You need to know how fast you’re using your resources to reach your destination.

But wait, there’s more to it.

The cash burn rate isn’t just about spending but survival. If your company’s cash burn rate outpaces its ability to generate cash, you could find yourself in hot water. It’s like trying to outrun a cheetah while wearing flip-flops – not a winning strategy.

This blog post delves into the nitty-gritty of what is cash burn rate. We’ll learn how to calculate it, why it matters, and what it reveals about a company’s financial health. By the end, you’ll be equipped to look beyond the smoke and mirrors of flashy business ventures. You’ll start seeing their cash burn rate’s cold, hard truth.

So, stick around because things are about to heat up!

Table of Contents:

  1. What is Cash Burn Rate?
  2. What are the Elements of a Good Cash Burn Rate?
  3. How Many Types of Cash Burn Rates?
  4. How to Calculate Cash Burn Rate?
  5. How to Perform Cash Burn Rate Analysis?
  6. Wrap Up

First”¦

What is Cash Burn Rate?

Definition: The cash burn rate quantifies the rate at which a company is depleting its cash reserves. Calculated by subtracting the total cash outflows from the total cash inflows, it reflects the net cash usage. A higher burn rate suggests accelerated cash depletion, emphasizing the need for sustainable financial practices. It’s a crucial indicator for investors and stakeholders to assess a company’s financial health and operational efficiency.

This metric is particularly crucial for startups and companies in growth phases. Why? It offers insights into their runway, and the duration they can sustain operations before requiring additional funding.

Moreover, what is the cash burn rate? And monitoring the cash burn rate aids in strategic decision-making. It helps to adjust company spending, secure additional funding, or refine business models to achieve financial sustainability.

What are the Elements of a Good Cash Burn Rate?

Let’s dissect the elements distinguishing a good cash burn rate, where financial prudence meets strategic vision.

  • Reasonable spending: Effective cash management begins with prudent spending. A good cash burn rate involves allocating funds judiciously, focusing on essentials, and avoiding frivolous expenditures. It’s about achieving operational efficiency without compromising growth.
  • Effective cash management: Beyond spending, effective cash management is paramount. It involves optimizing working capital and managing receivables and payables efficiently. Ultimately ensuring that cash is deployed strategically to support business objectives.
  • Revenue growth: A healthy cash burn rate aligns with revenue growth. It’s not just about cutting costs but investing in strategies that drive top-line expansion. Balancing expenditure with a clear path to revenue generation is crucial for sustained financial health.
  • Investor confidence: Investor confidence is both a gauge and an outcome of a good cash burn rate. Demonstrating a disciplined approach to cash usage instills trust. It signals to investors that your company is not just spending but doing so strategically to achieve long-term value.
  • Scalability: Scalability is a key consideration in what is cash burn rate evaluation. A good rate allows for flexibility in scaling operations as needed. It accommodates growth without disproportionately escalating costs, ensuring the financial model aligns with expansion plans.
  • Transparency and communication: Open communication about the cash burn rate, its components, and the rationale behind financial decisions fosters transparency. It builds trust with stakeholders, internal teams, and investors, creating a shared understanding of the company’s financial health.
  • Flexibility and adaptability: The financial landscape evolves, and a good cash burn rate is adaptable. It allows you to pivot when necessary, adjusting spending priorities in response to market shifts or unforeseen challenges. This, as a result, showcases financial resilience.

How Many Types of Cash Burn Rates?

The cash burn rate is not a monolithic concept. Various types of cash burn rate examples offer nuanced perspectives on a company’s financial story. Let’s see how the intricacies of each type illuminate different facets of financial prudence.

  1. Gross cash burn rate: Gross cash burn rate lays bare the unfiltered reality of a company’s cash consumption. It accounts for all outflows without the cushion of offsetting revenue or income. This metric offers a raw, genuine view, revealing the sheer magnitude of expenditures. For a detailed analysis, utilizing an income statement template in Excel can provide further insight into how these expenses compare against income.
  2. Net cash burn rate: In contrast, the net cash burn rate introduces a layer of sophistication. It considers revenue, subtracting income from total cash outflows. This nuanced metric provides a clearer picture, indicating how operational expenses align with the revenue generated. Consequently, it offers insights into a more sustainable financial position.
  3. Operating cash burn rate: The operating cash burn rate hones in on the essentials, isolating cash flows tied to day-to-day operations. It evaluates the efficiency of the business in generating cash from its core activities. This offers a focused perspective on the financial health stemming from operational endeavors.
  4. EBITDA cash burn rate: The EBITDA cash burn rate takes a more granular approach, considering earnings before interest, taxes, depreciation, and amortization. This metric highlights the company’s ability to generate cash from core operations. It excludes non-cash expenses to provide a distinct angle for financial evaluation.
  5. Runway: The runway metric projects the future. It anticipates the duration a company can sustain operations based on the current cash burn rate and available reserves. This forward-looking perspective becomes instrumental in strategic planning. How? You can know how long your company can navigate its operational path before seeking additional funding.

How to Calculate Cash Burn Rate?

To calculate the cash burn rate, adhere to these procedures:

  1. Identify the starting cash balance (Cash at the beginning of the period).
  2. Identify the ending cash balance (Cash at the end of the period).
  3. Calculate the net change in cash by deducting the ending cash balance from the starting cash balance.
  4. Determine the average monthly cash burn rate. Divide the net change in cash by the number of months in the period.

What is the cash burn rate formula?

Cash Burn Rate =(Starting Cash Balance – Ending Cash Balance)/(Number of Months)

How to Perform Cash Burn Rate Analysis?

Analyzing cash burn rate data can feel like searching for a needle in a haystack. The tangled web of numbers, trends, and outliers can leave you feeling like you need a hieroglyphic degree.

But don’t worry; data visualization is the beacon of hope in this numerical wilderness.

Sadly, Excel, our loyal companion, falters when it comes to creating captivating visuals.

This is where ChartExpo, the sleek, sophisticated solution, comes in to breathe life into Excel’s visualization capabilities. So, how can you perform cash burn rate analysis in Excel and witness the transformation with ChartExpo? Let’s embark on this data adventure and uncover the secrets.

First”¦

Let’s learn how to Install ChartExpo in Excel.

  1. Open your Excel application.
  2. Open the worksheet and click the “Insert” menu.
  3. You’ll see the “My Apps” option.
  4. In the Office Add-ins window, click “Store” and search for ChartExpo on my Apps Store.
  5. Click the “Add” button to install ChartExpo in your Excel.

ChartExpo charts are available both in Google Sheets and Microsoft Excel. Please use the following CTA’s to install the tool of your choice and create beautiful visualizations in a few clicks in your favorite tool.

Cash Burn Rate Analysis Example

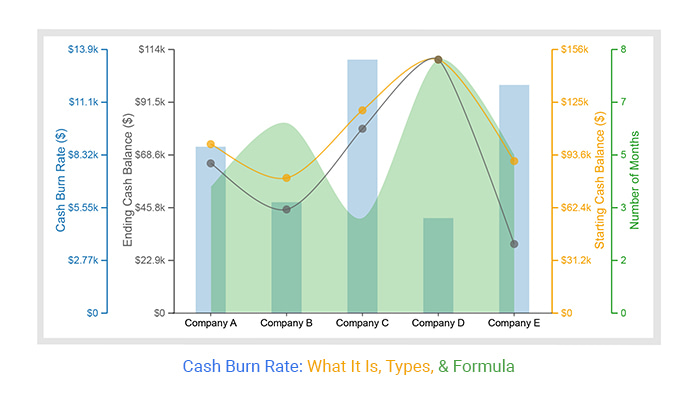
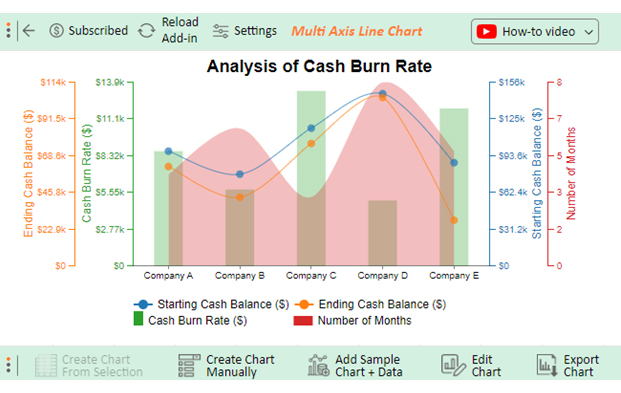
Let’s say you want to analyze the company’s financial data below.

Company Cash Burn Rate ($) Starting Cash Balance ($) Ending Cash Balance ($) Number of Months
Company A 8750 100000 65000 4
Company B 5833 80000 45000 6
Company C 13333 120000 80000 3
Company D 5000 150000 110000 8
Company E 12000 90000 30000 5

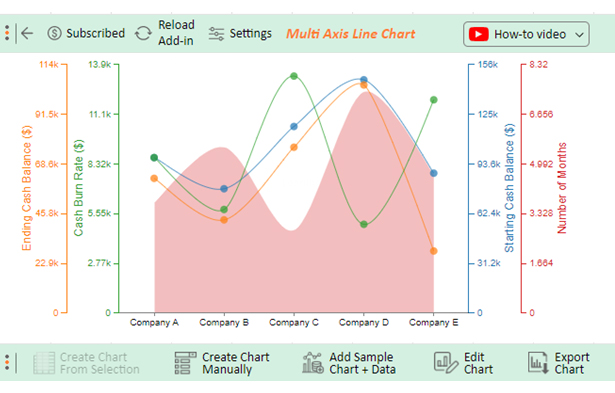
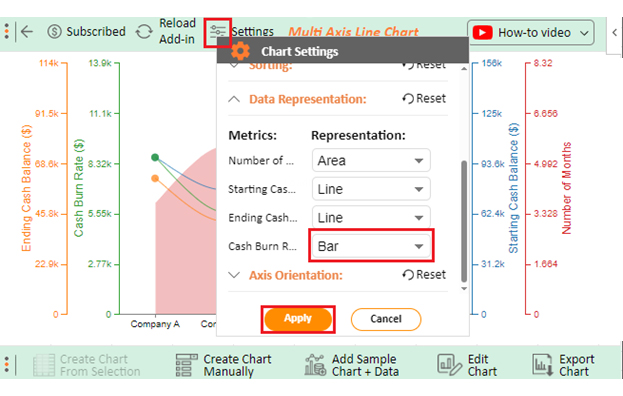
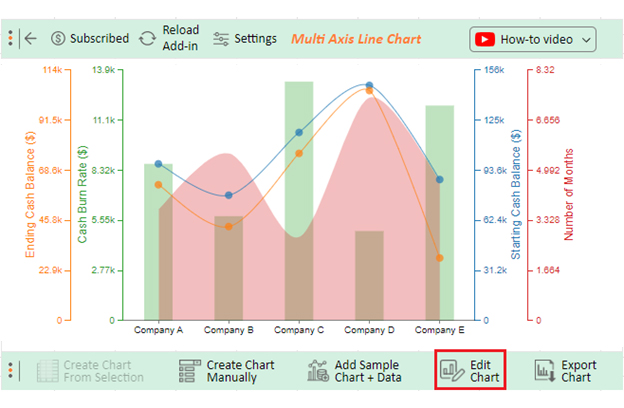
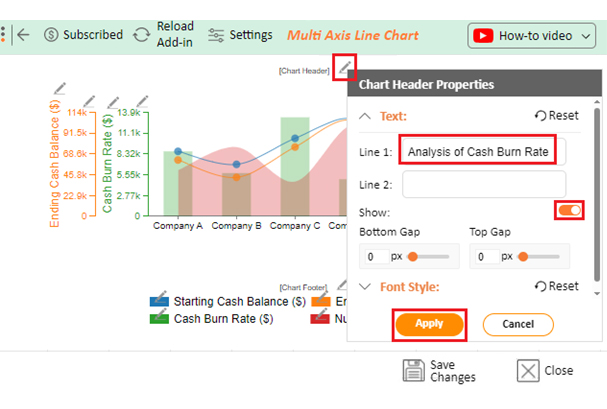
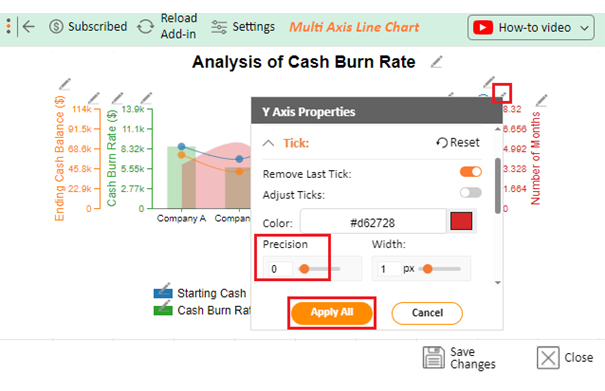
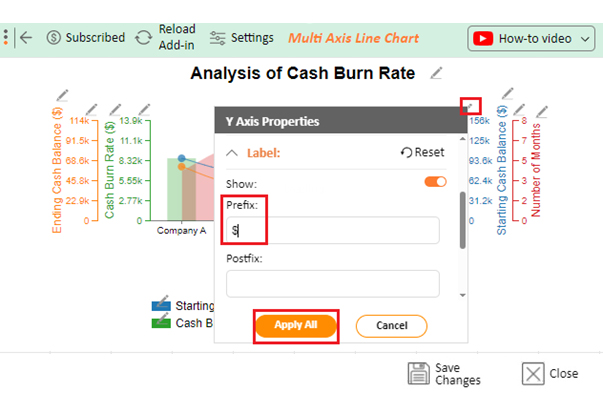
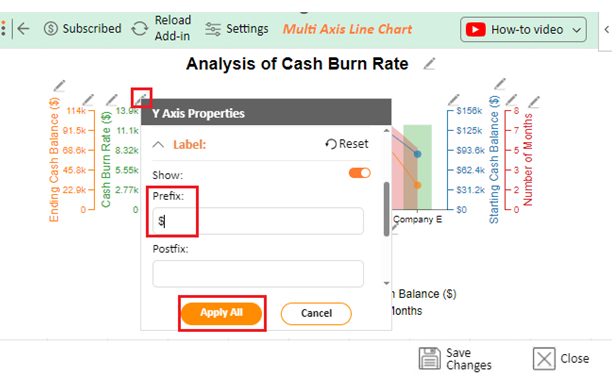
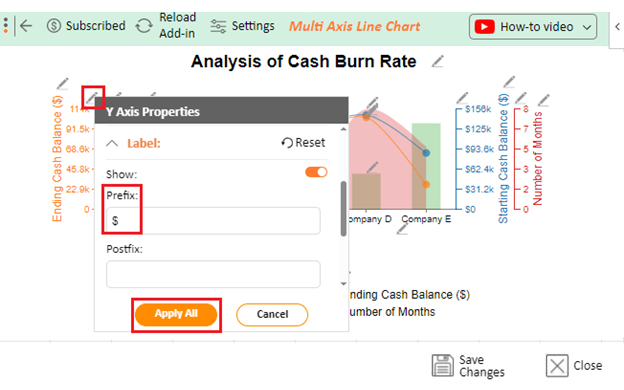
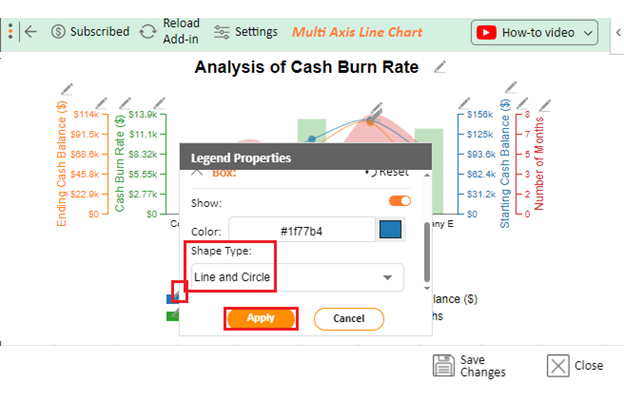
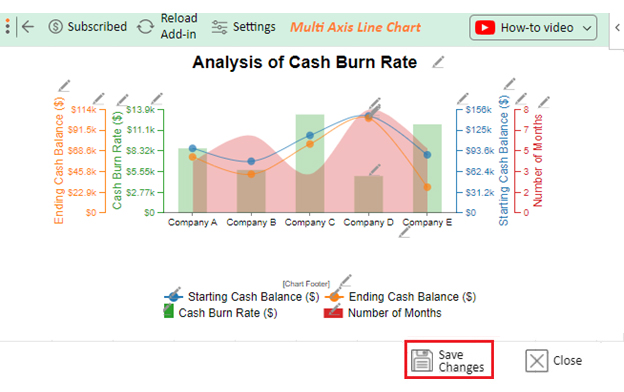
Follow the steps below to visualize this data in Excel using ChartExpo and glean valuable insights.

  • To get started with ChartExpo, install ChartExpo in Excel.
  • Now Click on My Apps from the INSERT menu.
insert chartexpo in excel
  • Choose ChartExpo from My Apps, then click Insert.
open chartexpo in excel
  • Once it loads, scroll through the charts list to locate and choose the “Multi-Axis Line Chart”.
search multi axis line chart in excel
  • Click the “Create Chart From Selection” button after selecting the data from the sheet, as shown.
Create Chart From Selection ce528
  • ChartExpo will generate the visualization below for you.
What is cash burn rate template design
  • Click on Settings and change the “Data Representation” as follows.
Data Representation ce528
  • If you want to add anything to the chart, click the Edit Chart button:
Edit Chart ce528
  • Click the pencil icon next to the Chart Header to change the title.
  • It will open the properties dialog. Under the Text section, you can add a heading in Line 1 and enable Show.
  • Give the appropriate title of your chart and click the Apply button.
Apply Tittle on Chart ce528
  • Change the precision value of the Number of Months to zero:
Change the precision value ce528
  • Add a dollar sign with the Starting Cash Balance as shown below:
Add dollar sign with Starting Cash Balance ce528
  • Add a dollar sign with the Cash Burn Rate as shown below:
Add dollar sign with Cash Burn Rate ce528
  • Add the dollar sign with the Ending cash balance as shown below:
Add dollar sign with Ending cash balance ce528
  • Change the Legend shape of “Starting Cash Balance” into a Line and Circle and click the “Apply” button.
Change Legend shape of Starting Cash Balance ce528
  • Click the “Save Changes” button to persist the changes made to the chart.
Save Changes ce528
  • Your final Multi Axis Line Chart will look like the one below.
Final What is cash burn rate

Insights

  • Company A ends with $65,000 after a $8,750 cash burn rate across 4 months.
  • Company B concludes with $45,000, burning $5,833 monthly for 6 months.
  • Company C has a $13,333 burn rate over 3 months, retaining $80,000.
  • Company D, ending with $110,000, burns $5,000 monthly for 8 months.
  • Company E ends with $30,000 with a $12,000 burn rate over 5 months.

FAQs

What is the meaning of cash burning?

Cash burning refers to a company spending more cash than it generates. It signifies a negative cash flow, indicating financial outflows surpassing inflows. If not managed effectively, this can lead to reduced cash reserves and potential financial challenges.

What is the reason for cash burn?

Cash burn often results from high operational costs, substantial investments, or insufficient revenue. Companies may experience cash burn during growth phases, R&D, or market expansion. If not balanced, it can lead to financial stress, necessitating effective financial management and strategic planning.

Is cash burn the same as loss?

Cash burn and loss are related but distinct concepts. Loss refers to the overall negative financial result on the income statement. Conversely, cash burn addresses the rate at which a company expends its available cash, reflecting liquidity and sustainability.

Wrap Up

The cash burn rate is akin to a financial pulse, revealing the heartbeat of a company’s economic vitality. It sheds light on the speed at which your business utilizes its available cash reservoirs. Therefore, examining this rate provides a window into the delicate equilibrium between expenditures and financial sustainability.

A high cash burn rate may signify ambitious growth or strategic investments, yet it demands vigilant financial stewardship. Conversely, a low cash burn rate may indicate caution but carries the risk of stifling progress.

What Is Cash Burn Rate? This metric is dynamic and shaped by variables such as operational efficiency, revenue generation, and strategic decision-making. Mastering the understanding of the cash burn rate extends beyond a numerical exercise. It emerges as a strategic imperative for businesses navigating the intricate terrain of financial health. It functions as a compass, guiding executives, investors, and stakeholders through the unpredictable waters of fiscal decision-making.

Undoubtedly, interpreting and managing the cash burn rate effectively becomes a linchpin for long-term success. It transcends numbers, evolving into a narrative that tells the story of a company’s financial journey.

With ChartExpo, this comprehension transcends complexity, becoming an accessible visual journey. ChartExpo transforms numerical intricacies into intuitive charts, allowing stakeholders to grasp financial dynamics effortlessly.

Do not hesitate.

Embrace the cash burn rate insights with ChartExpo today. With ChartExpo, the journey from numerical data to actionable insights becomes efficient and enlightening.

How much did you enjoy this article?

PBIAd1
Start Free Trial!
133833

Related articles

next previous
Data Analytics12 min read

Business Intelligence in Healthcare Industry: A Visual Approach

Business Intelligence in the healthcare industry improves patient care and streamlines operations. Learn how BI works and benefits healthcare providers.

Data Analytics10 min read

Analytics in Telecom Industry for Better Insights

Analytics in the telecom industry optimizes networks, enhances customer experience, and detect fraud. Learn its key benefits, challenges, and use cases.

Data Analytics7 min read

Financial Forecasting for Startups: A Complete Guide

This guide dives deep into financial forecasting for startups. You'll also discover elements of a financial projection for a startup, and tips for creating one.

Data Analytics32 min read

Data Reporting: Making Your Reports Irresistible

Data reporting turns numbers into insights that guide decisions. Learn how to simplify complex data and make confident choices. Read on for key strategies!

Data Analytics10 min read

Employee Performance KPIs: Insights That Drive Action

Employee performance KPIs track productivity and success. Learn the key metrics, measurement methods, and analysis techniques to boost performance.

ChartExpo logo

Turn Data into Visual
Stories

CHARTEXPO

  • Home
  • Gallery
  • Videos
  • Services
  • Pricing
  • Contact us
  • FAQs
  • Privacy policy
  • Terms of Service
  • Sitemap

TOOLS

  • ChartExpo for Google Sheets
  • ChartExpo for Microsoft Excel
  • Power BI Custom Visuals by ChartExpo
  • Word Cloud

CATEGORIES

  • Bar Charts
  • Circle Graphs
  • Column Charts
  • Combo Charts
  • Comparison Charts
  • Line Graphs
  • PPC Charts
  • Sentiment Analysis Charts
  • Survey Charts

TOP CHARTS

  • Sankey Diagram
  • Likert Scale Chart
  • Comparison Bar Chart
  • Pareto Chart
  • Funnel Chart
  • Gauge Chart
  • Radar Chart
  • Radial Bar Chart
  • Sunburst Chart
  • see more
  • Scatter Plot Chart
  • CSAT Survey Bar Chart
  • CSAT Survey Chart
  • Dot Plot Chart
  • Double Bar Graph
  • Matrix Chart
  • Multi Axis Line Chart
  • Overlapping Bar Chart
  • Control Chart
  • Slope Chart
  • Clustered Bar Chart
  • Clustered Column Chart
  • Box and Whisker Plot
  • Tornado Chart
  • Waterfall Chart
  • Word Cloud
  • see less

RESOURCES

  • Blog
  • Resources
  • YouTube
SIGN UP FOR UPDATES

We wouldn't dream of spamming you or selling your info.

© 2025 ChartExpo, all rights reserved.