• Home
  • Tools dropdown img
    • Spreadsheet Charts

      • ChartExpo for Google Sheets
      • ChartExpo for Microsoft Excel
    • Power BI Charts

      • Power BI Custom Visuals by ChartExpo
    • Word Cloud

  • Charts dropdown img
    • Chart Category

      • Bar Charts
      • Circle Graphs
      • Column Charts
      • Combo Charts
      • Comparison Charts
      • Line Graphs
      • PPC Charts
      • Sentiment Analysis Charts
      • Survey Charts
    • Chart Type

      • Box and Whisker Plot
      • Clustered Bar Chart
      • Clustered Column Chart
      • Comparison Bar Chart
      • Control Chart
      • CSAT Survey Bar Chart
      • CSAT Survey Chart
      • Dot Plot Chart
      • Double Bar Graph
      • Funnel Chart
      • Gauge Chart
      • Likert Scale Chart
      • Matrix Chart
      • Multi Axis Line Chart
      • Overlapping Bar Chart
      • Pareto Chart
      • Radar Chart
      • Radial Bar Chart
      • Sankey Diagram
      • Scatter Plot Chart
      • Slope Chart
      • Sunburst Chart
      • Tornado Chart
      • Waterfall Chart
      • Word Cloud
    • Google Sheets
      Microsoft Excel
  • Services
  • Pricing
  • Contact us
  • Blog
  • Support dropdown img
      • Gallery
      • Videos
      • Contact us
      • FAQs
      • Resources
    • Please feel free to contact us

      atsupport@chartexpo.com

Categories
All Data Visualizations Data Analytics Surveys
Add-ons/
  • Google Sheets
  • Microsoft Excel
  • Power BI
All Data Visualizations Data Analytics Surveys
Add-ons
  • Google Sheets
  • Microsoft Excel
  • Power BI

We use cookies

This website uses cookies to provide better user experience and user's session management.
By continuing visiting this website you consent the use of these cookies.

Ok

ChartExpo Survey


Home > Blog > Data Analytics

Total Recordable Incident Rate (TRIR): How to Calculate It?

Do you want to determine a company or industry’s safety performance? This data is vital, and the total recordable incident rate (TRIR) speaks a lot about it.

Total Recordable Incident Rate

Let’s say you’re in a busy construction yard filled with workers getting the job done. One thing happens out of the blue, resulting in injury or sickness. This event is among other incidents that add to the total recordable incident rate.

TRIR is a standard safety metric that illustrates the frequency of recordable incidents (incidents per one million hours worked). These include workplace injuries, sickness, and fatalities requiring medical attention, time off, or limited work.

The key message is the in-depth interpretation of TRIR metrics. They tell how well the company’s safety and risk management practices are implemented. For instance 2019, the private sector reported 2.8 million nonfatal workplace injuries and illnesses (Bureau of Labor Statistics). That equates to approximately 2.8 reportable incidents per 100 full-time employees.

TRIR is an essential tool in occupational safety for comparing and assessing safety performance. It enables companies to measure their safety performance against industry norms and pinpoint areas that need enhancement. Furthermore, a low TRIR suggests a more secure work environment and leads to increased productivity and employee satisfaction.

Exploring the TRIR concept can help us discover effective workplace accident reduction methods. Let’s delve into its importance, influence, and the proactive steps it can take to motivate and establish safer and secure work settings.

Table of Contents:

  1. What is the Total Recordable Incident Rate (TRIR)?
  2. Why is the OSHA Incident Rate So Important?
  3. How to Calculate Total Recordable Incident Rate (TRIR)?
  4. How to Examine the Total Recordable Incident Rate (TRIR)?
  5. Wrap Up

First…

What is the Total Recordable Incident Rate (TRIR)?

Definition: The Total Recordable Incident Rate (TRIR) assesses workplace safety. It is a yearly count of work-related injuries/illnesses per 100 full-time employees. It is a standard measure utilized in various sectors.

The total recordable incident rate is derived from Occupational Safety and Health Administration (OSHA) standards. Formed in 1970 by the Occupational Safety and Health Act, OSHA works to guarantee safe and healthy working environments. How? Through standard setting, enforcement, training, outreach, education, and assistance.

The measure of recordable accidents, or TRIR, rose in prominence during the 1970s and 1980s. It was designed to uniformly measure and document workplace safety incidents. All employers must record work-related injuries and illnesses (OSHA Form 300). This data collection facilitates the calculation of TRIR, providing a standardized measure of workplace safety.

Over time, TRIR became widely adopted across various industries. It became a crucial benchmark for assessing safety performance. Regulatory bodies, insurance companies, and clients began using TRIR to evaluate and compare safety records. Today, it remains a fundamental tool for monitoring and improving workplace safety.

Why is the OSHA Incident Rate So Important?

The OSHA incident rate is a vital metric in workplace safety management. It quantifies the number of work-related injuries and illnesses, offering a clear picture of a company’s safety performance. Understanding its importance helps organizations prioritize and enhance safety measures. Here’s why the OSHA incident rate is crucial:

  • Indicator of safety performance: The OSHA incident rate is a key indicator of safety performance. It helps organizations gauge the effectiveness of their safety programs and practices.
  • Benchmarking and comparison: It allows companies to benchmark their safety records against industry standards and competitors. This comparison can highlight areas needing improvement.
  • Compliance monitoring: Maintaining low incident numbers to comply with OSHA is important. If you do not, your action may have legal ramifications and penalties.
  • Cost implications: High incident rates often correlate with increased costs due to medical expenses, compensation claims, and lost productivity. Reducing incidents can lead to significant cost savings.
  • Employee health and well-being: A low incident rate indicates a safer work environment, which protects employee health and well-being. This can boost morale and productivity.
  • Risk assessment and hazard identification: Incident rate monitoring helps identify potential risks and hazards, which, when identified early, can help prevent them from occurring.
  • Continuous improvement: Regularly reviewing incident rates fosters a culture of continuous improvement. It encourages proactive measures to enhance safety protocols and reduce incidents.
  • Public perception and reputation: A strong safety record can improve a company’s image in its customers’ minds. It shows that the company is taking into account the safety of its employees, which may also improve stakeholder perception.

How to Calculate Total Recordable Incident Rate (TRIR)?

Calculating the total recordable incident rate (TRIR) is essential for assessing workplace safety. Here’s a step-by-step guide on how to calculate TRIR:

  1. Determine the number of recordable incidents: Identify all recordable workplace injuries and illnesses for the year. These incidents typically include cases that require medical treatment beyond first aid, loss of consciousness, restricted work, or job transfer.
  2. Calculate the total hours worked: Sum up the total hours worked by all employees over the year. This includes full-time, part-time, and temporary workers.
  3. Use the TRIR formula: Here is the total recordable incident rate formula:
Total Recordable Incident Rate Formula
    • The factor 200,000 represents the base for 100 full-time employees working 40 hours per week for 50 weeks per year.
  1. Compare your TRIR with industry averages. OSHA and various industry organizations publish average TRIRs for different sectors. A TRIR significantly higher than the industry average indicates your workplace is less safe than similar organizations.

How to Examine the Total Recordable Incident Rate (TRIR)?

Data analysis is a thrilling rollercoaster ride through a jungle of numbers. Finding insights is like hunting for treasure in a maze of mirrors. Analyzing the total recordable incident rate (TRIR) feels like decoding a cryptic puzzle with high stakes.

But don’t worry; data visualization steps in as the magician turns raw data into a captivating story. However, Excel, the loyal squire, falters in this grand spectacle, akin to bringing a knife to a lightsaber fight.

We have a solution ChartExpo. ChartExpo banishes Excel’s limitations and conjures enchanting data visualization solutions.

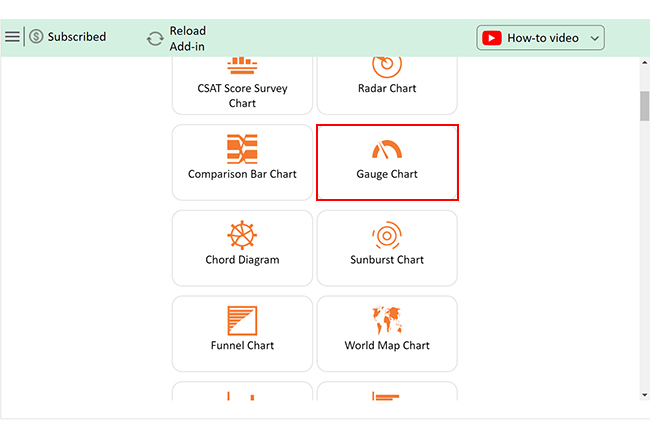
Let’s learn how to install ChartExpo in Excel.

  1. Open your Excel application.
  2. Open the worksheet and click the “Insert” menu.
  3. You’ll see the “My Apps” option.
  4. In the Office Add-ins window, click “Store” and search for ChartExpo on my Apps Store.
  5. Click the “Add” button to install ChartExpo in your Excel.

ChartExpo charts are available both in Google Sheets and Microsoft Excel. Please use the following CTAs to install the tool of your choice and create beautiful visualizations with a few clicks in your favorite tool.

Example

Let’s analyze the data below in Excel using ChartExpo.

Title Actual Benchmark
TRIR 3.2 6
  • To get started with ChartExpo, install ChartExpo in Excel.
  • Now Click on My Apps from the INSERT menu.
insert chartexpo in excel
  • Choose ChartExpo from My Apps, then click Insert.
open chartexpo in excel
  • Once it loads, scroll through the charts list to locate and choose the “Gauge Chart”.
search gauge chart in excel
  • Click the “Create Chart From Selection” button after selecting the data from the sheet, as shown.
Click Create Chart From Selection for Doing Total Recordable Incident Rate
  • ChartExpo will generate the visualization below for you.
Edit Chart for Doing Total Recordable Incident Rate
  • If you want to add anything to the chart, click the Edit Chart button:
  • Click the pencil icon next to the Chart Header to change the title.
  • It will open the properties dialog. Under the Text section, you can add a heading in Line 1 and enable Show.
  • Give the appropriate title of your chart and click the Apply button.
Add Chart Header for Doing Total Recordable Incident Rate
  • Click the “Save Changes” button to persist the changes made to the chart.
Save Changes for Doing Total Recordable Incident Rate
  • Your final Gauge Chart will look like the one below.
Final Total Recordable Incident Rate

Insights

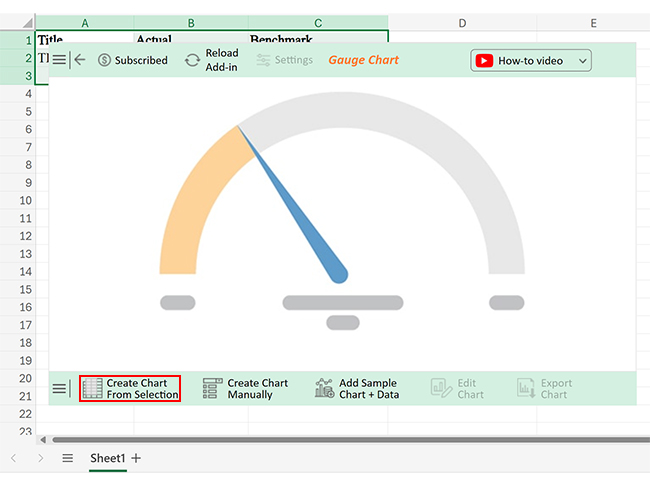
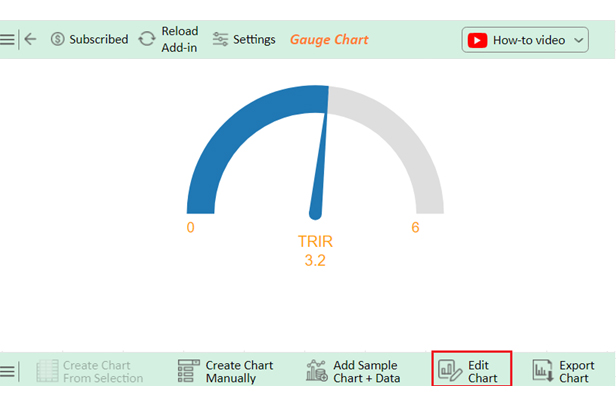
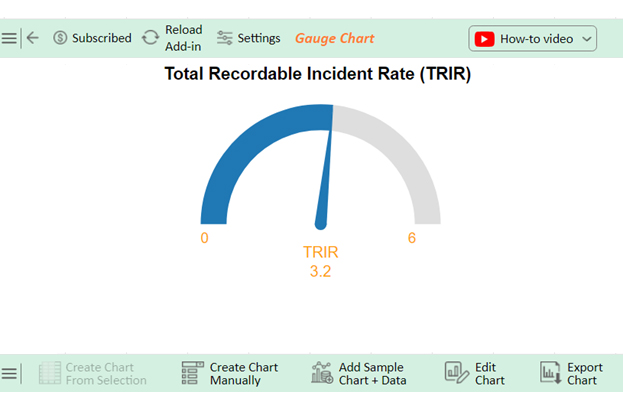
The TRIR stands at 3.2, which is well below the benchmark of 6. This shows there is room for improvement in safety performance.

FAQs

What is a good TRIR rate?

A good TRIR rate is typically below the industry average. For many industries, a TRIR of 3.0 or lower is considered good. However, the ideal rate varies by industry standards and specific company goals.

What is an example of a TRIR?

An example of a TRIR is 2.5. This means there are 2.5 recordable incidents per 100 full-time employees annually. It indicates the company’s safety performance compared to industry standards. Lower TRIR values signify a safer workplace.

What is considered a bad TRIR?

A bad TRIR is typically above the industry average. For many industries, a TRIR above 4.0 is considered high. It indicates more frequent workplace incidents. Higher TRIR values suggest poor safety practices and the need for immediate improvements.

Wrap Up

The Total Recordable Incident Rate (TRIR) is a crucial metric for workplace safety. It measures the number of recordable injuries and illnesses per 100 full-time employees annually. Understanding and managing TRIR is essential for maintaining a safe work environment.

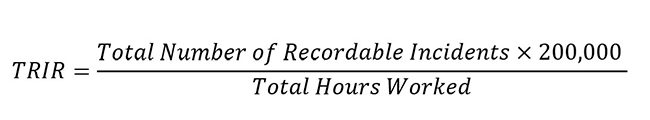
TRIR is calculated using a straightforward formula. First, count the total recordable incidents in a year. Then, multiply this number by 200,000, representing the hours worked by 100 full-time employees annually. Finally, divide by the total hours worked by all employees. This provides a consistent measure of safety performance.

Interpreting TRIR involves comparing it to industry averages. A TRIR below the industry average indicates good safety performance. Conversely, a TRIR above the average suggests the need for safety improvements. Regularly monitoring TRIR helps identify trends and areas for improvement.

A good TRIR rate is generally below 3.0, while a rate above 4.0 is considered high. Lower TRIR values indicate fewer workplace incidents and better safety practices. Organizations should strive for a low TRIR to ensure the well-being of their employees and maintain compliance with safety regulations.

Start using ChartExpo today for TRIR analysis to establish a safer and more efficient work environment.

How much did you enjoy this article?

PBIAd1
Start Free Trial!
136014

Related articles

next previous
Data Analytics31 min read

Data Analysis Without Nonsense: Fix the Right Problem, Fast

Data analysis can mislead when metrics look right but outcomes fail. Learn how to spot red flags, fix failures, and make better decisions. Read on!

Data Analytics29 min read

Variance Analysis Isn’t a Math Problem, It’s a Trust Problem

Variance analysis helps identify what went wrong, who owns it, and what to do next. Use it to drive decisions, not just reports. Learn more!

Data Analytics10 min read

Supplier Comparison Template: Download It Now

A supplier comparison template streamlines vendor evaluation by comparing cost and quality. Click here to learn its benefits and how to analyze them.

Data Analytics32 min read

Ecommerce Analytics: How to Fix What It Often Gets Wrong

Ecommerce analytics often lead to mixed signals and costly misreads. Fix attribution gaps, align teams, and act on the right data. Get started now!

Data Analytics30 min read

When Sales Funnel Breaks: Failures, Fixes, & Funnel Debt

Is your sales funnel hiding costly gaps? Learn how pipeline stalls, false metrics, and handoff chaos could be draining revenue. Get started now!

ChartExpo logo

Turn Data into Visual
Stories

CHARTEXPO

  • Home
  • Gallery
  • Videos
  • Services
  • Pricing
  • Contact us
  • FAQs
  • Privacy policy
  • Terms of Service
  • Sitemap

TOOLS

  • ChartExpo for Google Sheets
  • ChartExpo for Microsoft Excel
  • Power BI Custom Visuals by ChartExpo
  • Word Cloud

CATEGORIES

  • Bar Charts
  • Circle Graphs
  • Column Charts
  • Combo Charts
  • Comparison Charts
  • Line Graphs
  • PPC Charts
  • Sentiment Analysis Charts
  • Survey Charts

TOP CHARTS

  • Sankey Diagram
  • Likert Scale Chart
  • Comparison Bar Chart
  • Pareto Chart
  • Funnel Chart
  • Gauge Chart
  • Radar Chart
  • Radial Bar Chart
  • Sunburst Chart
  • see more
  • Scatter Plot Chart
  • CSAT Survey Bar Chart
  • CSAT Survey Chart
  • Dot Plot Chart
  • Double Bar Graph
  • Matrix Chart
  • Multi Axis Line Chart
  • Overlapping Bar Chart
  • Control Chart
  • Slope Chart
  • Clustered Bar Chart
  • Clustered Column Chart
  • Box and Whisker Plot
  • Tornado Chart
  • Waterfall Chart
  • Word Cloud
  • see less

RESOURCES

  • Blog
  • Resources
  • YouTube
SIGN UP FOR UPDATES

We wouldn't dream of spamming you or selling your info.

© 2025 ChartExpo, all rights reserved.