• Home
  • Tools dropdown img
    • Spreadsheet Charts

      • ChartExpo for Google Sheets
      • ChartExpo for Microsoft Excel
    • Power BI Charts

      • Power BI Custom Visuals by ChartExpo
    • Word Cloud

  • Charts dropdown img
    • Chart Category

      • Bar Charts
      • Circle Graphs
      • Column Charts
      • Combo Charts
      • Comparison Charts
      • Line Graphs
      • PPC Charts
      • Sentiment Analysis Charts
      • Survey Charts
    • Chart Type

      • Box and Whisker Plot
      • Clustered Bar Chart
      • Clustered Column Chart
      • Comparison Bar Chart
      • Control Chart
      • CSAT Survey Bar Chart
      • CSAT Survey Chart
      • Dot Plot Chart
      • Double Bar Graph
      • Funnel Chart
      • Gauge Chart
      • Likert Scale Chart
      • Matrix Chart
      • Multi Axis Line Chart
      • Overlapping Bar Chart
      • Pareto Chart
      • Radar Chart
      • Radial Bar Chart
      • Sankey Diagram
      • Scatter Plot Chart
      • Slope Chart
      • Sunburst Chart
      • Tornado Chart
      • Waterfall Chart
      • Word Cloud
    • Google Sheets
      Microsoft Excel
  • Services
  • Pricing
  • Contact us
  • Blog
  • Support dropdown img
      • Gallery
      • Videos
      • Contact us
      • FAQs
      • Resources
    • Please feel free to contact us

      atsupport@chartexpo.com

Categories
All Data Visualizations Data Analytics Surveys
Add-ons/
  • Google Sheets
  • Microsoft Excel
  • Power BI
All Data Visualizations Data Analytics Surveys
Add-ons
  • Google Sheets
  • Microsoft Excel
  • Power BI

We use cookies

This website uses cookies to provide better user experience and user's session management.
By continuing visiting this website you consent the use of these cookies.

Ok

ChartExpo Survey


Home > Blog > Microsoft Excel

Survey Research Examples to Boost your Results

Picture yourself settling down for a night of Netflix and chill when your phone buzzes with a notification. It’s an email from your favorite startup asking you to do a survey. It can be any type there are a lot of survey research examples.

Survey Research Examples

Normally, you’d hit delete faster than you can say “spam,” but something catches your eye. The subject line reads: “Help us make our product even better, [Your Name].”

Intrigued, you click to open the email. It’s not just any old survey – it’s personalized and engaging. Suddenly, you’re invested. You want to help this company succeed. You’re willing to take a few minutes out of your evening to do it.

This, my friend, is the power of a well-crafted survey. By personalizing your surveys and making them engaging, you’re likely to get accurate and helpful responses. And with the right tools, creating a survey that engages your audience and gets results is probable.

I’ve scoured the internet to find the best survey research examples to inspire you. As a result, you can see what works and what doesn’t.

But first…

Table of Contents:

  1. What is Survey Research?
  2. Importance of Survey Research
  3. Best Survey Research Examples
  4. How to Analyze Survey Research Data in Excel?
  5. Wrap Up

What is Survey Research?

Survey research is a systematic approach to collecting and analyzing data from a targeted audience. We can liken it to a telescope. It allows us to delve deeper and reveal the concealed realm of human experiences. As a result, it offers valuable insights and facilitates a better understanding of various phenomena.

Importance of Survey Research

Survey research holds significant importance for several reasons:

  1. Data collection: With a survey, you can methodically and effectively collect information from a large number of respondents, facilitating survey data collection. This process enables the acquisition of extensive data on the target audience’s viewpoints, mindsets, behaviors, and characteristics.
  2. Understanding public opinion: Surveys enable researchers to gauge public opinion on various topics. Such topics include political views, social issues, consumer preferences, or satisfaction with products and services. This information is crucial for decision-making by businesses, governments, and organizations.
  3. Hypothesis testing: Surveys allow you to gather data on variables of interest and test relationships between them. Consequently, you can identify associations, correlations, and potential causal relationships between different factors.
  4. Planning and evaluation: Surveys play a vital role in the planning and evaluation of programs, policies, and interventions. By getting feedback and measuring outcomes, you can assess the effectiveness and impact of initiatives. Consequently, make informed decisions for future improvements.
  5. Predictive modeling: You can use survey data to develop predictive models and forecast future trends.
  6. Decision-making: Surveys provide valuable insights into specific target populations. This facilitates understanding the target groups’ unique needs, preferences, and concerns to inform decisions.

Best Survey Research Examples

  • Customer Satisfaction Survey

Customer satisfaction surveys help identify improvement areas, measure customer loyalty and inform decision-making to enhance customer satisfaction.

Example

    • How satisfied are you with our product/service?
    • What features or aspects of our product/service do you find most valuable?
    • How likely will you recommend our product/service to a friend or colleague?
    • Have you encountered any challenges or issues while using our product/service?
  • Employee Engagement Survey

Employee engagement surveys aid in evaluating employees’ contentment, drive, and dedication. They measure job satisfaction, work-life balance, communication efficacy, and organizational culture.

Example

    • How satisfied are you with your current job?
    • Do you utilize your skills and abilities fully in your role?
    • How often do you receive recognition or appreciation for your work?
    • Are you satisfied with the organization’s professional development and growth opportunities?
    • How would you rate the level of communication and collaboration among team members and across departments?
  • Business Research Survey

Market research surveys help you gather data on consumer preferences, purchasing behavior, brand perception, and market trends. This information assists in developing marketing strategies, launching new products, and staying competitive in the market.

Example

    • How did you first hear about our product/service?
    • How satisfied are you with the quality of our product/service?
    • What factors influenced your decision to choose our product/service over competitors?
    • How frequently do you use our product/service?
    • Would you recommend our product/service to others?
  • Social Survey

Social scientists employ longitudinal surveys and other types of surveys to study various social phenomena and trends. These surveys contribute to understanding social dynamics over time and help inform social policies.

Example

    • Do you agree with the statement: “There is equal opportunity for everyone in our society to succeed”?
    • How satisfied are you with the availability of affordable housing in your community?
    • How concerned are you about climate change and its impact on the environment?
    • Have you experienced or witnessed discrimination based on race, gender, or other factors in the past year?
    • How often do you participate in community volunteer activities or engage in social causes?
  • Academic Research Survey

Surveys, including survey templates, are commonly used in academic research across psychology, sociology, education, and economics disciplines. They help to investigate specific research questions, gather data on variables of interest, and analyze relationships between different factors.

Example

    • How often do you engage in extracurricular activities outside your academic coursework?
    • How satisfied are you with the support and resources provided by your academic advisor?
    • How frequently do you collaborate with peers on research projects or academic assignments?
    • How satisfied are you with the accessibility and usability of online learning platforms provided by your institution?

How to Analyze Survey Research Data in Excel?

Analyzing survey research data in Excel can provide valuable insights and aid in making informed decisions. Excel is a powerful tool that offers various functionalities to organize and summarize survey data. However, it falls short when it comes to data visualization.

We have a solution – ChartExpo.

ChartExpo is a third-party add-in that provides ready-to-use charts and graphs for survey data storytelling. You can turn your raw data into meaningful insights to help you with informed decision-making.

Benefits of Using ChartExpo

  • ChartExpo has a vast array of visualizations that let you cherry-pick the perfect one for your data. This means you can streamline data analysis and presentation, putting your best data foot forward.
  • Say goodbye to coding headaches because creating insightful visualizations with ChartExpo is a breeze. Its intuitive user interface lets you create insightful charts with a few clicks.
  • Make your visualizations as unique as your data with ChartExpo’s customization options. Whether you prefer bold and bright or sleek and minimalist, you can tweak the design elements appropriately.
  • ChartExpo offers exceptional value for money, with a free 7-day trial and a $10 monthly plan. Therefore, you can start exploring your data insights without breaking the bank.

How to Install ChartExpo in Excel?

  1. Open your Excel application.
  2. Open the worksheet and click the “Insert” menu.
  3. You’ll see the “My Apps” option.
  4. In the office Add-ins window, click “Store” and search for ChartExpo on my Apps Store.
  5. Click the “Add” button to install ChartExpo in your Excel.

ChartExpo charts are available both in Google Sheets and Microsoft Excel. Please use the following CTA’s to install the tool of your choice and create beautiful visualizations in a few clicks in your favorite tool.

Example

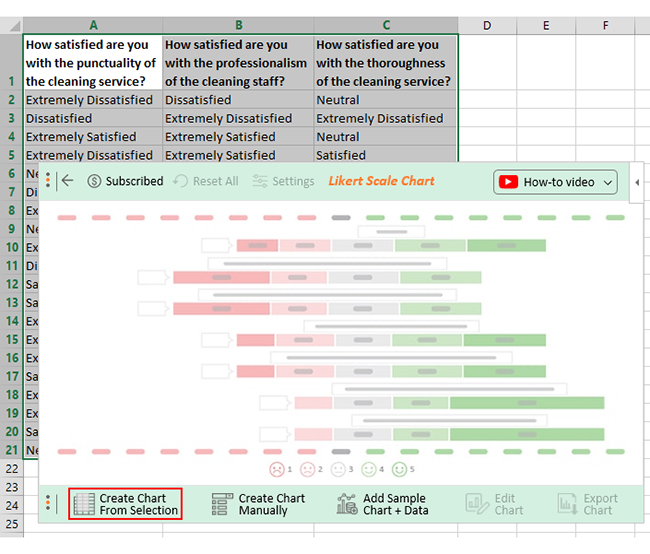
Let’s say you run a cleaning services business. You have created a feedback survey containing the following questions.

  • How satisfied are you with the punctuality of the cleaning service?
  • How satisfied are you with the professionalism of the cleaning staff?
  • How satisfied are you with the thoroughness of the cleaning service?

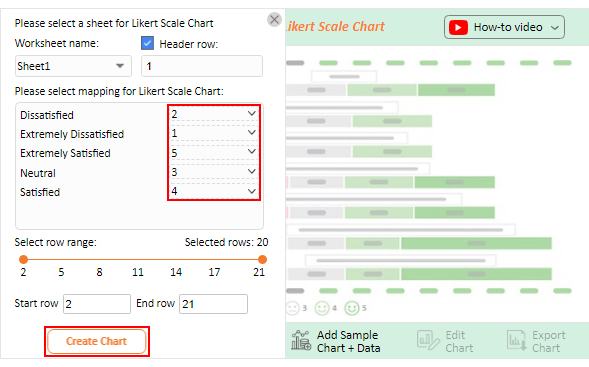
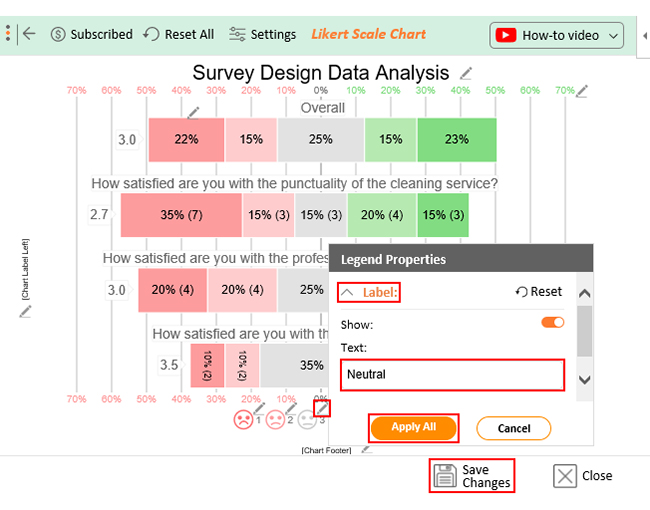
You have mapped the response scale below to each question using the Likert Scale for respondents to choose their answers.

  1. Extremely Dissatisfied
  2. Dissatisfied
  3. Neutral
  4. Satisfied
  5. Extremely Satisfied

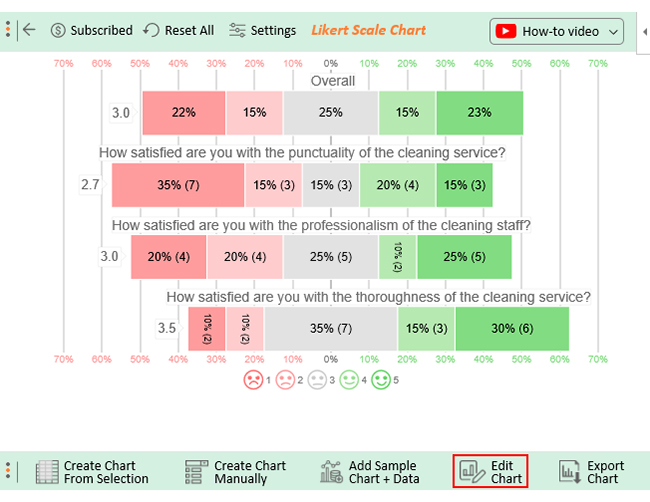
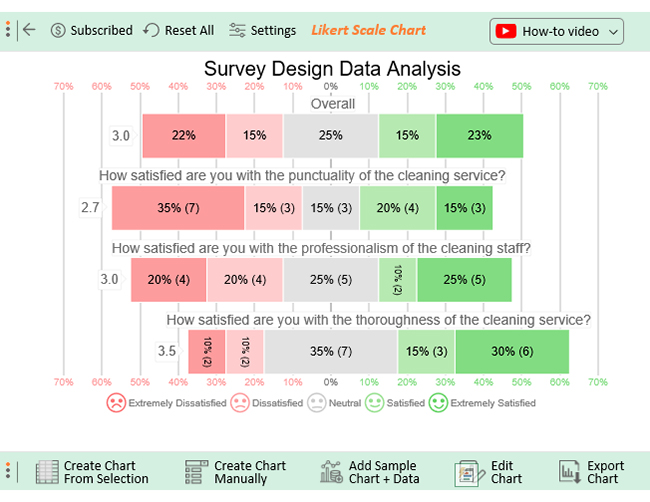
Let’s say your feedback survey yields the data table below.

How satisfied are you with the punctuality of the cleaning service? How satisfied are you with the professionalism of the cleaning staff? How satisfied are you with the thoroughness of the cleaning service?
Extremely Dissatisfied Dissatisfied Neutral
Dissatisfied Extremely Dissatisfied Extremely Dissatisfied
Extremely Satisfied Extremely Satisfied Neutral
Extremely Dissatisfied Extremely Satisfied Satisfied
Neutral Satisfied Neutral
Dissatisfied Extremely Satisfied Extremely Satisfied
Extremely Dissatisfied Extremely Satisfied Extremely Satisfied
Neutral Neutral Neutral
Extremely Satisfied Dissatisfied Extremely Satisfied
Dissatisfied Neutral Extremely Satisfied
Satisfied Neutral Satisfied
Satisfied Extremely Dissatisfied Extremely Satisfied
Extremely Dissatisfied Dissatisfied Neutral
Extremely Dissatisfied Neutral Extremely Dissatisfied
Extremely Dissatisfied Extremely Satisfied Neutral
Satisfied Extremely Dissatisfied Satisfied
Extremely Dissatisfied Dissatisfied Dissatisfied
Extremely Satisfied Neutral Extremely Satisfied
Satisfied Extremely Dissatisfied Dissatisfied
Neutral Satisfied Neutral

This table contains example data. Expect many responses in real life.

  • To get started with ChartExpo, install ChartExpo in Excel.
  • Navigate to the INSERT menu and select My Apps. 
insert chartexpo in excel
  • Select ChartExpo and click the “Insert” button.
open chartexpo in excel
  • Once it loads, choose the “Likert Scale Chart” from the charts list.
search likert scale chart in excel
  • Select the data from the sheet and click the “Create Chart From Selection” button.
Create Chart From Selection ce373
  • When you click the “Create Chart From Selection” button, you have to map responses with numbers manually. The Likert scale has this arrangement:
    • Extremely Dissatisfied = 1
    • Dissatisfied = 2
    • Neutral = 3
    • Satisfied = 4
    • Extremely Satisfied = 5
  • Once all is set, click the “Create Chart” button.
Map Likert Responses to Numbers ce373
  • ChartExpo will generate the visualization below for you.
Survey Research Examples Design Template
  • Click the “Edit Chart” button to modify your chart.
  • Click the pencil icon next to the Chart Header to add a title.
  • This will open the properties dialog.
  • Add a heading in Line 1 under the Text section and enable the Show option. Then click the “Apply” button.
apply title on chart ce373
  • Let’s say you want to add text responses instead of numbers against every emoji.
  • Click the pencil icon next to the respective emoji. Expand the “Label” properties and write the required text. Then click the “Apply All” button.
  • Click the “Save Changes” button to persist the changes.
apply label on chart ce373
  • Your final chart will appear below.
Final Survey Research Examples

Insights

  • 35% of customers are content with the punctuality of your cleaning service. 50% expressed dissatisfaction, and the remaining 15% maintained neutrality.
  • Regarding professionalism, only 35% of customers are satisfied, while 40% are dissatisfied.
  • Regarding the behavior of the cleaning staff, 45% are satisfied, 20% dissatisfied, and the remaining 35% remain neutral.
  • Overall;
    • 38% of customers gave positive responses to the survey questions.
    • 37% gave negative feedback.
    • 25% remained neutral.

FAQs

What is an example of survey research?

An example of survey research is collecting data on consumer preferences when launching a new product. The survey would include questions about product features, pricing, and purchasing behavior. Consequently, helps with understanding customer needs and informs decisions on marketing strategies.

What are 5 good survey questions?

  • How satisfied are you with our customer service?
  • How likely are you to recommend our product/service?
  • What improvements would you suggest to our product/service?
  • How frequently do you use our product/service?
  • Are you satisfied with the responsiveness of our team?

Can survey research help you understand your target audience better?

Yes, survey research can significantly help in understanding the target audience better. Surveys gather data on opinions, attitudes, preferences, and behaviors. Consequently, provides valuable insights that can inform decision-making, tailor products or services, and improve overall customer satisfaction.

Wrap Up

Survey research plays a crucial role in various fields and provides a wealth of valuable information. Survey research examples highlighted above demonstrate its versatility and effectiveness in gathering data. Also, it helps in understanding opinions, behaviors, and attitudes and informing decision-making processes.

Customer satisfaction surveys enable businesses to gauge customer perception, identify improvement areas, and enhance their offerings accordingly. Employee engagement surveys help evaluate employee satisfaction, identify areas for growth, and foster a positive work environment.

Market research surveys offer valuable insights into consumer preferences. This lets you make informed decisions about your products, services, and marketing strategies. Additionally, Social surveys shed light on social attitudes, inequality, and community dynamics, guiding policies and interventions.

Lastly, academic research surveys contribute to knowledge creation and understanding within various disciplines while supporting evidence-based decision-making.

Navigating through the sea of survey data can be daunting. With ChartExpo, you can create visualizations that show the path and progression of your data over time. This will help you spot patterns and anomalies effortlessly.

Do not hesitate.

Get started with ChartExpo today and experience the magic yourself.

How much did you enjoy this article?

ExcelAd2
Start Free Trial!
128088

Related articles

next previous
Microsoft Excel8 min read

Excel Task Tracker Template for Smarter Task Insights

Task tracker template in Excel organizes tasks, tracks deadlines, and boosts efficiency. Learn its benefits, and explore expert tips to simplify task management.

Microsoft Excel10 min read

Invoice Tracker Template in Excel for Better Insights

An invoice tracker Excel template helps track invoices, due dates, and payments. Learn how to use this template for better financial management.

Microsoft Excel12 min read

Key Performance Indicators in Healthcare for Better Insights

Key Performance Indicators in healthcare track patient care and efficiency. Learn about these KPIs, top examples, and how to use them to improve outcomes.

Microsoft Excel10 min read

BMI Calculation Formula in Excel for Better Fitness Insights

The BMI calculation formula in Excel helps track and analyze body mass index. Explore step-by-step instructions and tips to simplify BMI tracking in Excel.

Microsoft Excel29 min read

How to Create a Tornado Chart in Excel? A Complete Guide

Click to learn how to plot a Tornado Chart in Excel using easy-to-follow steps. Also, we’ll address the following question: what is a Tornado Diagram?

ChartExpo logo

Turn Data into Visual
Stories

CHARTEXPO

  • Home
  • Gallery
  • Videos
  • Services
  • Pricing
  • Contact us
  • FAQs
  • Privacy policy
  • Terms of Service
  • Sitemap

TOOLS

  • ChartExpo for Google Sheets
  • ChartExpo for Microsoft Excel
  • Power BI Custom Visuals by ChartExpo
  • Word Cloud

CATEGORIES

  • Bar Charts
  • Circle Graphs
  • Column Charts
  • Combo Charts
  • Comparison Charts
  • Line Graphs
  • PPC Charts
  • Sentiment Analysis Charts
  • Survey Charts

TOP CHARTS

  • Sankey Diagram
  • Likert Scale Chart
  • Comparison Bar Chart
  • Pareto Chart
  • Funnel Chart
  • Gauge Chart
  • Radar Chart
  • Radial Bar Chart
  • Sunburst Chart
  • see more
  • Scatter Plot Chart
  • CSAT Survey Bar Chart
  • CSAT Survey Chart
  • Dot Plot Chart
  • Double Bar Graph
  • Matrix Chart
  • Multi Axis Line Chart
  • Overlapping Bar Chart
  • Control Chart
  • Slope Chart
  • Clustered Bar Chart
  • Clustered Column Chart
  • Box and Whisker Plot
  • Tornado Chart
  • Waterfall Chart
  • Word Cloud
  • see less

RESOURCES

  • Blog
  • Resources
  • YouTube
SIGN UP FOR UPDATES

We wouldn't dream of spamming you or selling your info.

© 2025 ChartExpo, all rights reserved.