• Home
  • Tools dropdown img
    • Spreadsheet Charts

      • ChartExpo for Google Sheets
      • ChartExpo for Microsoft Excel
    • Power BI Charts

      • Power BI Custom Visuals by ChartExpo
    • Word Cloud

  • Charts dropdown img
    • Chart Category

      • Bar Charts
      • Circle Graphs
      • Column Charts
      • Combo Charts
      • Comparison Charts
      • Line Graphs
      • PPC Charts
      • Sentiment Analysis Charts
      • Survey Charts
    • Chart Type

      • Box and Whisker Plot
      • Clustered Bar Chart
      • Clustered Column Chart
      • Comparison Bar Chart
      • Control Chart
      • CSAT Survey Bar Chart
      • CSAT Survey Chart
      • Dot Plot Chart
      • Double Bar Graph
      • Funnel Chart
      • Gauge Chart
      • Likert Scale Chart
      • Matrix Chart
      • Multi Axis Line Chart
      • Overlapping Bar Chart
      • Pareto Chart
      • Radar Chart
      • Radial Bar Chart
      • Sankey Diagram
      • Scatter Plot Chart
      • Slope Chart
      • Sunburst Chart
      • Tornado Chart
      • Waterfall Chart
      • Word Cloud
    • Google Sheets
      Microsoft Excel
  • Services
  • Pricing
  • Contact us
  • Blog
  • Support dropdown img
      • Gallery
      • Videos
      • Contact us
      • FAQs
      • Resources
    • Please feel free to contact us

      atsupport@chartexpo.com

Categories
All Data Visualizations Data Analytics Surveys
Add-ons/
  • Google Sheets
  • Microsoft Excel
  • Power BI
All Data Visualizations Data Analytics Surveys
Add-ons
  • Google Sheets
  • Microsoft Excel
  • Power BI

We use cookies

This website uses cookies to provide better user experience and user's session management.
By continuing visiting this website you consent the use of these cookies.

Ok

ChartExpo Survey


Home > Blog > Microsoft Excel

23+ Sample Survey Questions for Real Insights

Are you tired of boring, mundane surveys that put you to sleep faster than a lullaby?

sample survey questions

Today we bring you a survey like no other. A survey that will leave you feeling like you just had a conversation with your favorite comedian. We present to you the sample survey questions for brand opinion using the Likert scale.

Yes, you heard it right.

Sample survey is not only informative but also entertaining. With questions that will make you think, laugh, and maybe even shed a tear.

Grab a cup of coffee, and get ready to experience a survey like never before.

Table of Contents:

  1. What are Sample Survey Questions?
  2. Why are Sample Survey Questions Important?
  3. How to Write the Best Sample Survey Questions?
  4. Sample Survey Questions Types and Objectives
  5. 23+ Sample Survey Questions Examples
  6. How to add Sample Survey Questions?
  7. Sample Survey Questions Data Analysis Steps
  8. Sample Survey Questions: Common Mistakes to Avoid
  9. Wrap Up

Sample Survey Questions: What and Why

Sample survey questions serve as carefully crafted inquiries designed to gather specific information from respondents. They play a crucial role in understanding people’s opinions, preferences, and experiences.

By using well-structured sample survey questions, including matrix survey questions, researchers can obtain a deeper understanding of their target audience. This approach allows them to make informed decisions, identify trends, and address specific needs effectively.

Why are Sample Survey Questions Important?

Sample surveys are like a window into people’s minds. They provide a unique opportunity to capture a population’s thoughts, opinions, and experiences. This gives you vital insights into their world to help you with decision-making.

Surveys are a potent instrument for researchers, businesses, and governments alike. They facilitate meaningful connections with people and foster a deeper understanding of phenomena.

How to Write the Best Sample Survey Questions?

Follow the steps below to write sample survey questions that yield valuable insights:

  • Define your research objectives

Identify the purpose of your survey and the specific data to gather. This will guide your question-writing process.

  • Choose the appropriate question type

Select the sample survey question that aligns with your objectives. Options include multiple choice, Likert Scale, rating scale, open-ended questions, ranking, etc.

  • Keep questions clear and concise

Use simple, straightforward language. Avoid jargon that may confuse respondents.

  • Be specific and focused

Address a single topic in each question.

Avoid combining multiple ideas. This can lead to ambiguity and inconsistent responses.

  • Avoid leading or biased language

Construct the sample survey questions neutrally to maintain objectivity.

Avoid words that can influence your respondents toward a particular response.

  • Consider the target audience

Tailor language to suit the characteristics and demographics of your target audience. Ensure your sample survey questions are relevant and relatable.

Sample Survey Questions Types and Objectives

Depending on your research objectives, you can choose from various tested and proven question types.

Let’s take a closer look.

  • Multiple Choice

In this type of survey, participants select from predefined options. It offers flexibility and ease of analysis.

  • Likert Scale

It allows  respondents to rate their agreement on a scale, ranging from “strongly agree” to “strongly disagree.” The Likert Scale can help you measure attitudes and opinions effectively.

  • Rating Scale

This is one of the best sample survey questions that allow participants to rate a specific attribute or item using a numerical scale.

Use rating scale question types for gathering quantitative data.

  • Open-ended

In this survey question type, you provide your participants with detailed, unrestricted answers.

It can help you capture rich and qualitative insights.

  • Ranking

It allows your survey participants to rank options based on their preference or priority.

  • Dichotomous

This is one of the most used sample survey questions and it comes with only two possible responses, such as “yes” or “no” or “true” or “false.”

23+ Sample Survey Questions Examples to Ask

If you’ve ever conducted a survey, you know how crucial it is to ask the right survey questions.

However, what exactly makes your sample survey question best of all?

The best sample survey questions are concise and to the point. Long-winded questions can confuse and frustrate respondents. This can lead to incomplete or inaccurate responses.

Here are some categories and examples of sample survey questions that researchers often find valuable:

  1. Demographic Questions:
    • Age: “What is your age range?”
    • Gender: “How do you identify your gender?”
    • Location: “Where are you located?”
  2. Opinion and Satisfaction:
    • “On a scale of 1 to 10, how satisfied are you with our product/service?”
    • “What do you like most about our product/service?”
    • “What improvements would you suggest?”
  3. Product/Service Usage:
    • “How often do you use our product/service?”
    • “What features do you find most useful?”
    • “Have you recommended our product/service to others?”
  4. Purchase Behavior:
    • “What influences your decision to purchase a product?”
    • “How likely are you to purchase in the next month?”
    • “Do you prefer online or in-store shopping?”
  5. Brand Perception:
    • “What words come to mind when you think of our brand?”
    • “How would you describe our brand to a friend?”
    • “What sets our brand apart from competitors?”
  6. Communication and Feedback:
    • “How do you prefer to receive updates from us?”
    • “Have you ever provided feedback to our customer service?”
    • “What channels do you use to communicate with us?”
  7. Future Expectations:
    • “What improvements do you hope to see in our future products/services?”
    • “How likely are you to continue using our product/service?”
    • “What features would you like us to introduce?”
  8. Social and Environmental Responsibility:
    • “How important is sustainability in your purchasing decisions?”
    • “Do you prefer brands that engage in social responsibility initiatives?”
    • “Would you pay more for eco-friendly products?”

Remember, the best sample survey questions are clear, concise, and directly aligned with the goals of the research

How to add Sample Survey Questions?

Let’s say you want to launch a new mobile phone. Therefore, you have to know what customers want. This necessitates you to conduct a survey with the following sample survey questions.

  • How important is the long-lasting battery for you while purchasing a phone?
  • How important is the crystal-clear display for you while purchasing a phone?
  • To what extent does camera quality factor into your decision?
  • To what extent does plenty of storage space factor into your decision?

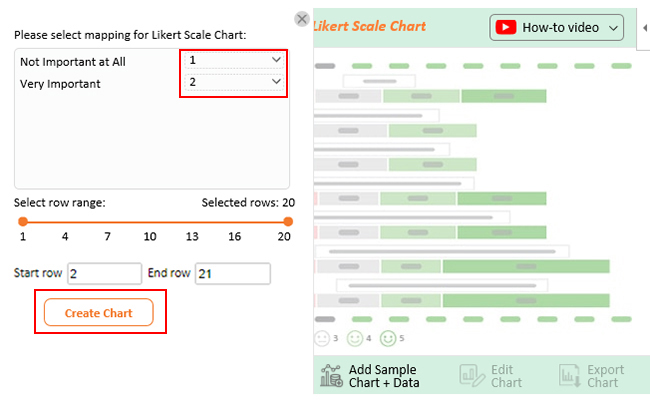
For efficiency, you want to map the following responses to each question.

  1. Not Important at All
  2. Very Important

Wondering how to approach this?

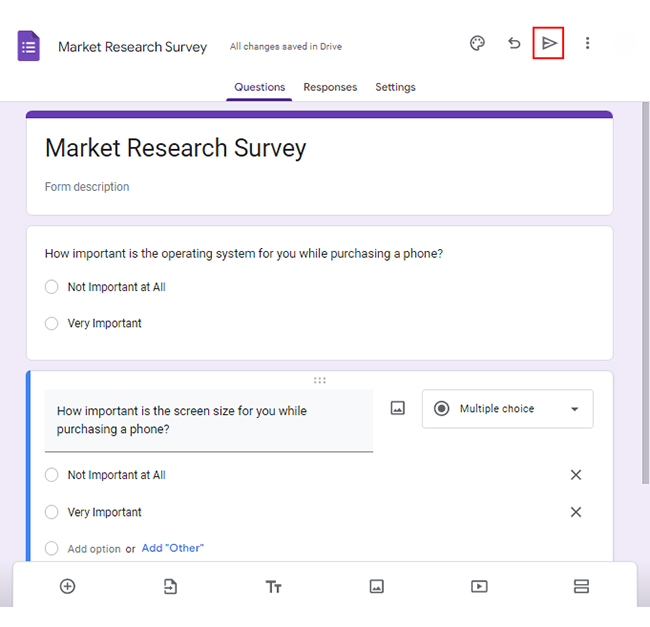
The answer is simple – create your survey using a Google Forms survey form template.

To build a sample survey in Google Forms, follow these steps.

  • Log in to Google Forms using your Google account.
  • Click the “Blank” button to open a new form.
open a new form
  • Select the type of question you want to use, such as multiple-choice, checkbox, or short answer.
  • Type your Questions in the “Untitled Question” section. Write “Option 1” and choose “Add option” for more options.
untitled form
  • Click the “Send” button to share the form with the target audience.
Click the Send button
  • When you have collected sufficient responses, click the three vertical dots next to “Link to Sheets.”
Link to Sheets
  • Select the option to download the responses as a.csv file.
download the responses

Sample Survey Questions Data Analysis Steps

Are you tired of staring at boring spreadsheets full of survey data? Do you want to spice up your data analysis game with insightful charts?

Look no further than ChartExpo – the ultimate tool for visualizing your survey results. It is the perfect solution for making data analysis less dull and more dazzling.

How?

Creating survey charts allows you to transform raw survey data into meaningful insights and easily communicate your findings.

Benefits of Using ChartExpo

  • ChartExpo’s user-friendly interface makes it easy to create insightful data visualizations without coding skills.
  • ChartExpo’s customization features enable you to create unique visuals. This is by altering the colors, fonts, and styles to your liking.
  • ChartExpo gives you great value for money. It offers a free 7-day trial and a $10 monthly plan.

How to Install ChartExpo?

  1. Open your Excel application.
  2. Open the worksheet and click the “Insert” menu.
  3. You’ll see the “My Apps” option.
  4. In the office Add-ins window, click “Store” and search for ChartExpo on my Apps Store.
  5. Click the “Add” button to install ChartExpo in your Excel.

ChartExpo charts and graphs are available both in Google Sheets and Microsoft Excel. Please use the following CTA’s to install the tool of your choice and create beautiful visualizations in a few clicks in your favorite tool.

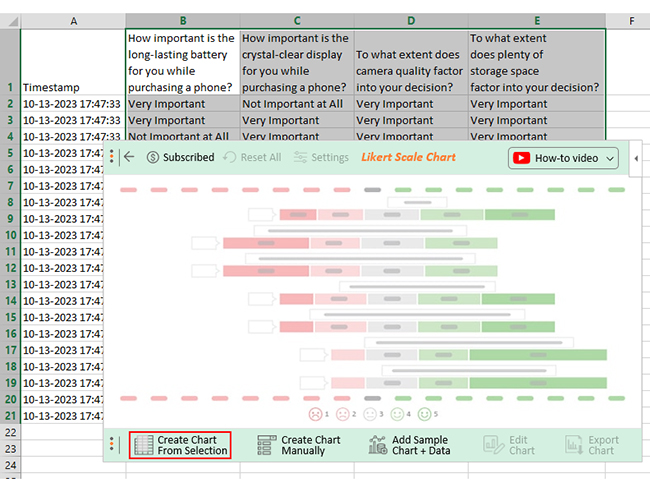
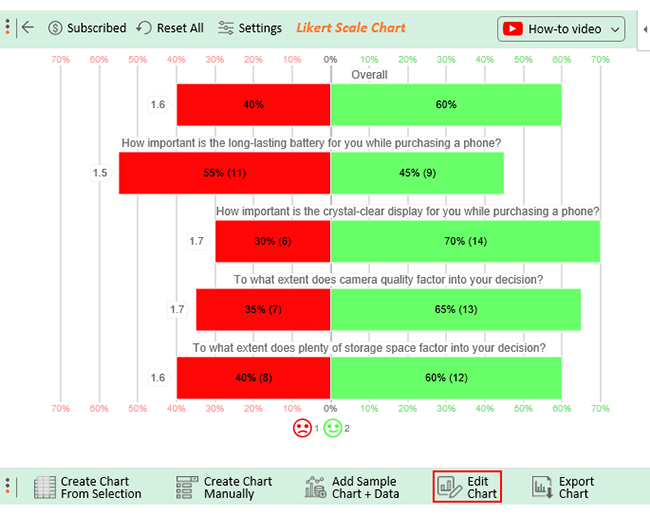
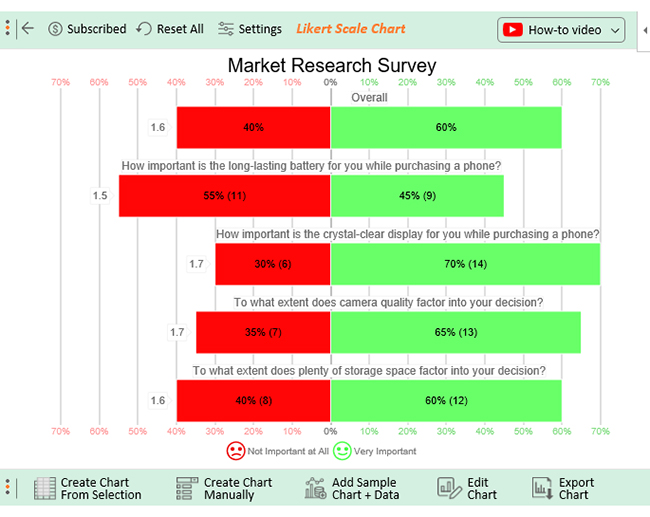
Let’s say your survey yields the data table below.

Timestamp How important is the long-lasting battery for you while purchasing a phone? How important is the crystal-clear display for you while purchasing a phone? To what extent does camera quality factor into your decision? To what extent does plenty of storage space factor into your decision?
10-13-2023 17:47:33 Very Important Not Important at All Very Important Very Important
10-13-2023 17:47:33 Very Important Very Important Very Important Very Important
10-13-2023 17:47:33 Not Important at All Very Important Very Important Very Important
10-13-2023 17:47:33 Very Important Very Important Very Important Not Important at All
10-13-2023 17:47:33 Not Important at All Very Important Very Important Very Important
10-13-2023 17:47:33 Very Important Not Important at All Very Important Not Important at All
10-13-2023 17:47:33 Not Important at All Very Important Very Important Not Important at All
10-13-2023 17:47:33 Very Important Very Important Very Important Not Important at All
10-13-2023 17:47:33 Not Important at All Very Important Not Important at All Very Important
10-13-2023 17:47:33 Very Important Very Important Not Important at All Very Important
10-13-2023 17:47:34 Not Important at All Very Important Not Important at All Very Important
10-13-2023 17:47:35 Not Important at All Very Important Very Important Not Important at All
10-13-2023 17:47:36 Not Important at All Not Important at All Very Important Very Important
10-13-2023 17:47:37 Not Important at All Not Important at All Not Important at All Very Important
10-13-2023 17:47:38 Not Important at All Very Important Not Important at All Very Important
10-13-2023 17:47:39 Very Important Very Important Very Important Not Important at All
10-13-2023 17:47:40 Not Important at All Not Important at All Not Important at All Not Important at All
10-13-2023 17:47:41 Very Important Very Important Very Important Very Important
10-13-2023 17:47:42 Very Important Not Important at All Not Important at All Very Important

This table contains example data. Expect many responses and questions in real life.

  • To get started with ChartExpo, install ChartExpo in Excel.
  • Now Click on My Apps from the INSERT menu.
insert chartexpo in excel
  • Choose ChartExpo from My Apps, then click Insert.
open chartexpo in excel
  • Once it loads, choose the “Likert Scale Chart” from the charts list.
search likert scale chart in excel
  • Click the “Create Chart From Selection” button after selecting the data from the sheet, as shown.
create likert scale chart in excel
  • When you click the “Create Chart From Selection” button, you have to map responses with numbers manually. The Likert scale has this arrangement:
    • Not Important at All = 1
    • Very Important = 2
  • Once all is set, click the “Create Chart” button.
make likert scale chart in excel
  • The default scale for the chart is set to 5. However, our data has a 2-scale response. To change the scale, click “Settings” in the top bar.
  • Then select the “Scale Type” option from the Chart Setting Property window. Then choose the desired scale, in our case “2”, from the drop-down list.
edit likert scale chart in excel
  • ChartExpo will generate the visualization below for you.
set likert scale chart in excel
  • If you want to have the title of the chart, click on Edit Chart, as shown in the above image.
  • To change the title of the chart, click on the pencil icon that is available very next to Chart Header.
  • It will open the properties dialog. Under the Text section, you can add a heading in Line 1 enable the Show Give the appropriate title of your chart, and click on Apply button.
update likert scale chart in excel
  • Let’s say you want to add text responses instead of numbers against every emoji.
  • Click the pencil icon next to the respective emoji. Expand the “Label” properties and write the required text. Then click the “Apply All” button.
  • Click the “Save Changes” button to persist the changes.
save likert scale chart in excel
  • The final chart will look as below.
what is sample survey questions

Insights

  • When buying a phone, 45% of customers consider long-lasting battery life to be a crucial factor. 55% do not think it is necessary.
  • 70% believe that a crystal-clear display is important, while 30% do not find it significant.
  • 65% feel that camera quality is important, while 35% do not consider it a vital feature.
  • 60% believe having plenty of storage space is crucial, while 40% find it insignificant.
  • In general, 60% of customers believe various phone features are essential. Contrarily, 40% do not consider them important.

Sample Survey Questions: Common Mistakes to Avoid

Follow the tips below to ensure you gather accurate and meaningful data.

  • Clearly define your research objectives

Before crafting your survey questions, have a clear understanding of goals and objectives.

This will ensure your questions target the right areas.

  • Keep questions concise and specific

Avoid using vague or ambiguous language. It may confuse your respondents.

Each question should focus on a single topic or concept. This is because it will make it easier for participants to provide accurate responses.

  • Use simple and clear language

Ensure your questions are simple and easy to understand. Steer clear of technical terms that might be unfamiliar to some people.

  • Avoid leading or biased questions

Your questions should be neutral.

This will allow your respondents to provide genuine opinions. Avoid wording that may influence your audience towards a particular answer.

  • Pretest the survey

Before distributing your survey, conduct a pilot test with a small group. This will help you identify potential mistakes.

FAQs

What are some good sample survey questions?

Here are examples of good survey questions;

  • How satisfied are you with our product/service?
  • What factors influenced your decision to purchase our product/service?
  • How frequently do you use our product/service?
  • What improvements would you like to see in our product/service?

What is an example of a sample survey question?

A customer satisfaction survey exemplifies a sample survey. Here, a selected group of customers share their opinions on product/service experiences. This data aids in pinpointing areas for improvement and making informed decisions, enhancing overall satisfaction.

What are sample survey questions used for?

Sample surveys gather data and insights about specific populations or target groups. This enables the assessment of opinions, preferences, behaviors, and characteristics. Furthermore, they support decision-making, trend identification, satisfaction measurement, and understanding of customer needs.

Wrap Up

In conclusion, don’t underestimate the power of sample survey questions.

Sample survey questions play a vital role in gathering valuable data from various target groups. Sample surveys serve various purposes, including assessing opinions, preferences, behaviors, or characteristics.

One such example is the customer satisfaction survey. A selected sample of customers provides feedback on their experiences with a product or service.

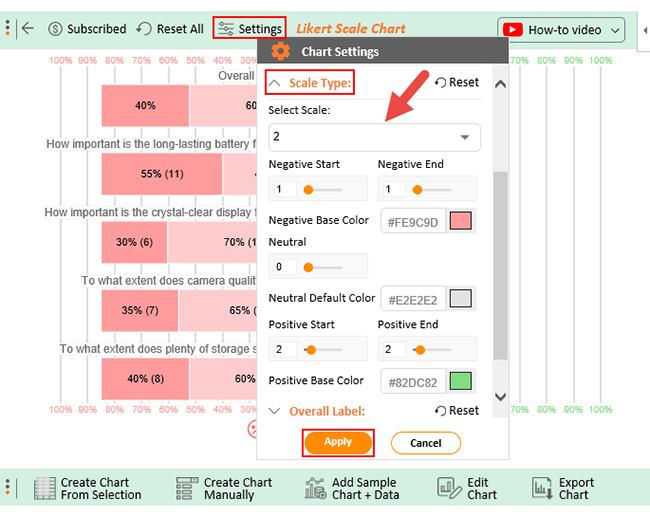
The Likert scale offers a range of response options, typically ranging from strongly agree to strongly disagree. This allows participants to express their agreement or disagreement with a given statement. As a result, it helps to quantify and analyze brand perceptions effectively.

You can obtain valuable insights into customers’ opinions and preferences by employing sample surveys with Likert scale questions. Consequently, understand the strengths and weaknesses of your brand.

ChartExpo for Excel helps you maximize the usefulness of your sample survey question data. With this tool, you can create appealing and meaningful visualizations that make extracting valuable insights easily.

How much did you enjoy this article?

ExcelAd2
Start Free Trial!
127027

Related articles

next previous
Microsoft Excel8 min read

Excel Task Tracker Template for Smarter Task Insights

Task tracker template in Excel organizes tasks, tracks deadlines, and boosts efficiency. Learn its benefits, and explore expert tips to simplify task management.

Microsoft Excel10 min read

Invoice Tracker Template in Excel for Better Insights

An invoice tracker Excel template helps track invoices, due dates, and payments. Learn how to use this template for better financial management.

Microsoft Excel12 min read

Key Performance Indicators in Healthcare for Better Insights

Key Performance Indicators in healthcare track patient care and efficiency. Learn about these KPIs, top examples, and how to use them to improve outcomes.

Microsoft Excel10 min read

BMI Calculation Formula in Excel for Better Fitness Insights

The BMI calculation formula in Excel helps track and analyze body mass index. Explore step-by-step instructions and tips to simplify BMI tracking in Excel.

Microsoft Excel29 min read

How to Create a Tornado Chart in Excel? A Complete Guide

Click to learn how to plot a Tornado Chart in Excel using easy-to-follow steps. Also, we’ll address the following question: what is a Tornado Diagram?

ChartExpo logo

Turn Data into Visual
Stories

CHARTEXPO

  • Home
  • Gallery
  • Videos
  • Services
  • Pricing
  • Contact us
  • FAQs
  • Privacy policy
  • Terms of Service
  • Sitemap

TOOLS

  • ChartExpo for Google Sheets
  • ChartExpo for Microsoft Excel
  • Power BI Custom Visuals by ChartExpo
  • Word Cloud

CATEGORIES

  • Bar Charts
  • Circle Graphs
  • Column Charts
  • Combo Charts
  • Comparison Charts
  • Line Graphs
  • PPC Charts
  • Sentiment Analysis Charts
  • Survey Charts

TOP CHARTS

  • Sankey Diagram
  • Likert Scale Chart
  • Comparison Bar Chart
  • Pareto Chart
  • Funnel Chart
  • Gauge Chart
  • Radar Chart
  • Radial Bar Chart
  • Sunburst Chart
  • see more
  • Scatter Plot Chart
  • CSAT Survey Bar Chart
  • CSAT Survey Chart
  • Dot Plot Chart
  • Double Bar Graph
  • Matrix Chart
  • Multi Axis Line Chart
  • Overlapping Bar Chart
  • Control Chart
  • Slope Chart
  • Clustered Bar Chart
  • Clustered Column Chart
  • Box and Whisker Plot
  • Tornado Chart
  • Waterfall Chart
  • Word Cloud
  • see less

RESOURCES

  • Blog
  • Resources
  • YouTube
SIGN UP FOR UPDATES

We wouldn't dream of spamming you or selling your info.

© 2025 ChartExpo, all rights reserved.