• Home
  • Tools dropdown img
    • Spreadsheet Charts

      • ChartExpo for Google Sheets
      • ChartExpo for Microsoft Excel
    • Power BI Charts

      • Power BI Custom Visuals by ChartExpo
    • Word Cloud

  • Charts dropdown img
    • Chart Category

      • Bar Charts
      • Circle Graphs
      • Column Charts
      • Combo Charts
      • Comparison Charts
      • Line Graphs
      • PPC Charts
      • Sentiment Analysis Charts
      • Survey Charts
    • Chart Type

      • Box and Whisker Plot
      • Clustered Bar Chart
      • Clustered Column Chart
      • Comparison Bar Chart
      • Control Chart
      • CSAT Survey Bar Chart
      • CSAT Survey Chart
      • Dot Plot Chart
      • Double Bar Graph
      • Funnel Chart
      • Gauge Chart
      • Likert Scale Chart
      • Matrix Chart
      • Multi Axis Line Chart
      • Overlapping Bar Chart
      • Pareto Chart
      • Radar Chart
      • Radial Bar Chart
      • Sankey Diagram
      • Scatter Plot Chart
      • Slope Chart
      • Sunburst Chart
      • Tornado Chart
      • Waterfall Chart
      • Word Cloud
    • Google Sheets
      Microsoft Excel
  • Services
  • Pricing
  • Contact us
  • Blog
  • Support dropdown img
      • Gallery
      • Videos
      • Contact us
      • FAQs
      • Resources
    • Please feel free to contact us

      atsupport@chartexpo.com

Categories
All Data Visualizations Data Analytics Surveys
Add-ons/
  • Google Sheets
  • Microsoft Excel
  • Power BI
All Data Visualizations Data Analytics Surveys
Add-ons
  • Google Sheets
  • Microsoft Excel
  • Power BI

We use cookies

This website uses cookies to provide better user experience and user's session management.
By continuing visiting this website you consent the use of these cookies.

Ok

ChartExpo Survey


Home > Blog > Surveys

How to Make a Questionnaire? Examples & Templates

Are you looking to survey for research or commercial purposes? A well-crafted questionnaire is, therefore, necessary for reliable data collection and analysis.

how to make a questionnaire

A well-designed questionnaire can provide valuable insights that can help you improve your business, products, or services.

Therefore, learning how to make a questionnaire is crucial.

Let’s say you run a small business that sells skincare products. You want to gather customer feedback on your new product line. Therefore, you create a questionnaire.

You include questions on packaging, customer service, and product quality. The customer input empowers you to improve the packaging and raise the quality of your products. Your sales rise as a result, and your customers get more satisfied with your offerings.

Table of Content:

  1. Why is it Important to Design a Questionnaire?
  2. What to Include in a Questionnaire?
  3. 7 Steps of An Effective Questionnaire Design
    • Step 1: Define Research Objectives
    • Step 2: Define Audience & Questions
    • Step 3: Refine the Question Phrasing
    • Step 4: Develop the Response Format
    • Step 5: Questionnaires Appropriate Sequence
    • Step 6: Finalize the Layout
    • Step 7: Pretest and Revise
  4. How to Make a Good Questionnaire?
  5. 5 Questionnaire Design Examples
  6. How to Make a Questionnaire Template And Use it?
  7. Evaluating a Questionnaire in Excel: Step-by-Step
  8. How to Create a Questionnaire: Best Practices
  9. How to Make a Questionnaire – FAQs
  10. Wrap Up

Let’s get started.

Why is it Important to Design a Questionnaire?

Before creating one, let’s back up a bit and consider why and how useful a questionnaire is. A questionnaire collects information to answer research inquiries or resolve business issues.

A questionnaire’s value lies in its capacity to deliver factual information. It aids in removing bias and guarantees that the data gathered is representative of the population under study.

It can assist you in learning about the preferences, wants, and opinions of your client base. The growth of your business depends on this information design.

What to Include in a Questionnaire?

1. Introduction

  • Briefly explain the purpose of the questionnaire.
  • Assure confidentiality and provide instructions.

2. Demographic Questions

  • Collect basic information like age, gender, location, or occupation (if relevant).

3. Core Questions

  • Use a mix of closed-ended (multiple choice, Likert scale) and open-ended questions.
  • Keep them clear, concise, and unbiased.

4. Logical Flow

  • Start with simple, engaging questions.
  • Group related questions together for clarity.

5. Optional Comments Section

  • Allow respondents to share additional thoughts or feedback.

6. Conclusion

  • Thank respondents and provide submission instructions.

7 Steps of An Effective Questionnaire Design

Questionnaire design is an essential part of any research project. It helps researchers to gather the required information in an organized and efficient manner. Here are the 7 steps involved in questionnaire design:

Step 1: Define the Research Objectives

Defining the research objectives entails determining the following;

  • The research project’s goal.
  • The research questions.
  • The type of data to collect.

This will help you create relevant and meaningful questions aligned with the research goals.

Step 2: Define Your Audience & Outline Key Questions

Identify the target audience for the questionnaire, considering their characteristics, knowledge level, and language proficiency.

Step 2.1: Make a Rough Listing of the Questions

After establishing the research objectives and identifying the target audience, the subsequent stage involves creating a preliminary list of inquiries.

The questions must be broad and unrestrictive, providing room for adaptability throughout the research. Also, you can initiate the question development process by utilizing pre-existing questionnaires or research tools.

Step 3: Refine the Question Phrasing

This step ensures the questions are clear, simple, and easy to understand. It discourages the use of technical jargon or sophisticated phrase constructions that may confuse respondents. Furthermore, the questions should be free of bias and should not direct respondents to a specific answer.

Step 4: Develop the Response Format

Multiple-choice, Likert scales, and open-ended responses are some of the options for gathering feedback. It’s important to consider the data type and the research objectives while deciding on a response format.

Step 5: Put the Questionnaires into an Appropriate Sequence

This step involves arranging the questions logically to make sense to the respondents. Avoid jumping between topics or asking unrelated questions to eliminate confusion and bias in the responses.

Step 6: Finalize the Layout of the Questionnaire

The layout of the questionnaire is a vital aspect of questionnaire design. It should be visually appealing and easy to read, with clear instructions and headings. Also, ensure the questionnaire is formatted correctly, with appropriate spacing and margins.

Step 7: Pretest and Revise

It is important to pretest the questionnaire before distributing it to the intended audience. This involves sending it to a small sample of respondents. It enables you to spot any flaws with the questions, the format of the responses, or the layout. You can modify the questionnaire based on the feedback to improve its efficacy and validity.

How to Make a Good Questionnaire?

A good questionnaire is clear, concise, and well-structured to collect accurate data. Start by defining your objective and keeping questions relevant to your goal. Use a mix of closed-ended, open-ended, and rating scale questions to gather diverse insights.

Ensure questions are simple, unbiased, and logically ordered to avoid confusion. Keep the questionnaire short and engaging to maintain respondent interest. Finally, test it with a small group to refine clarity and effectiveness before full distribution.

5 Questionnaire Design Examples

1. Customer Satisfaction Survey

“How satisfied are you with our product/service?” (Scale: 1-5)
“What improvements would you suggest?” (Open-ended)

2. Employee Feedback Survey

“On a scale of 1-10, how valued do you feel at work?”
“What changes would improve your work experience?”

3. Market Research Questionnaire

“Which brands do you prefer for [product]?” (Multiple choice)
“What factors influence your purchasing decision?”

4. Event Feedback Form

“How would you rate the event overall?” (Likert scale)
“What was the most valuable part of the event?”

5. Health & Wellness Survey

“How often do you exercise weekly?” (Dropdown options)
“Do you have any dietary restrictions?” (Yes/No + Specify)

How to Make a Questionnaire Template And Use it?

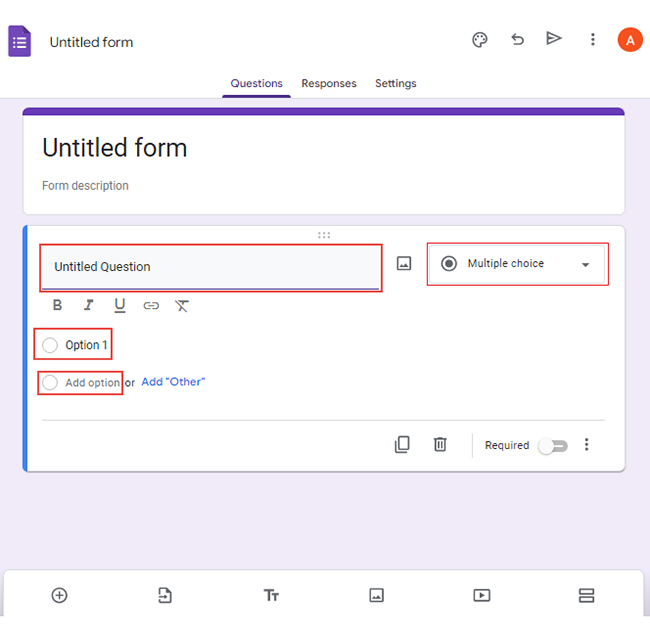
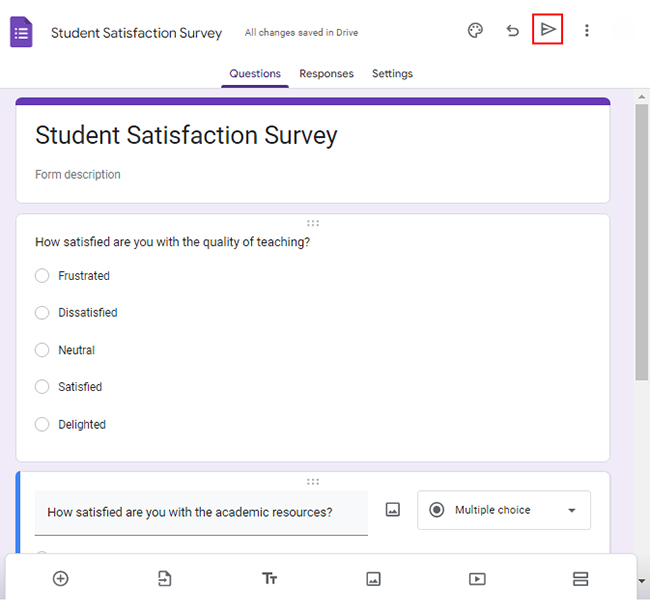
Google Forms is a free tool that you can use to create different types of questionnaires for survey analysis.

Here’s a step-by-step guide on how to create a questionnaire using Google Forms:

  • Go to Google Forms and sign in with your Google account.
  • Click the “Blank” button to create a new form.
blank button
  • Give your form a title and description.
  • Choose the type of survey you want to add, such as multiple-choice, checkbox, or short answer.
  • To add options, write Option 1: for more options, click “Add option” to write.
Add option
  • Let’s use the student satisfaction survey questions below as our example.
  • How satisfied are you with the quality of teaching?
  • How satisfied are you with the academic resources?
  • How satisfied are you with the administrative services?
  • How satisfied are you with the availability of extracurricular activities?
  • Respondents are to answer each question using the response scale below.
    • Frustrated
    • Dissatisfied
    • Neutral
    • Satisfied
    • Delighted
  • Click the share button to send your target audience a link to the form.
send your target audience a link
  • Once you have collected enough responses, click the three dots next to “Link to Sheets”.
Link to Sheets
  • This will open a dropdown menu from where you can download the responses as a CSV file.
download the responses
  • Click the file in your download folder to open it in Excel.

Evaluating a Questionnaire in Excel: Step-by-Step

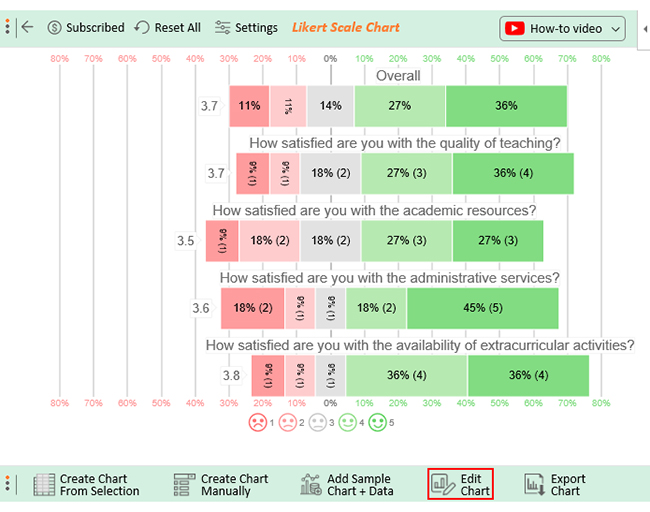
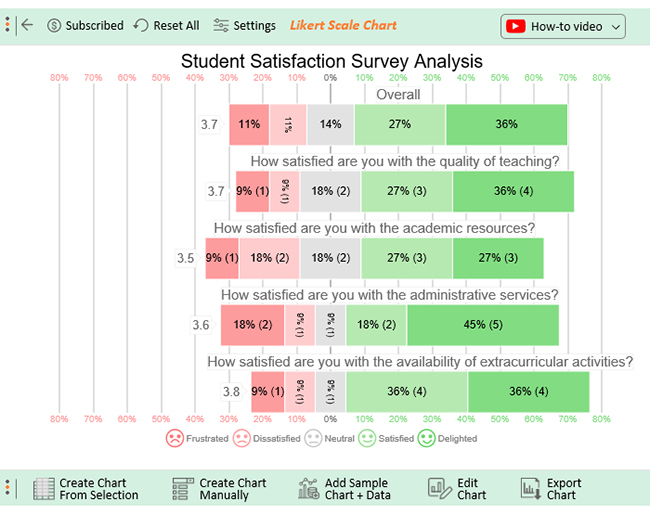
Data visualization in Excel will help you glean insights into the level of student contentment.

Excel organizes the data solely in a tabular format. This makes data analysis quite challenging.

Worry less.

ChartExpo provides a solution for overcoming this impasse.

What is ChartExpo?

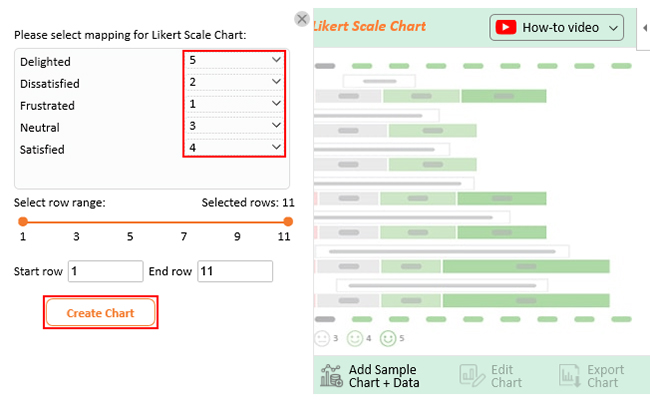
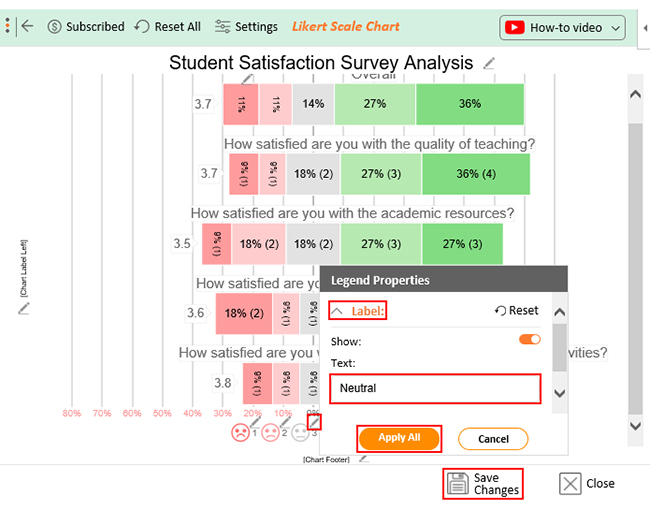
ChartExpo is an Excel add-in that enables the creation of insightful data visualizations. These visualizations facilitate effortless gleaning of insights from your data.

Why use ChartExpo?

Benefits of Using ChartExpo

  • ChartExpo’s intuitive UI enables the creation of meaningful visualizations without coding expertise. This makes ChartExpo ideal for both novice and experienced users.
  • Customization options in ChartExpo let you put your spin on the visualizations. You can change the layout, fonts, and data labels better to reflect your business’s aesthetic or taste.
  • ChartExpo is an affordable data visualization tool. The subscription plan is reasonably priced. It has a $10 monthly plan making it affordable for small businesses and individuals with a limited budget.

How to Install ChartExpo in Excel?

  1. Open your Excel application.
  2. Open the worksheet and click the “Insert” menu.
  3. You’ll see “My Apps”.
  4. In the office Add-ins window, click “Store” and search for ChartExpo on my Apps Store.
  5. Click the “Add” button to install ChartExpo in your Excel.

ChartExpo charts and graphs are available both in Google Sheets and Microsoft Excel. Please use the following CTA’s to install the tool of your choice and create beautiful visualizations in a few clicks in your favorite tool.

Example

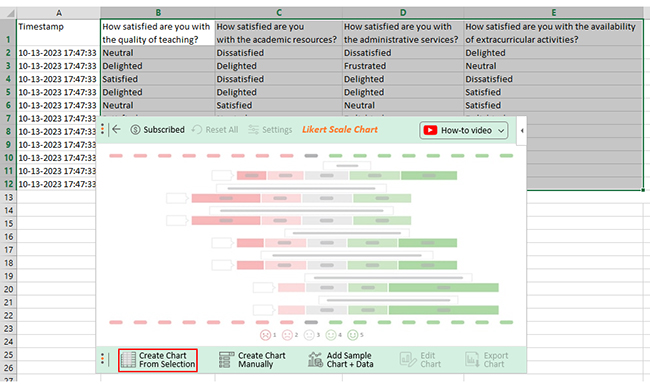
Let’s say you have collected the response data below.

Timestamp How satisfied are you with
the quality of teaching?
How satisfied are you
with the academic resources?
How satisfied are you with
the administrative services?
How satisfied are you with the availability
of extracurricular activities?
10-13-2023 17:47:33 Neutral Dissatisfied Dissatisfied Delighted
10-13-2023 17:47:33 Delighted Delighted Frustrated Neutral
10-13-2023 17:47:33 Satisfied Dissatisfied Delighted Dissatisfied
10-13-2023 17:47:33 Delighted Delighted Delighted Satisfied
10-13-2023 17:47:33 Neutral Satisfied Neutral Satisfied
10-13-2023 17:47:33 Satisfied Neutral Delighted Delighted
10-13-2023 17:47:33 Delighted Frustrated Delighted Frustrated
10-13-2023 17:47:33 Dissatisfied Delighted Delighted Satisfied
10-13-2023 17:47:33 Frustrated Neutral Satisfied Delighted
10-13-2023 17:47:33 Satisfied Satisfied Satisfied Delighted
10-13-2023 17:47:33 Delighted Satisfied Frustrated Satisfied
  • To get started with ChartExpo, install ChartExpo in Excel.
  • Now Click on My Apps from the INSERT menu.
insert chartexpo in excel
  • Choose ChartExpofrom My Apps, then click Insert.
open chartexpo in excel
  • Once ChartExpo is loaded. Click on “Likert Scale Chart” from the list of charts.
search likert scale chart in excel
  • Click the “Create Chart From Selection” button after selecting the data from the sheet, as shown.
create likert scale chart in excel
  • When you click on Create Chart From Selection manually mapped responses with numbers. The Likert scale has this arrangement:
    • Frustrated = 1
    • Dissatisfied = 2
    • Neutral = 3
    • Satisfied = 4
    • Delighted = 5
  • Once all set click on Create Chart.
make likert scale chart in excel
  • The Likert Scale Chart will look as follows.
edit likert scale chart in excel
  • If you want to have the title of the chart, click on Edit Chart, as shown in the above image.
  • To change the title of the chart, click on the pencil icon that is available very next to Chart Header.
  • It will open the properties dialog. Under the Text section, you can add a heading in Line 1 enable the Show Give the appropriate title of your chart, and click on the Apply button.
settings likert scale chart in excel
  • Let’s say you want to add text responses instead of numbers against every emoji.
  • Click on the pencil icon next to the respective emoji, expand the “Label” properties, and write the required text. After that click on the “Apply All” button.
  • For saving changes click on Save Changes. This will persist the changes.
save likert scale chart in excel
  • Your final chart will look like the as below.
likert scale chart in excel

Insights

  • 36% of the students expressed delight in the quality of teaching.
  • 27% were satisfied with the quality of teaching. 18% were dissatisfied, 9% were frustrated, and 18% were neutral.
  • 54% were satisfied with the academic resources, 18% were dissatisfied and 9% were frustrated.
  • 45% were delighted with the administrative services, while 18% expressed frustration.
  • 72% of the students were gratified with the extracurricular activities, while 18% were unhappy with them.
  • Overall;
  • 63% of students are either happy or satisfied with their school. 36% report being delighted, and 27% indicate contentment.
  • 22% reported being unhappy with school, with 11% expressing frustration and 11% expressing dissatisfaction.
  • The remaining 14% of students gave a neutral response.

How to Create a Questionnaire: Best Practices

To create an effective questionnaire, follow these practices:

  • Keep It Simple

Make sure your questionnaire is simple to read and complete. Ask concise, direct questions. Avoid technical jargon and use plain and brief language.

  • Use Open-Ended and Closed-Ended Questions

Open-ended questions allow respondents to provide detailed feedback. Closed-ended questions provide options for them to choose from. Use a mix of both types of questions to gather both qualitative and quantitative data.

  • Use Logical Order

Organize your questions in a logical order. Start with easy questions and gradually move to more complex questions. Group similar questions together to make it easier for respondents to answer.

  • Pilot Test Your Questionnaire

Before sending out your questionnaire, test it with a small group of respondents. This will help you identify any questions or questionnaire format issues. Consequently, use their feedback to make necessary changes before sending it to a larger group.

  • Ensure Anonymity

Make sure your survey is anonymous to guarantee truthful and accurate results. This motivates respondents to give sincere responses.

How to Make a Questionnaire – FAQs

How do you construct a questionnaire?

Developing a questionnaire takes these steps:

  1. Determine the goals of the research.
  2. Determine the question format.
  3. Develop and arrange the questions.
  4. Pilot test the questionnaire.
  5. Make any modifications necessary.

What is the objective of the survey questionnaire?

The specific objectives of a survey questionnaire may vary depending on the research topic. Or the type of information being collected. However, the universal goal is to gather valuable and accurate data to inform decision-making. Or advance knowledge in a particular area.

What is the best tool to create a questionnaire for survey analysis?

Google Forms is the most effective free tool for creating online survey questionnaires. It provides various advantages, including simplicity, adaptability, and real-time responses.

Wrap Up

Assessing customer views of your company is critical to determining its success.

If you want reliable responses from your questionnaire, take the time to design an effective one.

We have learned how to make a questionnaire in Google Forms.

With a well-crafted questionnaire, you can gain insight into consumer expectations and satisfaction levels with your brand. This can help you improve service delivery, create better products, and increase brand loyalty.

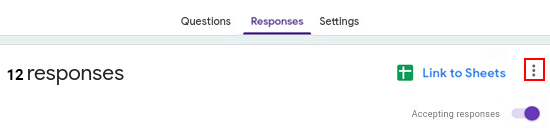
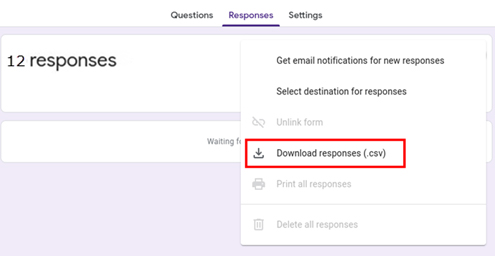
After administering the questionnaire, you can use Excel to scrutinize the results.

Intuitively, you probably want to make a graph upon seeing a data table in Excel. This, however, is not feasible.

Fortunately, you can use ChartExpo.

Why ChartExpo?

It allows you to create visualizations effortlessly. Consequently, you can glean insights from the data with ease.

How much did you enjoy this article?

PBIAd1
Start Free Trial!
125389

Related articles

next previous
Surveys16 min read

Survey Data Collection: Definition, Methods and Analysis

Find the best methods of Survey data collection. Elevate your research game with practical tips for gathering, analyzing, and leveraging valuable information.

Surveys11 min read

5-Point Performance Rating Scale With Examples: Quick Guide

Discover how the 5-Point Performance Rating Scale helps organizations evaluate employee performance with clarity, consistency, and fairness across teams.

Surveys11 min read

How to Interpret 4-Point Likert Scale Results?

Click to learn How to Create, Gather and Analyze Data Using the 4-Point Likert Scale? A complete guide with definition, examples, uses, and applications.

Surveys32 min read

Net Promoter Survey: Lies, Legends, and Lazy Thinking

Net Promoter Survey risks hiding customer truths behind one-size-fits-all scores. Want feedback that drives decisions? Get started with smarter questions.

Surveys18 min read

50 Impactful Business Survey Questions for Targeted Insights

What is a business survey? How to use the right business survey questions to help get your customers' and prospects' insights and behaviors in Excel?

ChartExpo logo

Turn Data into Visual
Stories

CHARTEXPO

  • Home
  • Gallery
  • Videos
  • Services
  • Pricing
  • Contact us
  • FAQs
  • Privacy policy
  • Terms of Service
  • Sitemap

TOOLS

  • ChartExpo for Google Sheets
  • ChartExpo for Microsoft Excel
  • Power BI Custom Visuals by ChartExpo
  • Word Cloud

CATEGORIES

  • Bar Charts
  • Circle Graphs
  • Column Charts
  • Combo Charts
  • Comparison Charts
  • Line Graphs
  • PPC Charts
  • Sentiment Analysis Charts
  • Survey Charts

TOP CHARTS

  • Sankey Diagram
  • Likert Scale Chart
  • Comparison Bar Chart
  • Pareto Chart
  • Funnel Chart
  • Gauge Chart
  • Radar Chart
  • Radial Bar Chart
  • Sunburst Chart
  • see more
  • Scatter Plot Chart
  • CSAT Survey Bar Chart
  • CSAT Survey Chart
  • Dot Plot Chart
  • Double Bar Graph
  • Matrix Chart
  • Multi Axis Line Chart
  • Overlapping Bar Chart
  • Control Chart
  • Slope Chart
  • Clustered Bar Chart
  • Clustered Column Chart
  • Box and Whisker Plot
  • Tornado Chart
  • Waterfall Chart
  • Word Cloud
  • see less

RESOURCES

  • Blog
  • Resources
  • YouTube
SIGN UP FOR UPDATES

We wouldn't dream of spamming you or selling your info.

© 2025 ChartExpo, all rights reserved.