• Home
  • Tools dropdown img
    • Spreadsheet Charts

      • ChartExpo for Google Sheets
      • ChartExpo for Microsoft Excel
    • Power BI Charts

      • Power BI Custom Visuals by ChartExpo
    • Word Cloud

  • Charts dropdown img
    • Chart Category

      • Bar Charts
      • Circle Graphs
      • Column Charts
      • Combo Charts
      • Comparison Charts
      • Line Graphs
      • PPC Charts
      • Sentiment Analysis Charts
      • Survey Charts
    • Chart Type

      • Box and Whisker Plot
      • Clustered Bar Chart
      • Clustered Column Chart
      • Comparison Bar Chart
      • Control Chart
      • CSAT Survey Bar Chart
      • CSAT Survey Chart
      • Dot Plot Chart
      • Double Bar Graph
      • Funnel Chart
      • Gauge Chart
      • Likert Scale Chart
      • Matrix Chart
      • Multi Axis Line Chart
      • Overlapping Bar Chart
      • Pareto Chart
      • Radar Chart
      • Radial Bar Chart
      • Sankey Diagram
      • Scatter Plot Chart
      • Slope Chart
      • Sunburst Chart
      • Tornado Chart
      • Waterfall Chart
      • Word Cloud
    • Google Sheets
      Microsoft Excel
  • Services
  • Pricing
  • Contact us
  • Blog
  • Support dropdown img
      • Gallery
      • Videos
      • Contact us
      • FAQs
      • Resources
    • Please feel free to contact us

      atsupport@chartexpo.com

Categories
All Data Visualizations Data Analytics Surveys
Add-ons/
  • Google Sheets
  • Microsoft Excel
  • Power BI
All Data Visualizations Data Analytics Surveys
Add-ons
  • Google Sheets
  • Microsoft Excel
  • Power BI

We use cookies

This website uses cookies to provide better user experience and user's session management.
By continuing visiting this website you consent the use of these cookies.

Ok

ChartExpo Survey


Home > Blog > Microsoft Excel

Quantitative and Qualitative Data: Differences & Examples

In this dynamic age of data, making sense of numbers isn’t just a hobby; it’s an art.

Excel, often deemed a number-crunching tool, transforms into a canvas for creativity. Numbers take shape as compelling graphs, charts, and diagrams. Quantitative data finds life in bar graphs that compare, line graphs that trend, and pie charts that dissect.

Quantitative And Qualitative Data Examples

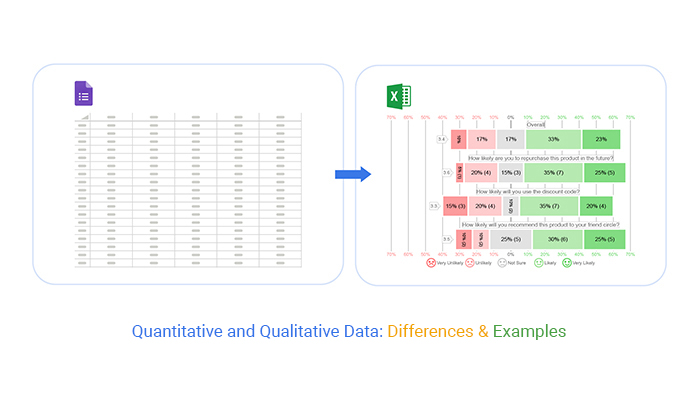
But it’s not just about numbers Excel’s prowess extends to qualitative realms.

Imagine portraying survey results through scatter plots, mapping sentiments with heatmaps, and even turning words into word clouds. This fusion of numbers and narratives empowers you to glean insights effortlessly.

Join us to unlock Excel’s potential as we illuminate the synergy between data, design, and discovery. We’ll navigate through real-world examples, demonstrating how Excel transforms columns and rows into captivating visuals.

Brace yourself. Excel is no longer just a number-crunching tool it’s a gateway to a world of limitless creativity. Whether you’re a novice or connoisseur, these examples will spark your imagination and elevate your data storytelling.

But first!

Table of Content:

  1. Understanding Quantitative And Qualitative Data
  2. What is the Difference between Qualitative and Quantitative Data?
  3. How to Conduct Quantitative Survey Research?
  4. How to Analyze Quantitative Research Survey Data in Excel?
  5. Wrap Up

Understanding Quantitative And Qualitative Data

What is Qualitative Data?

Definition: Qualitative data is non-numeric information that describes qualities, characteristics, and attributes. It focuses on capturing subjective insights, emotions, opinions, and behaviors. This data type is often gathered through interviews, open-ended surveys, observations, and content analysis.

Unlike quantitative data, qualitative data provides a deeper understanding of the context and nuances surrounding a topic.

What is Quantitative Data?

Definition: Quantitative data consists of numerical values and measurements you can quantify and analyze mathematically. It deals with quantities, amounts, and objective observations. This data type is collected through design surveys, experiments, and sensors. It enables statistical analysis, making it possible to identify patterns, relationships, and trends.

Unlike qualitative data, which focuses on qualities, quantitative data provides a basis for statistical inference and precise comparisons.

What is the Difference between Qualitative and Quantitative Data?

One crunches numbers like a mathematician, while the other dances with language like a poet. So, what’s the difference between these two data divas?

Let’s find out.

Nature and Purpose:

  • Qualitative data: Qualitative data is descriptive and deals with qualities, characteristics, and subjective information. It aims to capture nuances, emotions, behaviors, and the context surrounding a topic. Consequently, it helps explore complex phenomena and gain a deeper understanding of human experiences. Descriptive Analytics can further enhance the analysis of qualitative data by systematically summarizing and interpreting this information, providing a clearer view of the patterns and trends within the data.
  • Quantitative data: Quantitative data is numerical and measurable, focusing on quantities, amounts, and objective observations. It aims to quantify relationships, patterns, and trends through statistical analysis. Consequently, make objective comparisons and draw conclusions based on data-driven evidence.

Data Collection:

  • Qualitative data: Qualitative data is collected through interviews, focus groups, open-ended surveys, observations, and content analysis. Researchers gather textual or visual information to explore opinions, perceptions, and narratives.
  • Quantitative data: Quantitative data is collected through structured surveys, experiments, and measurements. It involves gathering numerical data points to quantify variables of interest.

Data Representation:

  • Qualitative data: Qualitative data is typically presented in text, quotes, narratives, or visual representations. It can include excerpts from interviews, observations, or thematic analysis.
  • Quantitative data: Quantitative data is represented using charts, graphs, tables, and statistical measures such as means, standard deviations, and percentages. It enables clear and concise visualization of numerical relationships.

Analysis:

  • Qualitative data: Qualitative data analysis involves identifying themes, patterns, and meanings within the data. Researchers use techniques like content analysis, coding, and thematic analysis to uncover insights and draw conclusions.
  • Quantitative data: Quantitative data analysis involves statistical techniques to identify correlations, distributions, and trends. Researchers use tools like regression analysis, t-tests, and ANOVA to make numerical inferences.

Generalizability:

  • Qualitative data: Qualitative data provides in-depth insights into specific cases or contexts. It is often exploratory and doesn’t prioritize generalizability to larger populations.
  • Quantitative data: Quantitative data aims for generalizability by collecting data from a representative sample. Then, using statistical methods to conclude the broader population.

Subjectivity vs. Objectivity:

  • Qualitative data: Qualitative data involves a degree of subjectivity, as the researcher’s perspective can influence interpretations and analysis. It values diverse viewpoints and acknowledges the role of the researcher’s biases.
  • Quantitative data: Quantitative data is more objective, relying on standardized measurements and statistical analysis. It aims to minimize subjectivity and personal biases.

How to Conduct Quantitative Survey Research?

Let’s use an example to learn how to conduct quantitative survey research.

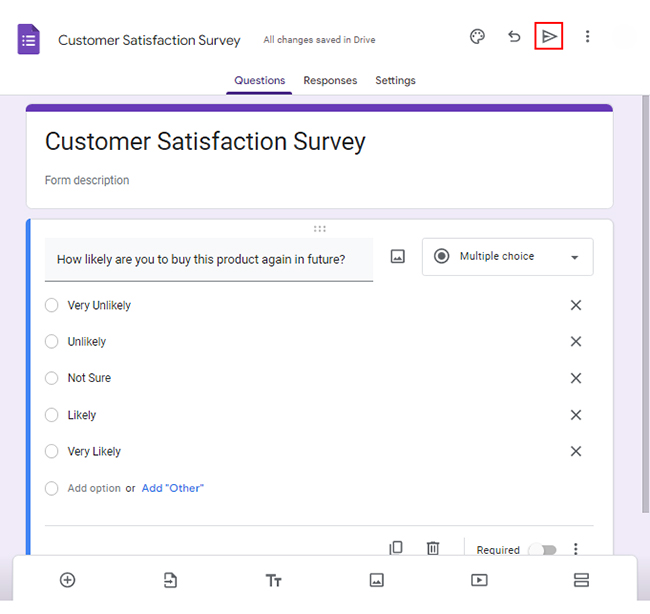
Assume you want to do a customer satisfaction survey with the following questions.

  • How likely are you to repurchase this product in the future?
  • How likely will you use the discount code?
  • What is the likelihood that you would suggest this product to your circle of friends?

You want your respondents to provide an answer to each question using the response scale below.

  1. Very Unlikely
  2. Unlikely
  3. Not Sure
  4. Likely
  5. Very Likely

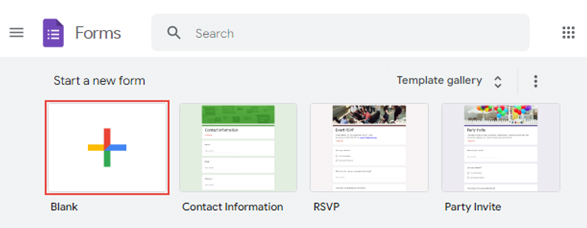
To conduct an effective survey, use Google Forms.

Why Google Forms?

  • It is accessible and user-friendly. Anyone can access it through a mobile or web browser without special software.
  • It offers the advantage of instant results, allowing you to view responses as they come in.
  • Google Forms’ convenience enables you to create surveys quickly and easily.

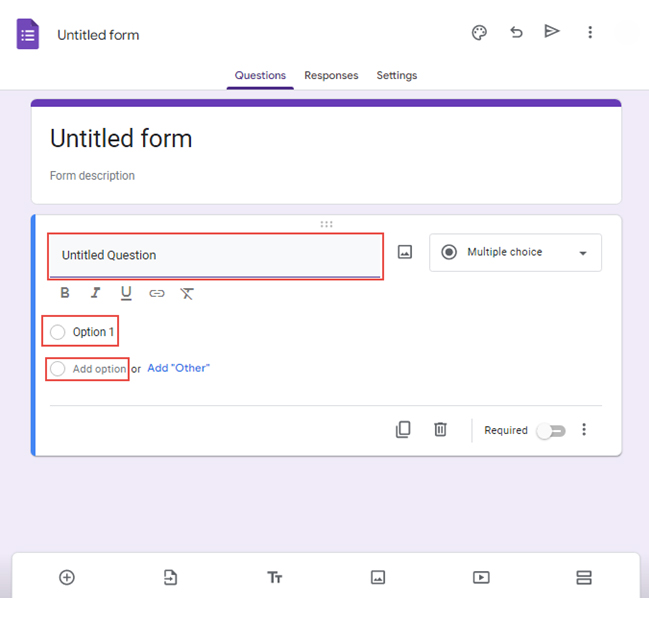
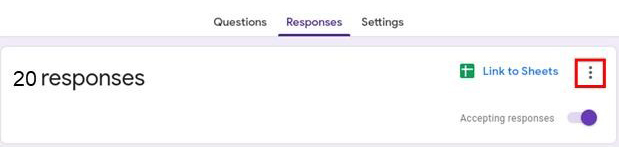
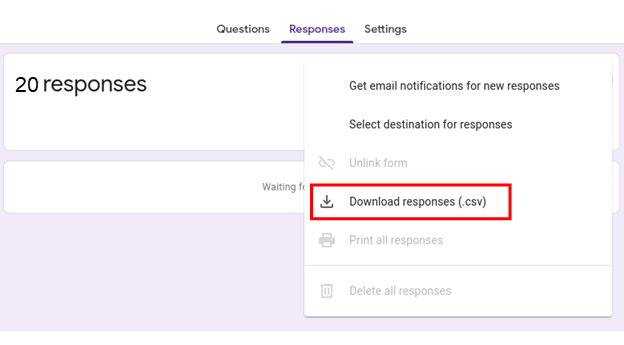
Follow the steps below to create your survey using Google Forms.

  • Open Google Forms and sign in with your Google account.
  • Click the “Blank” button to create a new form.
survey in google forms 1 411
  • Give your form a title and description that reflects your brand or purpose.
  • Choose the type of question you want to use, such as multiple-choice, checkbox, or short answer.
  • Type your question in the “Untitled Question” section for multiple-choice questions. Then write “Option 1” and choose “Add option” for more options.
survey in google forms 2 411
  • You can customize the look and feel of your survey to match your brand or theme.
  • Preview the form before sharing it with your target audience.
  • Click the share button to distribute it to your target audience.
survey in google forms 3 411
  • Once you collect enough responses, click the “Link to Sheets” button.
survey in google forms 4 411
  • Download the responses as a .csv file from the drop-down menu.
survey in google forms 5 411

How to Analyze Quantitative Research Survey Data in Excel?

Unlocking the insights hidden within quantitative research survey data is vital for any data-driven organization. On the flip side, Excel often falls short when it comes to effective data visualization.

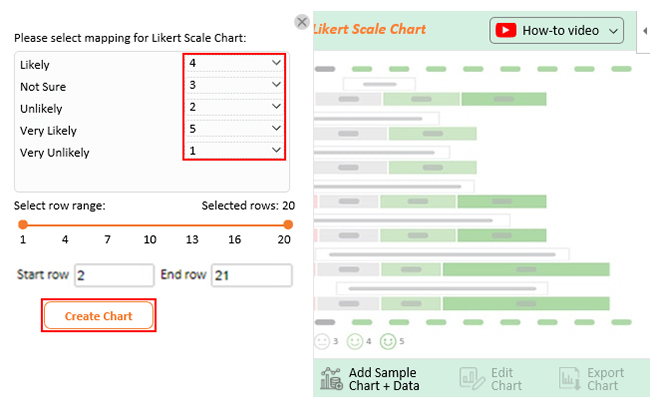
But fear not. ChartExpo is here to bridge that gap and revolutionize how you analyze and present your survey data.

With ChartExpo, you can transform your Excel spreadsheets into data visualizations that bring your data to life. Whether you need simple bar graphs or more advanced types of charts, you no longer have to be a technical expert or hire a graphic designer to create engaging visuals. ChartExpo empowers you to become a data storytelling pro with just a few clicks.

Benefits of Using ChartExpo

  • ChartExpo offers a wide range of visualizations to cater to your data’s every whim. This turbocharges your data analysis game, making it the ultimate power move in presentations.
  • With ChartExpo’s user-friendly interface, you’ll create eye-catching visualizations faster than you can say “data wizard.” No coding expertise is required.
  • Unleash your inner Picasso with ChartExpo’s customization options. From vibrant colors to stylish fonts, you have the artistic freedom to make your visuals pop.
  • Get your money’s worth with ChartExpo’s unbeatable offer. Enjoy a 7-day trial that won’t cost you a penny. Then subscribe to a monthly plan as affordable as your morning coffee.

How to Install ChartExpo in Excel?

  1. Open your Excel application.
  2. Open the worksheet and click the “Insert” menu.
  3. You’ll see the “My Apps” option.
  4. In the office Add-ins window, click “Store” and search for ChartExpo on my Apps Store.
  5. Click the “Add” button to install ChartExpo in your Excel.

ChartExpo charts are available both in Google Sheets and Microsoft Excel. Please use the following CTA’s to install the tool of your choice and create beautiful visualizations in a few clicks in your favorite tool.

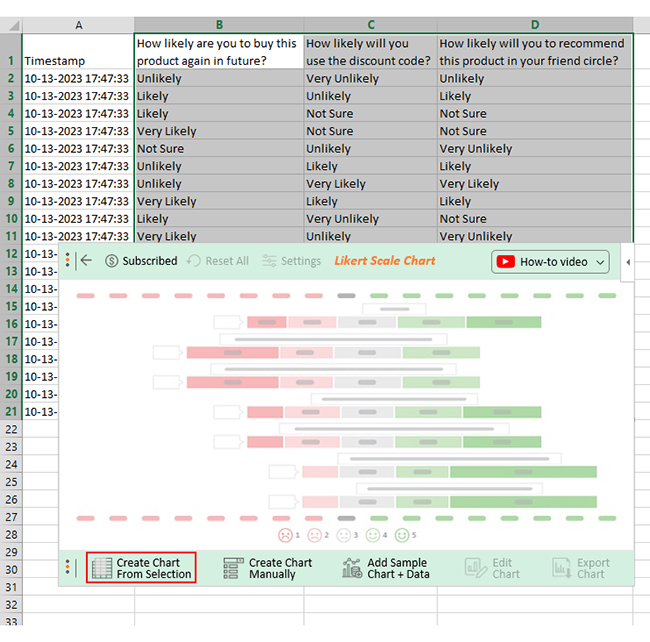
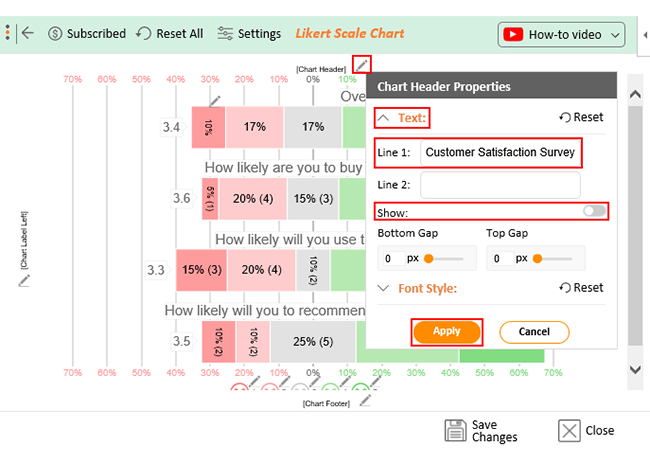
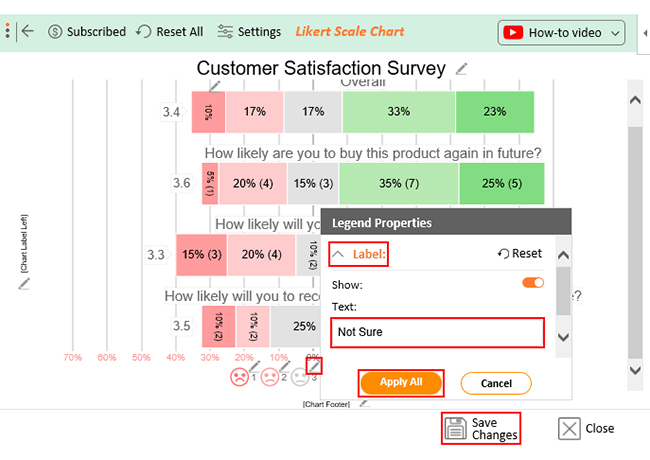
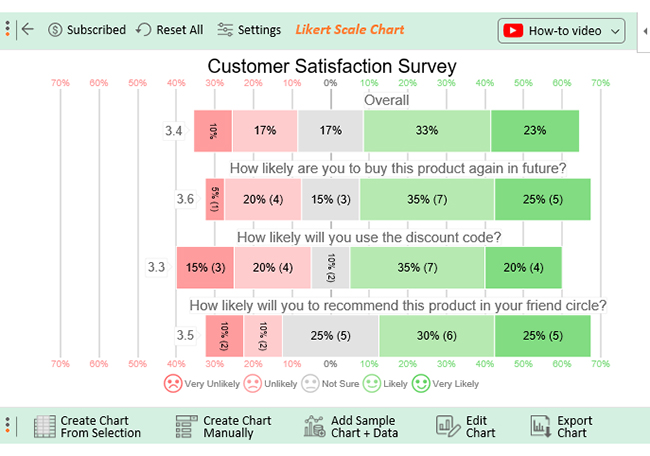
Let’s say your survey yields the data table below.

Timestamp How likely are you to repurchase this product in the future? How likely will you use the discount code? How likely will you recommend this product to your friend circle?
10-13-2023 17:47:33 Unlikely Very Unlikely Unlikely
10-13-2023 17:47:33 Likely Unlikely Likely
10-13-2023 17:47:33 Likely Not Sure Not Sure
10-13-2023 17:47:33 Very Likely Not Sure Not Sure
10-13-2023 17:47:33 Not Sure Unlikely Very Unlikely
10-13-2023 17:47:33 Unlikely Likely Likely
10-13-2023 17:47:33 Unlikely Very Likely Very Likely
10-13-2023 17:47:33 Very Likely Likely Likely
10-13-2023 17:47:33 Likely Very Unlikely Not Sure
10-13-2023 17:47:33 Very Likely Unlikely Very Unlikely
10-13-2023 17:47:33 Likely Likely Very Likely
10-13-2023 17:47:34 Not Sure Likely Likely
10-13-2023 17:47:35 Very Likely Likely Very Likely
10-13-2023 17:47:36 Likely Unlikely Likely
10-13-2023 17:47:37 Unlikely Very Likely Likely
10-13-2023 17:47:38 Likely Very Unlikely Not Sure
10-13-2023 17:47:39 Not Sure Very Likely Unlikely
10-13-2023 17:47:40 Very Unlikely Likely Very Likely
10-13-2023 17:47:41 Very Likely Very Likely Very Likely
10-13-2023 17:47:42 Likely Likely Not Sure

This table contains example data. Expect many responses and questions in real life.

  • To get started with ChartExpo, install ChartExpo in Excel.
  • Now Click on My Apps from the INSERT menu.
insert chartexpo in excel
  • Choose ChartExpo from My Apps, then click Insert.
open chartexpo in excel
  • Once it loads, choose the “Likert Scale Chart” from the charts list.
search likert scale chart in excel
  • Click the “Create Chart From Selection” button after selecting the data from the sheet, as shown.
Create Chart From Selection ce411
  • When you click the “Create Chart From Selection” button, you have to map responses with numbers manually. The Likert scale has this arrangement:
    • Very Unlikely = 1
    • Unlikely = 2
    • Not Sure = 3
    • Likely = 4
    • Very Likely = 5
  • Once all is set, click the “Create Chart” button.
Map Likert Responses to Numbers ce411
  • ChartExpo will generate the visualization below for you.
Quantitative And Qualitative Data Examples Template
  • If you want to have the chart’s title, click Edit Chart, as shown in the above image.
  • Click the pencil icon next to the Chart Header to change the title.
  • It will open the properties dialog. Under the Text section, you can add a heading in Line 1 and enable Show.
  • Give the appropriate title of your chart and click the Apply button.
Apply Title on Chart ce411
  • Let’s say you want to add text responses instead of numbers against every emoji.
  • Click the pencil icon next to the respective emoji. Expand the “Label” properties and write the required text. Then click the “Apply All” button.
  • Click the “Save Changes” button to persist the changes.
Apply Label on Chart ce411
  • Your final chart will appear below.
Final Quantitative And Qualitative Data Examples

Insights

  • 60% of customers express intention to repurchase the product in the future. 25% say they would not repurchase it, and 15% are neutral.
  • Regarding discount codes, 55% are willing to utilize them, and 35% state they would not take advantage of them.
  • 55% express intention to recommend the product to their friends, while 20% say they would not.
  • Overall, 56% of respondents are satisfied with both the product and the store, whereas 27% express dissatisfaction.

FAQs

What is quantitative and qualitative data?

Quantitative data comprises numerical information that can be measured and analyzed mathematically. On the other hand, qualitative data encompasses descriptive, non-numeric insights that capture qualities, emotions, and subjective aspects.

What is the difference between qualitative and quantitative research with examples?

Qualitative research seeks to understand complex phenomena by exploring subjective insights. For example, conducting interviews to study people’s motivations. Conversely, quantitative research aims to quantify relationships using numerical data. For instance, analyzing survey responses to determine correlations between variables.

Wrap Up

Remember, data is more than just digits; it’s the heartbeat of decision-making.

We’ve witnessed how Excel transcends from a mere spreadsheet tool to a canvas of insight and revelation. It offers a wide range of charting and graphing options allowing you to present data clearly and concisely.

Whether you are dealing with numbers or categories, Excel provides the flexibility to create visuals that enhance understanding. From basic bar graphs to advanced charts, it has options to suit different data types and analysis needs.

While numbers speak volumes, emotions, and nuances are equally vital. Excel’s canvas and ChartExpo’s magic empower you to craft data into compelling tales.

With quantitative data, ChartExpo’s visual prowess clarifies intricate relationships, illuminating trends hidden amidst numbers. As for qualitative data, Excel’s versatility, paired with ChartExpo’s finesse, turns anecdotes and sentiments into visual masterpieces. Consequently revealing the heart of human experiences.

Keep visualizing, keep discovering, and keep Excel-ing.

Try ChartExpo for free and experience the power of interactive charts firsthand.

How much did you enjoy this article?

ExcelAd2
Start Free Trial!
128850

Related articles

next previous
Microsoft Excel8 min read

Excel Task Tracker Template for Smarter Task Insights

Task tracker template in Excel organizes tasks, tracks deadlines, and boosts efficiency. Learn its benefits, and explore expert tips to simplify task management.

Microsoft Excel10 min read

Invoice Tracker Template in Excel for Better Insights

An invoice tracker Excel template helps track invoices, due dates, and payments. Learn how to use this template for better financial management.

Microsoft Excel12 min read

Key Performance Indicators in Healthcare for Better Insights

Key Performance Indicators in healthcare track patient care and efficiency. Learn about these KPIs, top examples, and how to use them to improve outcomes.

Microsoft Excel10 min read

BMI Calculation Formula in Excel for Better Fitness Insights

The BMI calculation formula in Excel helps track and analyze body mass index. Explore step-by-step instructions and tips to simplify BMI tracking in Excel.

Microsoft Excel29 min read

How to Create a Tornado Chart in Excel? A Complete Guide

Click to learn how to plot a Tornado Chart in Excel using easy-to-follow steps. Also, we’ll address the following question: what is a Tornado Diagram?

ChartExpo logo

Turn Data into Visual
Stories

CHARTEXPO

  • Home
  • Gallery
  • Videos
  • Services
  • Pricing
  • Contact us
  • FAQs
  • Privacy policy
  • Terms of Service
  • Sitemap

TOOLS

  • ChartExpo for Google Sheets
  • ChartExpo for Microsoft Excel
  • Power BI Custom Visuals by ChartExpo
  • Word Cloud

CATEGORIES

  • Bar Charts
  • Circle Graphs
  • Column Charts
  • Combo Charts
  • Comparison Charts
  • Line Graphs
  • PPC Charts
  • Sentiment Analysis Charts
  • Survey Charts

TOP CHARTS

  • Sankey Diagram
  • Likert Scale Chart
  • Comparison Bar Chart
  • Pareto Chart
  • Funnel Chart
  • Gauge Chart
  • Radar Chart
  • Radial Bar Chart
  • Sunburst Chart
  • see more
  • Scatter Plot Chart
  • CSAT Survey Bar Chart
  • CSAT Survey Chart
  • Dot Plot Chart
  • Double Bar Graph
  • Matrix Chart
  • Multi Axis Line Chart
  • Overlapping Bar Chart
  • Control Chart
  • Slope Chart
  • Clustered Bar Chart
  • Clustered Column Chart
  • Box and Whisker Plot
  • Tornado Chart
  • Waterfall Chart
  • Word Cloud
  • see less

RESOURCES

  • Blog
  • Resources
  • YouTube
SIGN UP FOR UPDATES

We wouldn't dream of spamming you or selling your info.

© 2025 ChartExpo, all rights reserved.