Categories
Every organization runs on the output of its people, yet few leaders have a reliable method to gauge that output with confidence.
Measuring Workforce Productivity gives businesses a structured way to connect employee effort with real results, revealing how well time, skills, and resources translate into value.
Beyond raw output numbers, productivity spans work quality, operational efficiency, and employee engagement.
Organizations that track these dimensions consistently can spot bottlenecks before they escalate, build more informed strategies, and foster a culture where performance improvement is continuous rather than reactive.
This guide covers the core methods, formulas, and metrics your organization needs.
Definition: Measuring Workforce Productivity is the practice of quantifying how effectively a workforce converts its combined time, capabilities, and available resources into tangible business output.
Organizations rely on this practice to establish clear performance baselines, expose inefficiencies, and align individual contributions with broader strategic objectives.
Beyond simple output counts, the practice connects workforce productivity metrics to engagement levels, training investments, and operational workflows.
When leaders understand what drives or limits employee output, they can allocate resources with greater precision, develop targeted development plans, and sustain momentum toward long-term goals across every department.
Consistent visibility into workforce output is one of the core benefits of measuring workforce productivity: it gives leadership a factual foundation for operational decisions rather than relying on assumptions. The data shows, in concrete terms, how effectively each employee drives value for the organization.
Core reasons it matters:
Selecting the right approach matters because measuring workforce productivity accurately requires matching the method to the nature of the work and the organization’s goals. The right method paired with the right context produces the most actionable workforce productivity metrics.
Widely used measurement methods include:
Standard formulas are central to measuring workforce productivity because they convert raw performance data into numeric values that support direct comparison across teams, time periods, and business units. Each formula produces a clear indicator that feeds into data-driven decision-making across the organization.
Key formulas used in practice:
A structured sequence is the most reliable approach when measuring workforce productivity. Each step builds on the previous one to generate results that actually inform decisions.
Clearly define business objectives and select team productivity metrics that match organizational goals.
Gather accurate data from reports, time tracking systems, and workplace culture surveys to support proper productivity measurement.
Use the correct productivity formula, such as output per employee or revenue per workforce, to calculate results.
Compare current productivity results with past performance, targets, or industry standards to evaluate efficiency.
Review the results along with employee engagement survey data to identify performance gaps and improvement opportunities.
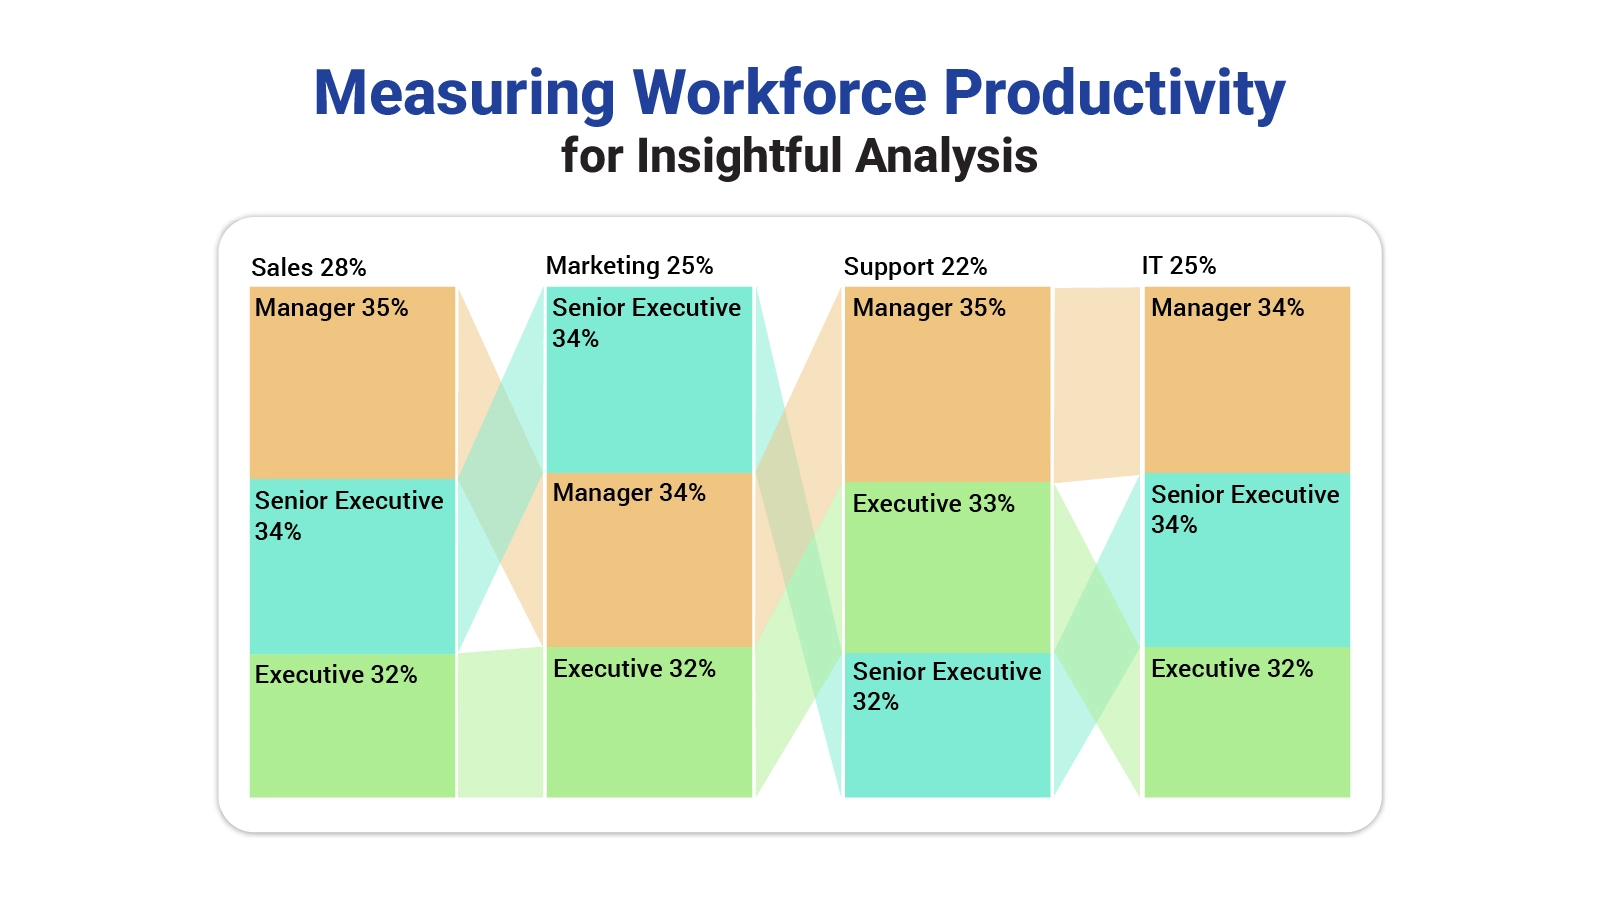
Concrete examples make measuring workforce productivity concepts easier to apply. Each scenario below illustrates a distinct way performance data can be visualized and interpreted to support better decisions.
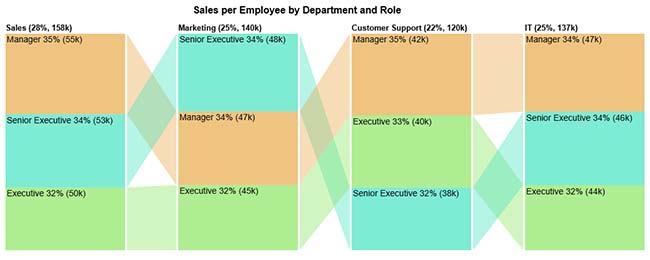
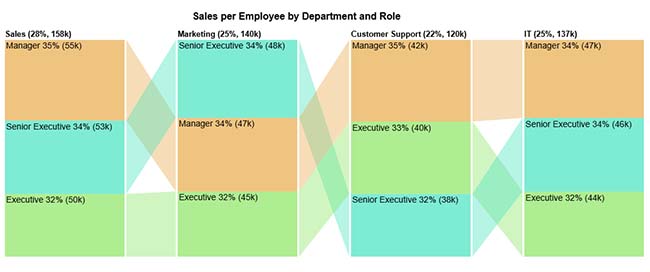
The sales per employee breakdown by department and role reveals how revenue output varies across executive, senior executive, and manager levels, making performance differences between groups directly comparable.
Example Insight: Pinpoints the roles and departments that drive the strongest sales output per person.
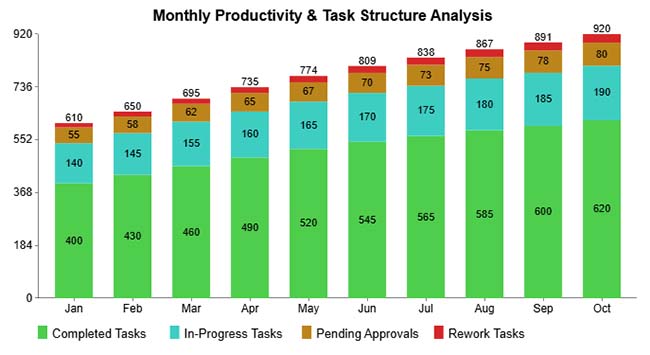
The monthly productivity and task structure breakdown tracks task status across completed, in-progress, pending, and rework categories month by month, surfacing shifts in team throughput over time.
Example Insight: Reveals workflow bottlenecks and highlights months where productivity improved or declined.
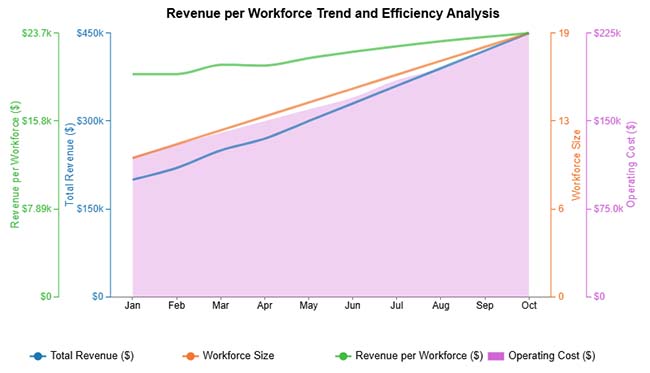
The revenue per workforce trend analysis tracks how revenue, headcount, and total costs move together over time, allowing leaders to monitor whether workforce expansion is generating proportional revenue gains.
Example Insight: Confirms whether workforce growth is translating into higher revenue efficiency per employee.
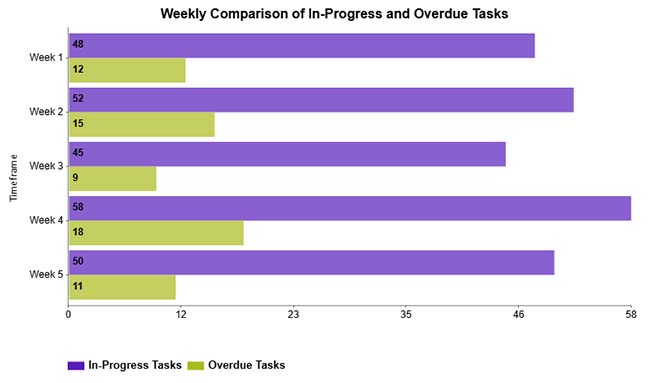
The weekly in-progress and overdue task comparison places active work volume alongside delayed items to expose which weeks experienced the most significant execution shortfalls.
Example Insight: Identifies high-delay periods and supports targeted action to reduce overdue task accumulation.
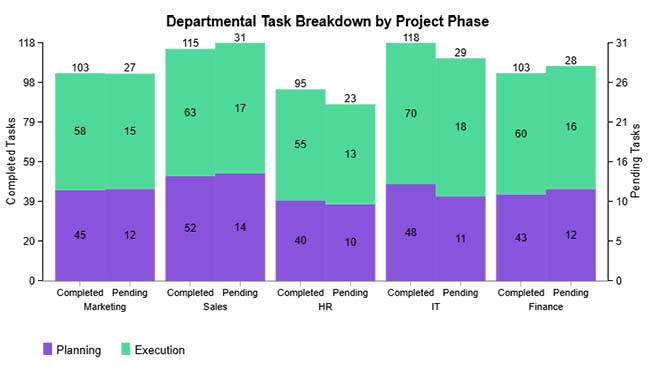
The task planning and execution breakdown compares completed tasks against pending ones across multiple periods, illustrating the gap between what teams planned to do and what they actually delivered.
Example Insight: Highlights execution gaps, supports better scheduling, and guides adjustments to task management practices.
Excel provides a versatile platform for measuring workforce productivity metrics and turning raw performance numbers into clear visual insights. Follow these steps to perform an accurate workforce productivity analysis.
Start by arranging your dataset with clear column headers such as employee name, hours worked, sales, and total output.
Keep the format consistent so calculations work correctly, just like when preparing structured reports.
Tip: Use separate columns for employees, time, and output to make analysis easier.
Select the right productivity metrics based on your goal, such as sales per employee, output per hour, or revenue per workforce.
These metrics help measure efficiency and compare performance across teams.
Tip: Choose KPIs that directly show how employee effort affects business results.
Use formulas to calculate productivity values for each employee or team.
Example:
Sales per employee = Total sales ÷ Number of employees
If a company generates $500,000 in sales with 10 employees, productivity = $50,000 per employee.
(Image: Sales per employee chart)
Tip: Apply formulas to the whole column to calculate productivity automatically.
Compare current productivity values with past performance, targets, or industry standards.
This helps identify high-performing employees and areas where productivity needs improvement.
Tip: Use sorting, filters, or Pivot Tables to compare departments quickly.
Create charts to understand trends and performance differences more clearly.
You can use bar charts, line charts, pie charts, or dashboards to present team productivity metrics.
Tools like ChartExpo can help create advanced charts when default Excel visuals are not enough.
Tip: Visual charts make it easier for managers to understand productivity insights and make better decisions.
The business case for measuring workforce productivity becomes clear when organizations see the strategic advantages it delivers. Regular output monitoring reveals what is working, where inefficiencies hide, and how to allocate effort for maximum return.
Key benefits include:
Understanding what shapes results is essential when measuring workforce productivity because output levels are affected by a wide range of variables, both within and outside management control. Recognizing these factors is the first step toward building conditions where sustained high performance is achievable.
Key factors include:
Sustainable gains from measuring workforce productivity require more than gathering data; they depend on embedding the right habits and systems into how the organization operates every day. The practices below create the conditions for consistent, long-term improvement.
Recommended practices include:
Building productivity starts with setting precise targets, pairing them with targeted training, and backing both with consistent performance tracking. Organizations that use structured workforce productivity metrics to pinpoint specific problem areas can drive measurable gains far more efficiently than those relying on broad initiatives.
The four primary measures are output per employee, revenue per employee, task completion rate, and quality of work. Together, these methods give a well-rounded view of how effectively a workforce is operating.
Monthly or quarterly reviews strike the right balance between frequency and practicality. For organizations committed to measuring workforce productivity, regular intervals allow them to catch performance trends early, adjust plans accordingly, and make scheduling or staffing changes before productivity losses become entrenched.
Tracking employee output is not a one-time exercise but an ongoing discipline that separates organizations with real operational clarity from those guessing at performance. Measuring Workforce Productivity with the right formulas, tools, and metrics gives businesses the visibility they need to act with confidence at every level of the organization.
When productivity data informs planning, budgeting, and team development, organizations build a reinforcing cycle: better insight produces better decisions, and better decisions produce stronger results over time. Start with a clear measurement method, apply it consistently across all teams, act on what the data reveals, and the cumulative performance gains will follow across the entire workforce.
How much did you enjoy this article?


Calculate accounts receivable turnover ratio to measure credit collection speed, improve cash flow, and strengthen your financial strategy. Read on!

Change Management KPIs are the key to tracking adoption, performance, and ROI during transitions. Find out which metrics matter. Read on!

Data collection methods and techniques determine the quality of every insight you act on. Explore key approaches for gathering reliable data. Read on!