Categories
You need to stay ahead of the competition in the quick-paced business environment of today by making informed decisions. In this situation, a market intelligence report is helpful.


You can improve your decision-making thanks to its insights regarding the market, rivals, customers, and products.
Let’s say you oversee marketing for a mobile phone company. You’ve noticed a decline in sales over the past few months and are curious why.
What do you do?
Conduct market intelligence research and create a market intelligence report.
This research will provide meaningful market insights, such as consumer preferences and competitors’ strategies. These insights will help you modify your marketing approach. For instance:
Let’s face it – market research can be a snooze-fest. What if we told you that creating a market intelligence report doesn’t have to be a dreary task? In fact, with the right tools and strategies, it can be downright exhilarating.
Let me show you how.
Market intelligence constitutes gathering and evaluating data regarding a particular market. It tries to obtain knowledge of market trends, rivals, clients, and products. It facilitates informed decision-making about marketing tactics, product development, and competitive positioning.
Market intelligence plays a crucial role in risk mitigation. You can identify potential risks and take steps to mitigate them before they cause significant harm. For instance, it can help you stay up-to-date with regulations and compliance requirements changes. Thus, you can avoid potential fines and legal issues by staying on top of these changes.
Market intelligence provides businesses with a holistic view of the market. Through competitive analysis, you can comprehensively understand market trends, consumer behavior, and the competitive landscape. This is crucial for making informed decisions to set your business up for long-term success.
Market intelligence offers pertinent data on customers, markets, and competitors. This intelligence aids in creating marketing plans that can boost profits, sales, and income.
Market intelligence provides information that aids in boosting efficiency in the following ways:
Market intelligence helps retain customers and build long-term loyalty. Using data, you can tailor your products/services, marketing, and customer experience to meet customer needs. This increases customer satisfaction and reduces the risk of customer churn.
Gaining an edge over the competition requires in-depth knowledge of the market. It sheds light on developments in the market, consumer habits, and competition. Thus, you’ll be better positioned to devise strategies to set you apart from the competition and lead to sustained success.
The term “competitor intelligence” describes the gathering and examination of data regarding industry rivals and the competitive landscape. This entails examining your competitors’ offerings, pricing, marketing, and consumer feedback.
You can develop strategies to gain a competitive advantage by understanding the competition. Competitor intelligence is particularly important in industries with high competition or rapid technological change. In such industries, staying ahead of the competition is crucial for success.
Product intelligence employs data and analytics to gain insights into rival products and how they compare to yours. It involves collecting and analyzing data from various sources, including user feedback, sales follow-up statistics, and social media. Product intelligence can help you identify areas for improvement and consequently enhance your offerings to meet customer needs effectively.
Market understanding refers to your knowledge and insights into the target market. It entails examining consumer data to grasp the target market comprehensively. This information is essential for developing goods and services that satisfy customer demands. Also, it aids in the development of tactics that work in a market that is continuously changing.
Customer understanding is gaining a thorough understanding of consumer needs, interests, habits, and expectations. It entails compiling data from sources such as surveys, social media, customer support encounters, and customer feedback.
This aids in developing goods and services that align with the customers’ wants and demands. As a result, enhances the consumer experience and develops lasting connections.
Although they sound similar and are often used interchangeably, market intelligence and market research are different.
Here are the key differences between the two:
Researchers undertake market research to obtain information about a certain facet of the market. Conversely, market intelligence aims to provide a broader understanding of the nature and behavior of target markets.
A specific objective, like the introduction of a new product, drives the conduct of market research. Market intelligence, on the other hand, focuses continuously on fully comprehending the market.
This entails collecting relevant data from sources like consumer surveys, social media analytics, and competitor analysis. This data should be both quantitative and qualitative for comprehensiveness.
Upon gathering the data, you must analyze it to glean valuable insights. Data analysis entails sorting, structuring, recognizing trends and patterns, and drawing conclusions.
The final step is to prepare a report and presentation summarizing the data analysis findings. The report should be easy to understand and present the insights clearly and concisely. The presentation should be appealing and insightful to highlight the key findings and recommendations.
Follow these steps to carry out a market intelligence survey:
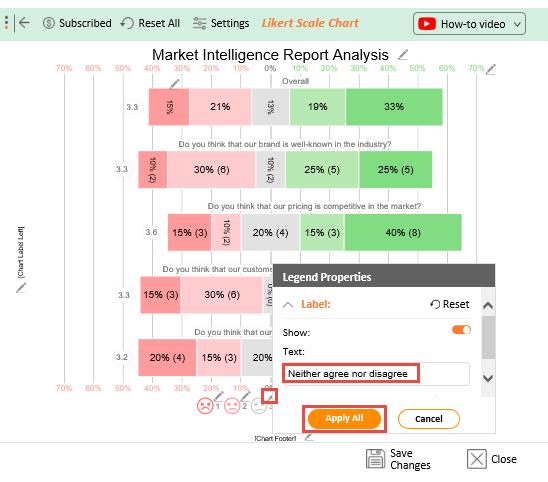
Upon collecting data from the survey, it’s time to analyze it. Here, you need to use a tool like Excel to organize and sort through the data. Unfortunately, Excel poses some challenges with visual data analysis, especially when there is considerable data to analyze.
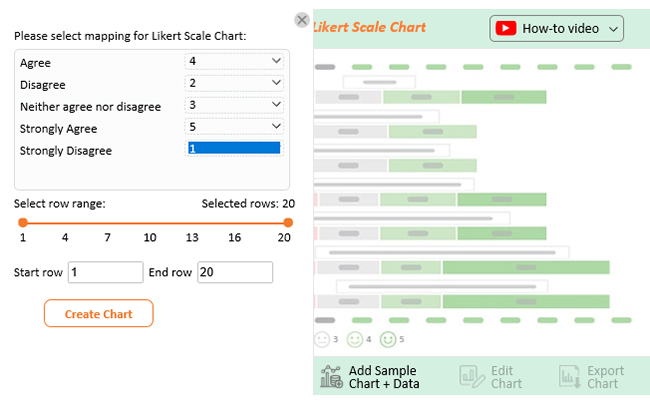
This is where ChartExpo comes in handy.
ChartExpo is an Excel add-in that facilitates effortless data visualization and analysis. It allows you to create insightful visualizations from which you can readily derive information.
Why ChartExpo?
ChartExpo charts and graphs are available both in Google Sheets and Microsoft Excel. Please use the following CTA’s to install the tool of your choice and create data visualizations in a few clicks in your favorite tool.


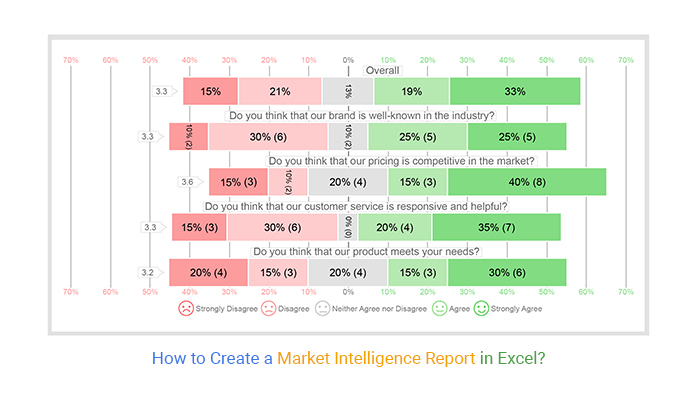
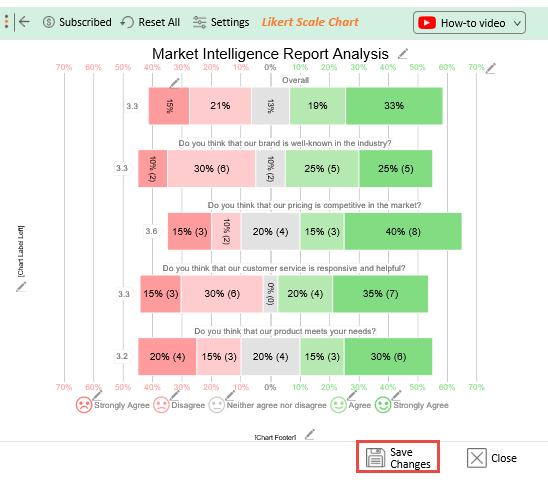
Let’s say you want to create a market intelligence report. Thus, you need to conduct an online survey about your brand and product. Your survey consists of the following questions.
Your respondents are to provide an answer to each question from the following responses.
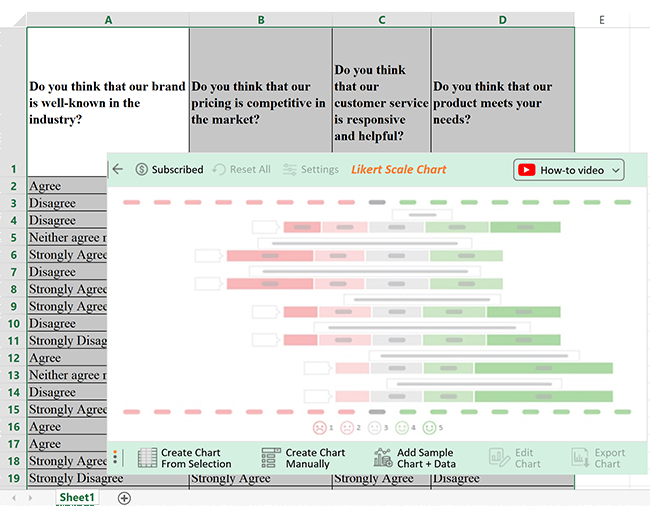
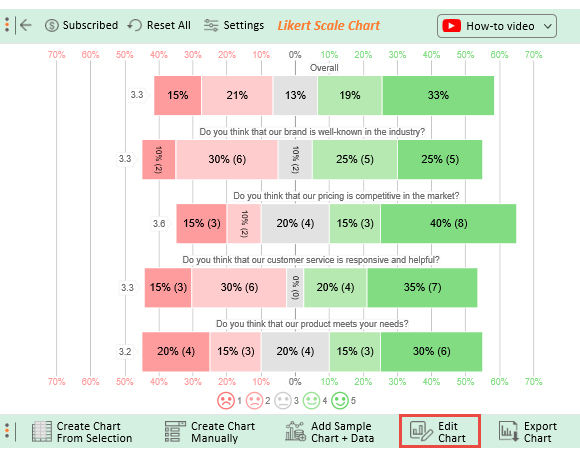
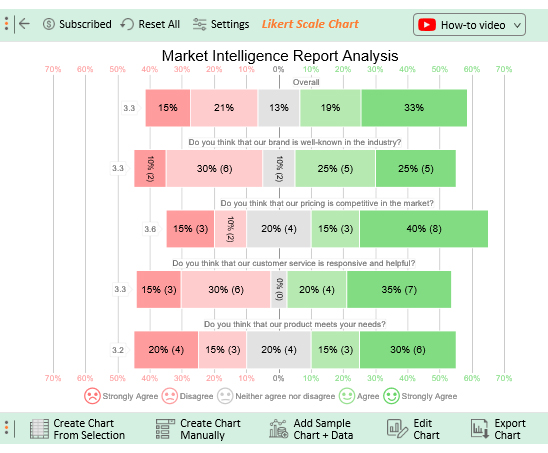
Let’s say you have conducted your survey and obtained the data below.
| Do you think that our brand is well-known in the industry? | Do you think that our pricing is competitive in the market? | Do you think that our customer service is responsive and helpful? | Do you think that our product meets your needs? |
| Agree | Strongly Agree | Strongly Disagree | Neither agree nor disagree |
| Disagree | Neither agree nor disagree | Agree | Strongly Agree |
| Disagree | Strongly Agree | Strongly Agree | Neither agree nor disagree |
| Neither agree nor disagree | Neither agree nor disagree | Agree | Disagree |
| Strongly Agree | Disagree | Strongly Disagree | Strongly Disagree |
| Disagree | Strongly Agree | Strongly Agree | Agree |
| Strongly Agree | Agree | Agree | Strongly Disagree |
| Strongly Agree | Neither agree nor disagree | Disagree | Agree |
| Disagree | Agree | Strongly Agree | Strongly Agree |
| Strongly Disagree | Strongly Agree | Strongly Agree | Strongly Agree |
| Agree | Strongly Disagree | Disagree | Neither agree nor disagree |
| Neither agree nor disagree | Strongly Agree | Strongly Disagree | Strongly Agree |
| Disagree | Neither agree nor disagree | Disagree | Strongly Disagree |
| Strongly Agree | Strongly Agree | Strongly Agree | Strongly Agree |
| Agree | Agree | Agree | Agree |
| Agree | Strongly Disagree | Disagree | Neither agree nor disagree |
| Strongly Agree | Strongly Agree | Disagree | Strongly Agree |
| Strongly Disagree | Strongly Agree | Strongly Agree | Disagree |
| Agree | Disagree | Strongly Agree | Strongly Disagree |
| Disagree | Strongly Disagree | Disagree | Disagree |


The three primary types of market intelligence include the following;
These types of market intelligence provide a comprehensive understanding of the market. This understanding contributes to wise decision-making.
Market intelligence data analysis necessitates the use of spreadsheets and analysis tools. For effective data analysis, use ChartExpo for Excel. This is an Excel add-in that converts data from spreadsheets to meaningful visualizations. From the visualizations, you can glean insights effortlessly.
Market intelligence reports provide businesses with data-driven insights. These insights inform decision-making on marketing strategies, product development, and competitive positioning. This contributes to improved performance which translates to increased sales and profit.
Regularly conduct market intelligence research to keep abreast of market trends, opportunities, and threats. The frequency can change based on the industry and the business needs. However, it is good practice to execute it once every quarter.
You must stay one step ahead of the competition to win over consumers and sustain your growth trajectory. To earn an edge over competitors, you need in-depth market knowledge.
This is where market intelligence comes into play.
A market intelligence report provides information necessary to gain an in-depth understanding of the market and inform decision-making. Consequently, helps in establishing strategies that aim at maintaining a competitive edge and boosting profits.
However, developing a market intelligence report can be a daunting task. Regrettably, most companies lack the necessary resources to invest in market intelligence. Therefore, making the most of freely available tools and resources is essential.
Creating a market intelligence report does not, therefore, necessitate outsourcing.
Choose a web-based survey tool like Google Forms, which is intuitive and mobile-friendly. Then analyze the data with ChartExpo for Excel. ChartExpo allows you to create insightful visualizations for easy gleaning of insights.
Don’t wait.
Start Using ChartExpo today and take your market intelligence to a higher level
How much did you enjoy this article?


Calculate accounts receivable turnover ratio to measure credit collection speed, improve cash flow, and strengthen your financial strategy. Read on!

Change Management KPIs are the key to tracking adoption, performance, and ROI during transitions. Find out which metrics matter. Read on!

Data collection methods and techniques determine the quality of every insight you act on. Explore key approaches for gathering reliable data. Read on!


