• Home
  • Tools dropdown img
    • Spreadsheet Charts

      • ChartExpo for Google Sheets
      • ChartExpo for Microsoft Excel
    • Power BI Charts

      • Power BI Custom Visuals by ChartExpo
    • Word Cloud

  • Charts dropdown img
    • Chart Category

      • Bar Charts
      • Circle Graphs
      • Column Charts
      • Combo Charts
      • Comparison Charts
      • Line Graphs
      • PPC Charts
      • Sentiment Analysis Charts
      • Survey Charts
    • Chart Type

      • Box and Whisker Plot
      • Clustered Bar Chart
      • Clustered Column Chart
      • Comparison Bar Chart
      • Control Chart
      • CSAT Survey Bar Chart
      • CSAT Survey Chart
      • Dot Plot Chart
      • Double Bar Graph
      • Funnel Chart
      • Gauge Chart
      • Likert Scale Chart
      • Matrix Chart
      • Multi Axis Line Chart
      • Overlapping Bar Chart
      • Pareto Chart
      • Radar Chart
      • Radial Bar Chart
      • Sankey Diagram
      • Scatter Plot Chart
      • Slope Chart
      • Sunburst Chart
      • Tornado Chart
      • Waterfall Chart
      • Word Cloud
    • Google Sheets
      Microsoft Excel
  • Services
  • Pricing
  • Contact us
  • Blog
  • Support dropdown img
      • Gallery
      • Videos
      • Contact us
      • FAQs
      • Resources
    • Please feel free to contact us

      atsupport@chartexpo.com

Categories
All Data Visualizations Data Analytics Surveys
Add-ons/
  • Google Sheets
  • Microsoft Excel
  • Power BI
All Data Visualizations Data Analytics Surveys
Add-ons
  • Google Sheets
  • Microsoft Excel
  • Power BI

We use cookies

This website uses cookies to provide better user experience and user's session management.
By continuing visiting this website you consent the use of these cookies.

Ok

ChartExpo Survey


Home > Blog > Surveys

Likert Scale Templates: Revolutionize Your Research

Surveys help gather client feedback and opinions. The easy-to-interpret Likert Scale surveys capture data in no time. Their importance lies in precision measuring a person’s attitude, opinion, or behavior.

Likert Scale Template

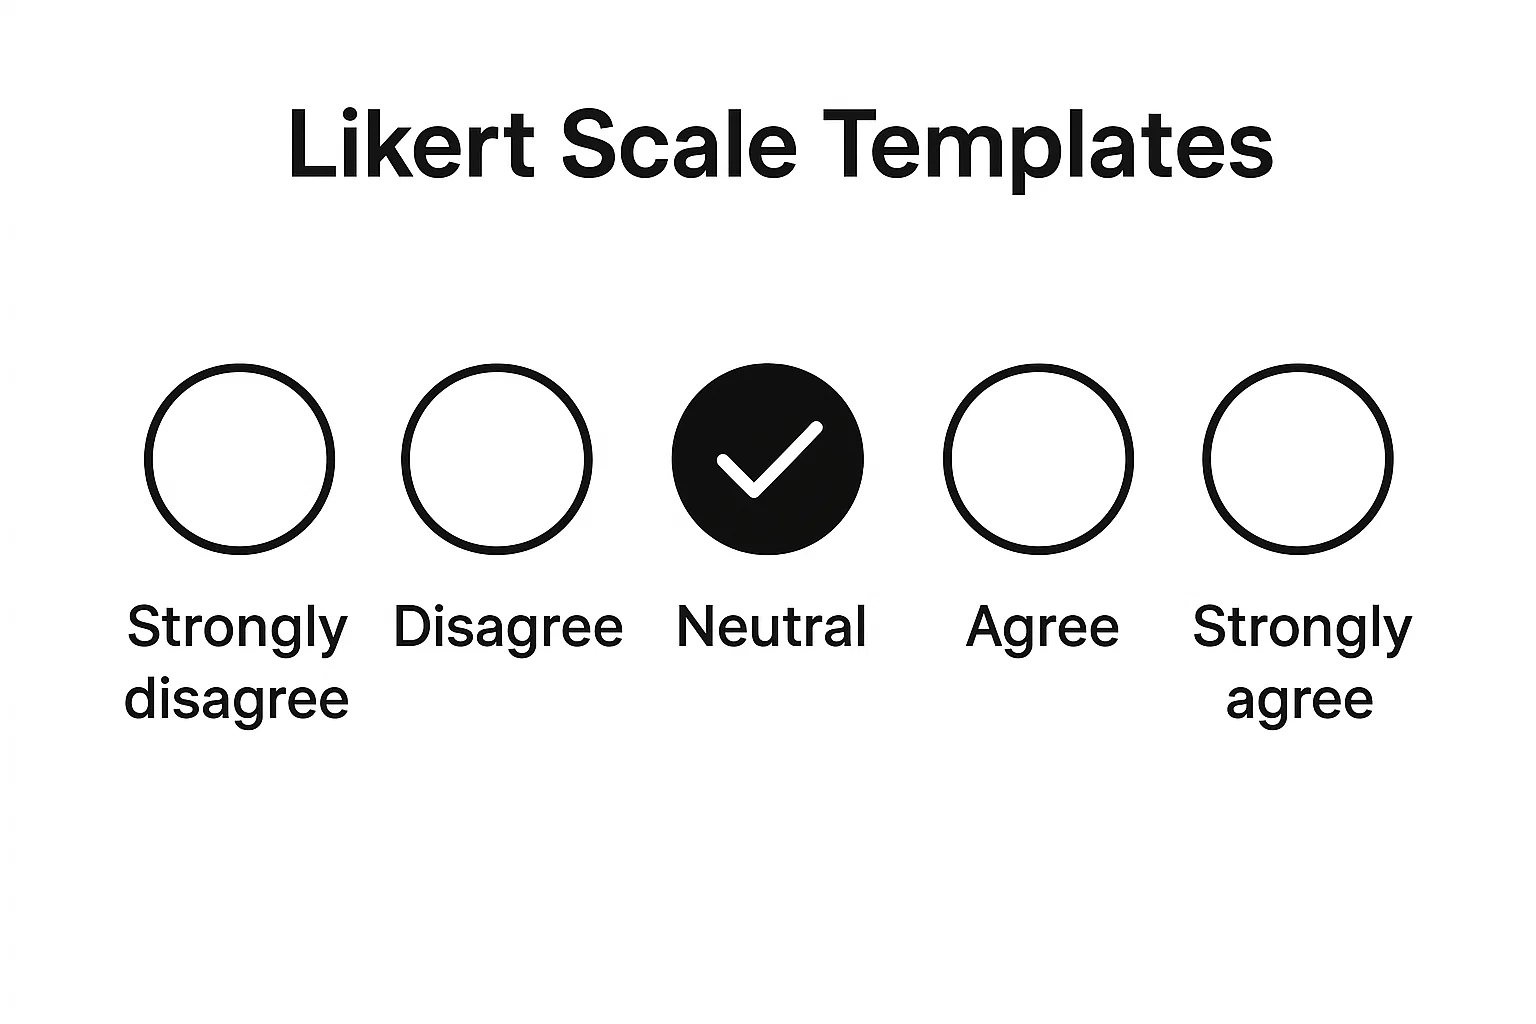
A Likert Scale allows respondents to provide feedback on a wide range of topics. The Scale consists of points that indicate levels of agreement or disagreement. For instance, a five-point Likert scale can have: strongly agree, agree, neutral, disagree, and strongly disagree.

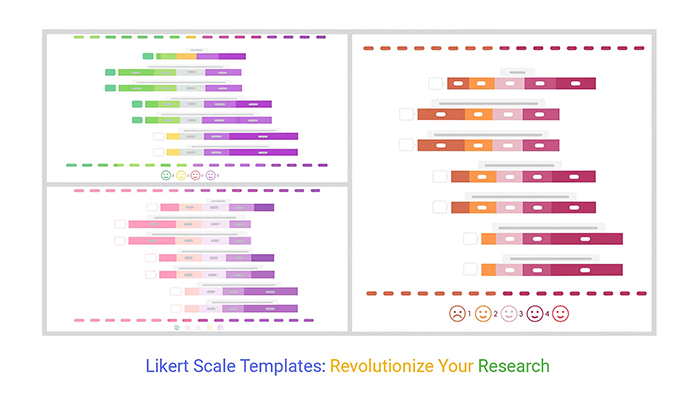
The Likert Scale templates provide simple and effective Survey analysis. They also let you visualize the results with ease. Thus, a perfect tool for understanding people’s ideas and feelings.

Keep reading for a Likert Scale template overview and use cases of how to use the templates.

Table of Content:

  1. What is a Likert Scale Template?
  2. Video Tutorials: How to Visualize Likert Scale Template
  3. Why use a Likert Scale Template?
  4. When to use a Likert Scale Survey Template?
  5. Likert Scale Templates & Examples
  6. How to Create a Likert Questionnaire Template?
  7. How to Analyze Likert Scale Excel Templates?
    • Likert Scale Template #1:
    • Likert Scale Template #2:
    • Likert Scale Template #3:
  8. What Makes a Good Likert Scale Template?
  9. Tips For Using Likert Scale Excel Template
  10. FAQs: Likert Scale Template
  11. Wrap Up

What is a Likert Scale Template?

Definition: A Likert scale template is a ready-made template used to create surveys or assessments that measure attitudes, opinions, or perceptions. It typically includes a set of questions with a range of response options, allowing respondents to indicate their level of agreement or satisfaction.

Likert Scale Template 1

This template is widely used in market research, customer satisfaction surveys, social science studies, and educational research, making it a popular method for gathering structured feedback efficiently.

Key Features of a Likert Scale Template:

  • Range of Response Options
    Includes 5-point or 7-point scales (e.g., Strongly Disagree to Strongly Agree) to capture varying levels of opinion.
  • Clear, Structured Statements
    Uses precise statements or questions to measure attitudes, perceptions, or satisfaction consistently.
  • Balanced Scale
    Offers equal positive and negative options around a neutral midpoint, reducing bias in responses.
  • Quantifiable Data Output
    Converts subjective opinions into numerical data, enabling easy analysis and trend identification.
  • Versatile Application
    Suitable for customer feedback, employee surveys, academic research, and market studies.

Video Tutorials: How to Visualize Likert Scale Template

How to Visualize Likert Scale Template in Excel?

How to Visualize Likert Scale Template in Google Sheets:

How to Visualize Likert Scale Template in Power BI?

Why use a Likert Scale Template?

  • Captures Nuanced Feedback: A Likert scale template allows respondents to express degrees of agreement or satisfaction rather than a simple yes/no, giving you richer, more detailed insights.
  • Easy to Understand and Complete: The clear, structured template makes it simple for respondents to answer, improving survey completion rates while ensuring consistency in responses.
  • Provides Quantifiable Data: By converting subjective opinions into measurable data, Likert scales help you analyze trends, track changes over time, and create clear reports.
  • Versatile for Different Surveys: Likert scales work well in customer feedback, employee engagement surveys, market research, and academic studies, making them highly adaptable for various needs.
  • Supports Data-Driven Decisions: The actionable insights from Likert scale data help businesses, educators, and researchers make informed, evidence-based decisions with confidence.

When to use a Likert Scale Survey Template?

Use a Likert scale survey template when you need to measure attitudes, opinions, or satisfaction levels in surveys. It’s ideal for customer or employee feedback, tracking changes over time, and turning subjective feelings into clear, measurable data for reporting.

Likert Scale Templates & Examples

Likert Scale Templates are pre-made survey questions you can use in your next survey. The templates, including a survey template in Excel, simplify the creation and use of survey research questions. They let you track respondent replies on various topics.

5-Point Likert Scale Template

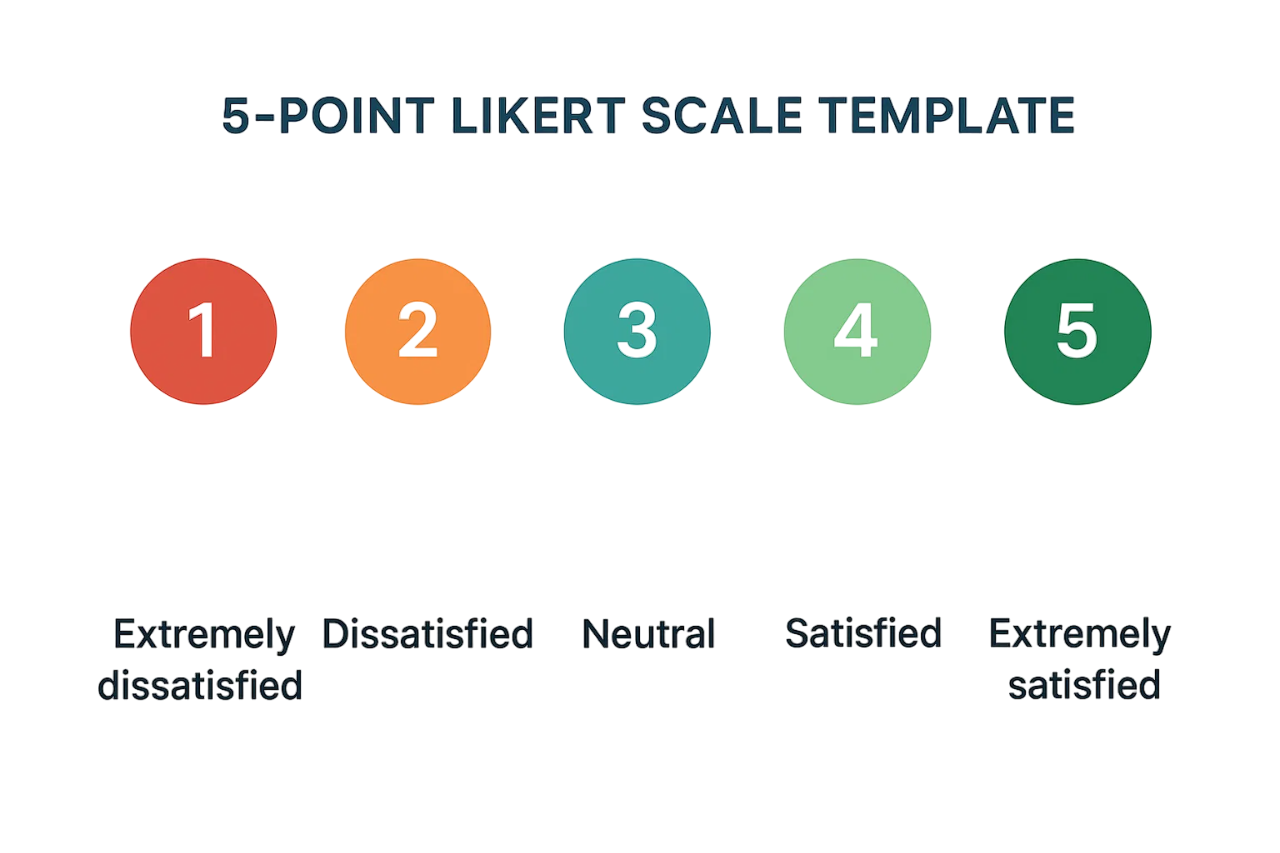
This is a 5-point Likert Scale Template:

  1. Extremely dissatisfied
  2. Dissatisfied
  3. Neutral
  4. Satisfied
  5. Extremely satisfied

7-point Likert Scale Template

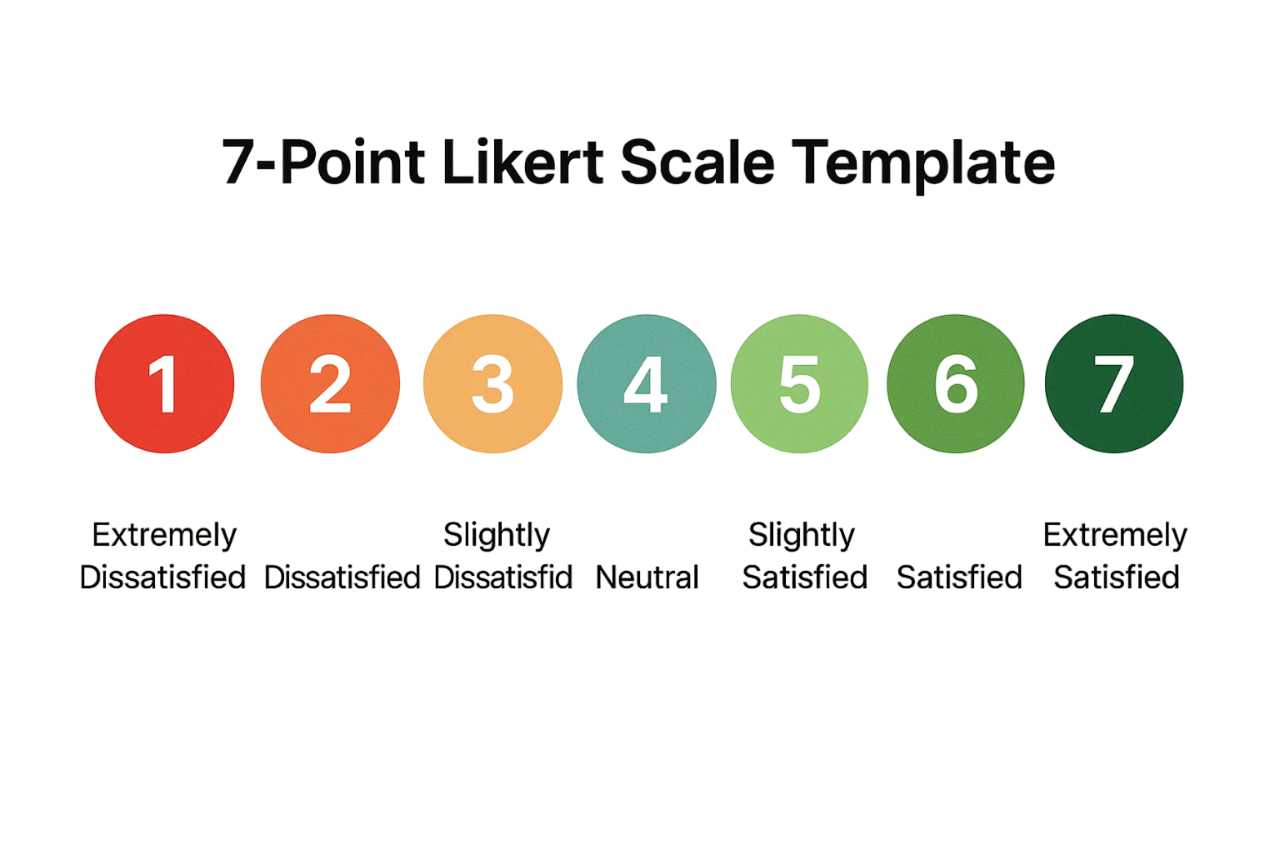
This is a 7-point Likert Scale Template:

  1. Extremely dissatisfied
  2. Dissatisfied
  3. Slightly Dissatisfied
  4. Neutral
  5. Slightly Satisfied
  6. Satisfied
  7. Extremely satisfied

10-point Likert Scale Template

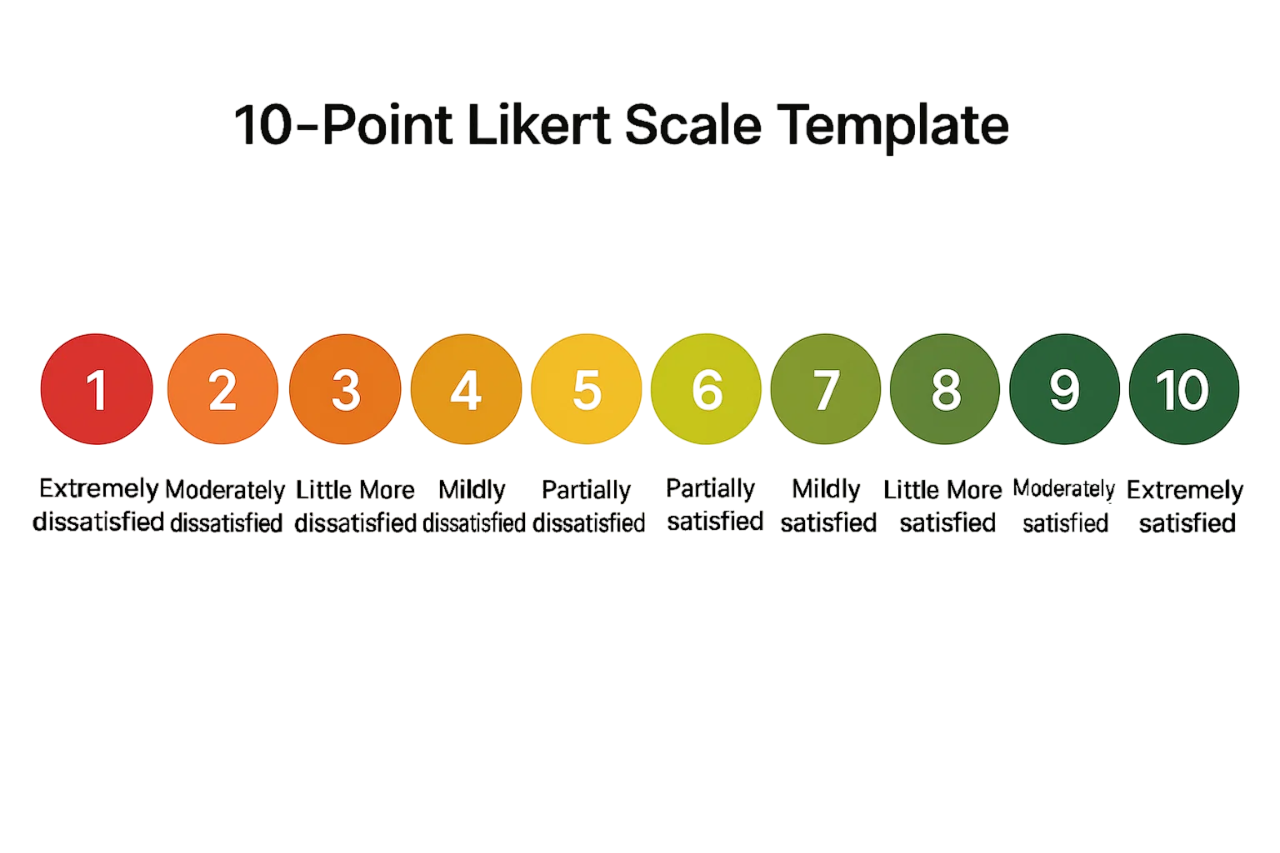
This is a 10-point Likert Scale Template:

  1. Extremely dissatisfied
  2. Moderately dissatisfied
  3. Little More dissatisfied
  4. Mildly dissatisfied
  5. Partially dissatisfied
  6. Partially satisfied
  7. Mildly satisfied
  8. Little More Satisfied
  9. Moderately satisfied
  10. Extremely satisfied

How to Create a Likert Questionnaire Template?

  • Define Your Goal

Clarify what you want to measure—such as customer satisfaction, employee engagement, or opinions on a product feature.

  • Write Clear Statements

Create 5–10 statements relevant to your goal. Keep wording neutral and specific (e.g., “The product meets my needs.”).

  • Choose a Scale

Decide on a response scale (e.g., 5-point: Strongly Disagree to Strongly Agree) and use the same scale for all questions to maintain consistency.

  • Design the Layout

List statements in one column and place response options horizontally to make it easy for respondents to follow and mark their answers.

  • Add Instructions

Briefly explain to respondents how to complete the questionnaire, emphasizing there are no right or wrong answers.

  • Test Your Template

Share the draft with a small group to check if statements are clear and responses align with your goal.

  • Finalize and Share

Once reviewed, finalize the template in Google Forms, Excel, or your preferred survey tool to start collecting structured feedback efficiently.

How to Analyze Likert Scale Excel Templates?

Analyze your Likert scale template Excel data visually using ChartExpo to uncover trends quickly. Turn complex responses into clear, actionable charts without formulas or coding. Easily spot patterns in customer feedback and survey data for informed decision-making.

How to Install ChartExpo in Excel?

  1. Open your Excel application.
  2. Open the worksheet and click on the “Insert” menu.
  3. You’ll see the “My Apps”.
  4. In the office Add-ins window, click on “Store” and search for ChartExpo on my Apps Store.
  5. Click on the “Add” button to install ChartExpo in your Excel.

ChartExpo charts are available both in Google Sheets and Microsoft Excel. Please use the following CTA’s to install the tool of your choice and create a beautiful Likert scale template Excel in a few clicks in your favorite data visualization tool.

Likert Scale Template #1:

This template provides questions for a 5-Point Likert Scale Chart Template inquiry.

5-Point Likert Scale Template

The 4 survey questions are:

  1. How much satisfied are you with the comfort of your flight?
  2. How much satisfied are you with the timeliness of your flight?
  3. How satisfied are you with the service provided by the flight crew?
  4. How much satisfied are you with the price you paid for your airfare?

The response will be textual:

  • Extremely dissatisfied
  • Dissatisfied
  • Neutral
  • Satisfied
  • Extremely satisfied

Let’s demonstrate this data format with an example. Assume you have data from a platform such as Google Forms or Microsoft Forms. You have compiled the data in an Excel worksheet.

Let’s create a Likert scale chart template.

The first column shows the response date and time.

Responses for Likert Scale Template
  • To get started with ChartExpo, install ChartExpo in Excel.
  • Now Click on My Apps from the INSERT menu.
insert chartexpo for Likert Scale Template
  • Choose ChartExpo from My Apps, then click Insert.
open chartexpo for Likert Scale Template
  • Once ChartExpo is loaded. Click on “Likert Scale Chart” from the list of charts.
search likert scale chart for Likert Scale Template
  • Click the “Create Chart From Selection” button after selecting the data from the sheet, as shown.
create likert scale templates in excel
  • Use this Likert Scale and assign numbers to the responses.
    • 1 = Extremely dissatisfied
    • 2 = Dissatisfied
    • 3 = Neutral
    • 4 = Satisfied
    • 5 = Extremely satisfied
create likert scale templates in excel
  • The 5-point Likert Scale will look as follows.
likert scale template in excel

Insights

  • 61% of respondents said their flight was comfortable, while 24% were not.
  • 60% of customers indicated that they were satisfied with the timeliness of the flight, and 27% were dissatisfied.
  • 56% of passengers were satisfied with the services provided by the flight crew, whereas 27% were not.
  • 68% were satisfied with the airfare, while 26% were not.

Likert Scale Template #2:

In this example, we will use a 7-point Likert Scale.

7-Point Likert Scale Template

The 4 survey questions are:

  • How much satisfied are you with the comfort of your flight?
  • How much satisfied are you with the timeliness of your flight?
  • How satisfied are you with the service provided by the flight crew?
  • How much satisfied are you with the price you paid for your airfare?

The numerical answers are:

  • 1 = Extremely dissatisfied
  • 2 = Dissatisfied
  • 3 = Slightly Dissatisfied
  • 4 = Neutral
  • 5 = Slightly Satisfied
  • 6 = Satisfied
  • 7 = Extremely satisfied

Assuming you have this survey data.

Responses for Likert Scale Template
  • Open ChartExpo by following the above process. Then select the data from the sheet and click the “Create Chart From Selection” button.
create likert scale templates in excel
  • This will create the visualization on a 10-point scale as shown.
Likert scale template
  • Click on the “Settings” button.
  • Go to the “Scale Type” property and pick the 7-point option.
  • Click the “Apply” button when finished.
settings likert scale templates in excel
  • This is the first impression.
edit likert scale templates in excel
  • If you want to have the title of the chart, click on Edit Chart, as shown in the above image.
  • To change the title of the chart, click on the pencil icon that is available very next to Chart Header.
  • It will open the properties dialog. Under the Text section, you can add a heading in Line 1 and enable Show Give the appropriate title of your chart and click on Apply button.
  • For saving changes, click on Save Changes. This will persist the changes.
save likert scale templates in excel
  • The final 7-point Likert Scale will look as follows.
Likert scale templates free

Insights

  • 37% of respondents said their flight was comfortable, while 48% were dissatisfied.
  • 41% of customers indicated that they were satisfied with the timeliness of the flight, while 43% were not.
  • 44% of passengers were satisfied with the services provided by the flight crew, whereas 43% were not.
  • 55% were satisfied with the airfare, while 34% were not.

Likert Scale Template #3:

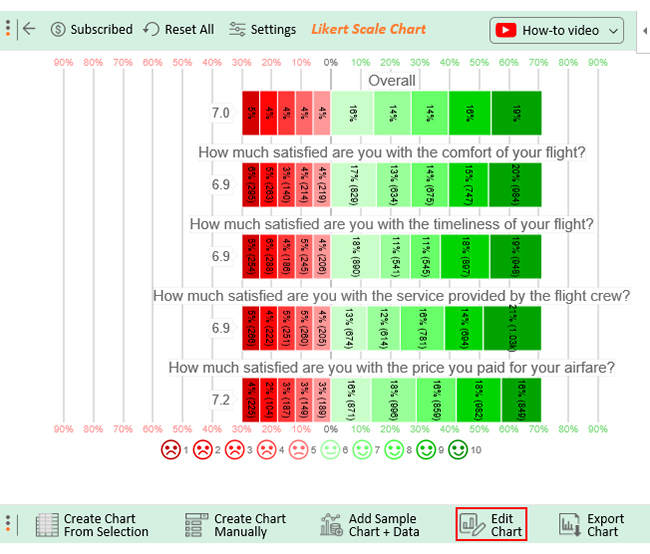
A row-based Likert Scale template is also available for analysis. For instance, if you have a 10-point Likert Scale Survey result like this, you can organize your data in the form of rows:

10-Point Likert Scale Template
  • Extremely dissatisfied
  • Moderately dissatisfied
  • Little More dissatisfied
  • Mildly dissatisfied
  • Partially dissatisfied
  • Partially satisfied
  • Mildly satisfied
  • Little More Satisfied
  • Moderately satisfied
  • Extremely satisfied

Categorize each query with its response and count:

Questions Scale Responses
How much satisfied are you with the comfort of your flight? 1 295
How much satisfied are you with the comfort of your flight? 2 263
How much satisfied are you with the comfort of your flight? 3 140
How much satisfied are you with the comfort of your flight? 4 214
How much satisfied are you with the comfort of your flight? 5 219
How much satisfied are you with the comfort of your flight? 6 829
How much satisfied are you with the comfort of your flight? 7 634
How much satisfied are you with the comfort of your flight? 8 675
How much satisfied are you with the comfort of your flight? 9 747
How much satisfied are you with the comfort of your flight? 10 984
How much satisfied are you with the timeliness of your flight? 1 254
How much satisfied are you with the timeliness of your flight? 2 288
How much satisfied are you with the timeliness of your flight? 3 186
How much satisfied are you with the timeliness of your flight? 4 245
How much satisfied are you with the timeliness of your flight? 5 206
How much satisfied are you with the timeliness of your flight? 6 890
How much satisfied are you with the timeliness of your flight? 7 541
How much satisfied are you with the timeliness of your flight? 8 545
How much satisfied are you with the timeliness of your flight? 9 897
How much satisfied are you with the timeliness of your flight? 10 948
How much satisfied are you with the service provided by the flight crew? 1 266
How much satisfied are you with the service provided by the flight crew? 2 222
How much satisfied are you with the service provided by the flight crew? 3 251
How much satisfied are you with the service provided by the flight crew? 4 260
How much satisfied are you with the service provided by the flight crew? 5 205
How much satisfied are you with the service provided by the flight crew? 6 674
How much satisfied are you with the service provided by the flight crew? 7 614
How much satisfied are you with the service provided by the flight crew? 8 781
How much satisfied are you with the service provided by the flight crew? 9 694
How much satisfied are you with the service provided by the flight crew? 10 1033
How much satisfied are you with the price you paid for your airfare? 1 225
How much satisfied are you with the price you paid for your airfare? 2 104
How much satisfied are you with the price you paid for your airfare? 3 187
How much satisfied are you with the price you paid for your airfare? 4 149
How much satisfied are you with the price you paid for your airfare? 5 189
How much satisfied are you with the price you paid for your airfare? 6 871
How much satisfied are you with the price you paid for your airfare? 7 996
How much satisfied are you with the price you paid for your airfare? 8 859
How much satisfied are you with the price you paid for your airfare? 9 982
How much satisfied are you with the price you paid for your airfare? 10 849
  • You can access ChartExpo using the instructions outlined in the examples above.
  • After selecting the data from the sheet, click the “Create Chart From Selection” button.
create likert scale templates in excel
  • A 5-point Likert Scale Chart is the default visualization. You will have to change it.
10 point likert scale templates in excel
  • Click on the “Settings” button. Go to the “Scale Type” property and pick the 10-point option. Click the “Apply” button when finished.
settings likert scale templates in excel
  • This is the first impression of the 10-point Likert Scale.
edit likert scale templates in excel
  • If you want to have the title of the chart, click on Edit Chart, as shown in the above image.
  • To change the title of the chart, click on the pencil icon that is available very next to Chart Header.
  • It will open the properties dialog. Under the Text section, you can add a heading in Line 1 enable Show Give the appropriate title of your chart, and click on the Apply button.
  • For saving changes, click on Save Changes. This will persist the changes.
save likert scale templates in excel
  • The final 10-point Likert Scale will look as follows.
10 point likert scale template

Insights

  • 79% of respondents said their flight was comfortable, while 22% were not.
  • 77% of customers indicated that they were satisfied with the timeliness of the flight, and 24% were not.
  • 76% of passengers were satisfied with the services provided by the flight crew, whereas 23% were dissatisfied.
  • 84% were satisfied with the airfare, while 15% were not.

What Makes a Good Likert Scale Template?

A good Likert scale template is clear, unbiased, and easy to complete. It uses straightforward statements with balanced response options, like “Strongly Disagree” to “Strongly Agree,” allowing honest feedback. A clean, organized layout makes it quick for respondents while ensuring you get reliable data ready for analysis and visualization.

Tips For Using Likert Scale Excel Template

  • Keep It Clear
    Use clear statements and consistent scales (e.g., 1–5) to avoid confusing your respondents.
  • Use Data Validation
    Add dropdowns for response options to keep entries consistent and reduce manual errors.
  • Visualize Responses
    Create charts (bar or stacked charts) in Excel to quickly see trends in your Likert scale data.
  • Analyze Regularly
    Review and analyze the responses to identify patterns, making it easier to turn feedback into actionable insights.

FAQs: Likert Scale Template

What is the 5 Likert scale format?

A 5 Likert scale format uses five response options to measure agreement or opinion, typically:

  • Strongly Disagree
  • Disagree
  • Neutral
  • Agree
  • Strongly Agree

Are Likert Scale Templates available in Excel?

ChartExpo add-in for Excel has Likert Scale Templates. Likert scale templates allow users to create surveys with a range of responses. They measure customer satisfaction, employee engagement, and other key metrics.

Wrap Up

The Likert Scale accurately measures opinions, attitudes, and behaviors. You can easily gather data for decision-making with the right Likert Scale Template. Using a Likert Scale, you can also evaluate customer satisfaction, employee performance, and more.

Thus, a Likert Scale Template is an excellent choice for a reliable way to analyze survey data.

Are you looking for a powerful data visualization tool to help you visualize your survey results?

How much did you enjoy this article?

GSAd1
Start Free Trial!
124149

Related articles

next previous
Surveys15 min read

5 Market Research Report Examples for Impactful Analysis

Uncover market dynamics with our market research report example. Gain insights through impactful methodologies and effective analysis techniques.

Surveys15 min read

Rating Scale: Definition, Examples and Methods

Discover what a rating scale is, how it measures opinions or performance, and explore common types used in surveys, education, and performance reviews.

Surveys11 min read

Likert Scale for Importance with Examples and Analysis Tips

Discover how the Likert scale for importance helps measure perceived value across topics. Learn examples, benefits, and best practices for creating surveys.

Surveys13 min read

Likert Satisfaction Scale for Structured Response Analysis

Discover what a Likert Satisfaction Scale is, its structure, and why it’s used in customer and employee feedback surveys.

Surveys23 min read

Microsoft Survey: Why Third-Party Tools Drain Budgets

Microsoft survey tools are in your Microsoft 365 but stay unused. Why pay for extras? Use built-in tools for insights and savings. Learn more!

ChartExpo logo

Turn Data into Visual
Stories

CHARTEXPO

  • Home
  • Gallery
  • Videos
  • Services
  • Pricing
  • Contact us
  • FAQs
  • Privacy policy
  • Terms of Service
  • Sitemap

TOOLS

  • ChartExpo for Google Sheets
  • ChartExpo for Microsoft Excel
  • Power BI Custom Visuals by ChartExpo
  • Word Cloud

CATEGORIES

  • Bar Charts
  • Circle Graphs
  • Column Charts
  • Combo Charts
  • Comparison Charts
  • Line Graphs
  • PPC Charts
  • Sentiment Analysis Charts
  • Survey Charts

TOP CHARTS

  • Sankey Diagram
  • Likert Scale Chart
  • Comparison Bar Chart
  • Pareto Chart
  • Funnel Chart
  • Gauge Chart
  • Radar Chart
  • Radial Bar Chart
  • Sunburst Chart
  • see more
  • Scatter Plot Chart
  • CSAT Survey Bar Chart
  • CSAT Survey Chart
  • Dot Plot Chart
  • Double Bar Graph
  • Matrix Chart
  • Multi Axis Line Chart
  • Overlapping Bar Chart
  • Control Chart
  • Slope Chart
  • Clustered Bar Chart
  • Clustered Column Chart
  • Box and Whisker Plot
  • Tornado Chart
  • Waterfall Chart
  • Word Cloud
  • see less

RESOURCES

  • Blog
  • Resources
  • YouTube
SIGN UP FOR UPDATES

We wouldn't dream of spamming you or selling your info.

© 2025 ChartExpo, all rights reserved.