• Home
  • Tools dropdown img
    • Spreadsheet Charts

      • ChartExpo for Google Sheets
      • ChartExpo for Microsoft Excel
    • Power BI Charts

      • Power BI Custom Visuals by ChartExpo
    • Word Cloud

  • Charts dropdown img
    • Chart Category

      • Bar Charts
      • Circle Graphs
      • Column Charts
      • Combo Charts
      • Comparison Charts
      • Line Graphs
      • PPC Charts
      • Sentiment Analysis Charts
      • Survey Charts
    • Chart Type

      • Box and Whisker Plot
      • Clustered Bar Chart
      • Clustered Column Chart
      • Comparison Bar Chart
      • Control Chart
      • CSAT Survey Bar Chart
      • CSAT Survey Chart
      • Dot Plot Chart
      • Double Bar Graph
      • Funnel Chart
      • Gauge Chart
      • Likert Scale Chart
      • Matrix Chart
      • Multi Axis Line Chart
      • Overlapping Bar Chart
      • Pareto Chart
      • Radar Chart
      • Radial Bar Chart
      • Sankey Diagram
      • Scatter Plot Chart
      • Slope Chart
      • Sunburst Chart
      • Tornado Chart
      • Waterfall Chart
      • Word Cloud
    • Google Sheets
      Microsoft Excel
  • Services
  • Pricing
  • Contact us
  • Blog
  • Support dropdown img
      • Gallery
      • Videos
      • Contact us
      • FAQs
      • Resources
    • Please feel free to contact us

      atsupport@chartexpo.com

Categories
All Data Visualizations Data Analytics Surveys
Add-ons/
  • Google Sheets
  • Microsoft Excel
  • Power BI
All Data Visualizations Data Analytics Surveys
Add-ons
  • Google Sheets
  • Microsoft Excel
  • Power BI

We use cookies

This website uses cookies to provide better user experience and user's session management.
By continuing visiting this website you consent the use of these cookies.

Ok

ChartExpo Survey


Home > Blog > Power BI

How to Update Power BI and Optimize Your Data Insights?

Whenever a user refreshes data, Power BI queries the underlying data sources and loads the source data into a semantic model. The visualizations in the reports (or dashboards) will get updated, which rely on the updated semantic model.

How to Update Power BI

The entire process is dependent on the storage modes of the semantic models, and it consists of multiple phases. In this guide, you will discover why updating Power BI is important, the benefits of updating Power BI, and how to update the Power BI desktop.

Table of Contents:

  1. Why is Updating Power BI Important?
  2. How to Update the Power BI Desktop?
  3. What are the Resolving update problems in Power BI Desktop?
  4. How to Visualize Your Data Using Power BI?
  5. What are the Benefits of updating Power BI?
  6. Wrap Up

First…

Why is Updating Power BI Important?

Here are major reasons why updating Power BI is important.

  • Security: Updating Power BI ensures that any bugs or security vulnerabilities are fixed. This will, in turn, protect your data and prevent unauthorized access.
  • Performance: Updates involve improvements to performance, allowing for faster and more efficient data visualization and data analysis.
  • New Features: Users who update Power BI will take advantage of new functionalities and features that enhance the tool’s capabilities. This will, in turn, provide more options for data reporting and analysis.
  • Bug Fixes: Updates address any issues or reported bugs, and that ensures a more reliable and smoother user experience.
  • Compatibility: Keeping Power BI updates ensures compatibility with other data sources and software. It also allows for seamless data connectivity and data integration.

Regular updates ascertain that users use the latest version of Power BI, and that means using the most current features, security enhancements, and bug fixes. That ultimately improves the overall experience and maximizes the potential of the tool.

The big question is, why is it important to update Power BI? Well, updating Power BI ensures optimal performance, compatibility, and security. It also provides users with the best possible experience.

How to Update the Power BI Desktop?

In this section, you will discover various ways of updating Power BI, and that includes the manual and automatic methods. Here are easy ways of updating Power BI.

Automatic Updates

Automatic updates in Power BI help you have the latest features, improvements, and bug fixes. Here are steps to help you get started.

  • Open Power BI.
  • Click the “File” menu.
  • Select “Options and settings.”
  • Choose “Options.”
  • Navigate to the “Global” section.
  • Check the box that shows “Automatically check for updates.”
  • Click “OK” to save the changes.

By enabling automatic updates, updates will be installed automatically by Power BI. This will offer you the most up-to-date version of the software. The automatic updates feature helps you to take advantage of the latest fixes and enhancements without the need to implement them manually.

Manual Updates

Here are easy steps to help you manually update Power BI:

  • Open Power BI and navigate to the File menu.
  • Click “Options and settings” and select “Options.”
  • In the Options dialog box, click “Global.” After that, click “Preview features.”
  • Under the “Manual Updates” section, click “Check for updates.”
  • If an update is available, click “Download.” Next, click “Install.”
  • Wait to complete the installation process.
  • Once the installation is finished, restart Power BI.

Always update the Power BI to regularly stay up-to-date with the latest advancements. This will help you maintain compatibility with other data sources and software.

What are the Resolving update problems in Power BI Desktop?

Problems you’ll likely face when updating Power BI Desktop are:

  • Difficulty installing or downloading the latest version
  • Inability to execute or open the updated version
  • Issues with refreshing or publishing reports post-update.

These problems can be caused by factors like:

  • The internet connection or firewall settings are blocking the installation or download of Power BI Desktop
  • Your operating system or computer falls short of the minimum specifications needed to operate the Power BI Desktop
  • Your Power BI account or Power BI Desktop application has some corrupted or outdated files or settings.

To resolve these problems, you’ll have to fix and troubleshoot the main cause of the issues. These are steps to help you do that:

  • Check the firewall settings and internet connection
  • Ensure the computer meets minimum system requirements
  • Update Power BI Desktop and your account
  • Contact support for assistance or seek solutions on Power BI support sites.

How to Visualize Your Data Using Power BI?

Stage 1: Logging in to Power BI
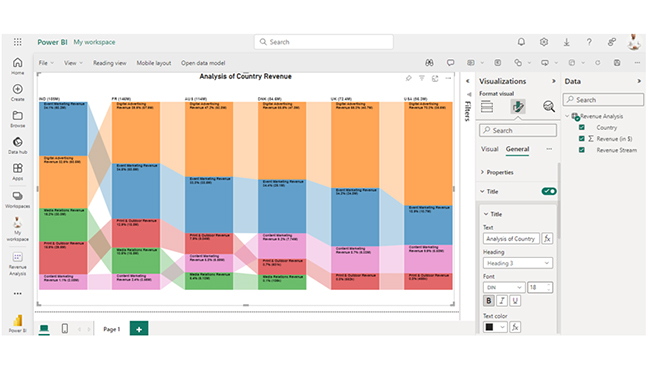
  • Log in to Power BI.
  • Enter your email address and click the “Submit” button.
Enter email to login to Power BI
  • You are redirected to your Microsoft account.
  • Enter your password and click “Sign in“.
Enter Password to login to Power BI
  • You can choose whether to stay signed in.
Click on stay signed in
  • Once done, the Power BI home screen will open.

Stage 2: Creating a Data Set and Selecting the Data Set to Use in Your Chart

  • Go to the left-side menu and click the “Create” button.
  • Select “Paste or manually enter data“.
select Paste or manually enter data in Power BI ce487
  • We’ll use the sample data below for this example.
Country Revenue Stream Revenue (in $)
USA Digital Advertising Revenue 39,620,000
USA Event Marketing Revenue 10,670,000
USA Content Marketing Revenue 5,580,000
USA Print & Outdoor Revenue 455,270
UK Digital Advertising Revenue 40,710,000
UK Event Marketing Revenue 24,770,000
UK Content Marketing Revenue 6,330,000
UK Print & Outdoor Revenue 552,190
DNK Digital Advertising Revenue 47,040,000
DNK Event Marketing Revenue 29,070,000
DNK Content Marketing Revenue 7,740,000
DNK Print & Outdoor Revenue 600,690
DNK Media Relations Revenue 106,430
AUS Digital Advertising Revenue 53,790,000
AUS Event Marketing Revenue 38,530,000
AUS Content Marketing Revenue 6,590,000
AUS Print & Outdoor Revenue 9,040,000
AUS Media Relations Revenue 6,130,000
FR Digital Advertising Revenue 57,860,000
FR Event Marketing Revenue 50,450,000
FR Content Marketing Revenue 3,560,000
FR Print & Outdoor Revenue 18,790,000
FR Media Relations Revenue 15,460,000
IND Digital Advertising Revenue 60,470,000
IND Event Marketing Revenue 63,200,000
IND Content Marketing Revenue 2,080,000
IND Print & Outdoor Revenue 29,500,000
IND Media Relations Revenue 30,020,000
  • Paste the data table above into the “Power Query” window. After that, choose the “Create a dataset only” option.
Select Create a Dataset Only After Learning How to Update Power BI
  • Navigate to the left-side menu, and click the “Data Hub” option. Power BI will populate the data set list. If no data set has been created, you’ll receive an error message. Next, click “Create report.”
Click Create Report After Learning How to Update Power BI
  • To see the chart metrics, click “Expand All.” At this point, you can check the dimensions and metrics.
Click Expand All After Learning How to Update Power BI
  • Click “Get more visuals.” After that, search “ChartExpo,” and select “Comparison Bar Chart.”
Click Get More Visuals After Learning How to Update Power BI
  • Click “Add.”
Click Add After Learning How to Update Power BI
  • You’ll see the Comparison Bar Chart in the visuals list.
Add Comparison Bar Chart After Learning How to Update Power BI
  • In Visual, click on License Settings and add the key. After adding the key, you’ll see the comparison bar chart.
Click License Settings After Learning How to Update Power BI
  • Here’s what the Comparison Bar Chart in Power BI looks like.
Final How to Update Power BI

Insights

  • India has the highest total revenue, and they’re followed by France, Australia, and Denmark.
  • “Digital Advertising” tends to be a significant revenue contributor in most countries. However, “Event Marketing” is the leading revenue contributor in India.
  • “Media Relations” revenue stream is absent in the US and UK.
  • Despite its overall high revenue, India has the lowest revenue from content marketing.

What are the Benefits of updating Power BI?

Here are the key benefits of updating Power BI:

  • Access to New Features and Enhancements

Regular updates give you access to new enhancements and features, and that enables the users to take advantage of the latest functionalities and tools to improve data visualization and analysis. These updates could be new chart types, advanced analytics capabilities, and data connectors.

  • Improved Performance and Efficiency

Updates usually come with performance optimization that makes Power BI run more efficiently and faster. It can improve the speed of report rendering, data processing, and overall responsiveness. These improvements come in handy when working with large datasets.

  • Enhanced Security

Having updated Power BI ensures that the latest security patches and fixes are applied. This will, in turn, protect your data from threats and potential vulnerabilities. It helps maintain the data integrity and confidentiality of sensitive information.

  • Bug Fixes

Updates usually address known bugs and issues, and that provides a more reliable and stable user experience. Fixing these issues helps the user prevent errors, crashes, and other disruptions that might affect productivity.

  • Compatibility with Other Software

Regular updates ascertain that Power BI remains compatible with other software and services, including third-party applications, browsers, and operating systems. Compatibility is necessary for interoperability and seamless integration within the tech ecosystem.

  • Staying Current with Industry Standards

Users who update the Power BI will stay well-informed with the best practices in business intelligence and data analytics, and also stay current with the latest industry standards. This will help the organization leverage cutting-edge technologies whilst remaining competitive in the industry.

  • Improved User Interface and Experience

Updates could include improvements to the user interface. And that makes Power BI more user-friendly and intuitive. It could also involve enhancements in layout, navigation, and usability to streamline the workflow and reduce the learning curve for new users.

  • Access to Support and Resources

The latest version of Power BI gives you access to support resources, up-to-date documentation, and community assistance. All these come in handy when troubleshooting issues, and learning how to make the most of new features.

FAQs

How do I upgrade my Power BI Desktop to the latest version?

Open the Power BI Desktop, and navigate to the File menu. Select Options and Settings. After that, select Options. Enable automatic updates, close the Power BI, download the latest version from the Power BI website, and install it.

Wrap Up

Updating Power BI is a sure way to access performance improvements, new features, and security patches. If you don’t know how to update Power BI, just go over all the simple steps outlined in this guide.

Alternatively, you can download the latest version from the website and install it. Benefits include access to new features and enhanced security. Regular updates introduce new features and enhancements, and that helps users to take advantage of the latest functionalities and tools. All these lead to improved data visualization and analysis.

Updated versions of Power BI come with the latest security patches and fixes. That helps in protecting your data from threats and other potential vulnerabilities.

The steps outlined in this guide will help you become a proficient Power BI user. It will also enable you to create more engaging and interactive visualizations.

How much did you enjoy this article?

PBIAd2
Start Free Trial!
141092

Related articles

next previous
Power BI12 min read

In-depth Look at Effective Healthcare Dashboard Examples

Immerse yourself in Healthcare Dashboard Examples, illustrating innovative ways to transform complex data into actionable insights for healthcare professionals.

Power BI12 min read

Power BI Group By Guide for Effective Data Insights

Learn how Power BI Group By helps you aggregate data, clarify trends, and create reports by grouping values to make large datasets manageable & insightful.

Power BI12 min read

How to Create Sankey Diagram in Microsoft Power BI?

Learn How to Create Sankey Diagram in Microsoft Power BI using Desktop & Web Service. What they are and how to use them effectively.

Power BI8 min read

Power BI Artificial Intelligence: Insights Using Visuals

Discover all there is to know about the Power BI artificial intelligence. You'll also discover how AI is used in Power BI, and how to use it for analysis and more.

Power BI9 min read

Budgeting in Healthcare: Use Visuals to Spot Budget Gaps

This guide helps you discover what budgeting in healthcare is. You'll also discover the factors that affect hospital budgets and types of budgeting in healthcare.

ChartExpo logo

Turn Data into Visual
Stories

CHARTEXPO

  • Home
  • Gallery
  • Videos
  • Services
  • Pricing
  • Contact us
  • FAQs
  • Privacy policy
  • Terms of Service
  • Sitemap

TOOLS

  • ChartExpo for Google Sheets
  • ChartExpo for Microsoft Excel
  • Power BI Custom Visuals by ChartExpo
  • Word Cloud

CATEGORIES

  • Bar Charts
  • Circle Graphs
  • Column Charts
  • Combo Charts
  • Comparison Charts
  • Line Graphs
  • PPC Charts
  • Sentiment Analysis Charts
  • Survey Charts

TOP CHARTS

  • Sankey Diagram
  • Likert Scale Chart
  • Comparison Bar Chart
  • Pareto Chart
  • Funnel Chart
  • Gauge Chart
  • Radar Chart
  • Radial Bar Chart
  • Sunburst Chart
  • see more
  • Scatter Plot Chart
  • CSAT Survey Bar Chart
  • CSAT Survey Chart
  • Dot Plot Chart
  • Double Bar Graph
  • Matrix Chart
  • Multi Axis Line Chart
  • Overlapping Bar Chart
  • Control Chart
  • Slope Chart
  • Clustered Bar Chart
  • Clustered Column Chart
  • Box and Whisker Plot
  • Tornado Chart
  • Waterfall Chart
  • Word Cloud
  • see less

RESOURCES

  • Blog
  • Resources
  • YouTube
SIGN UP FOR UPDATES

We wouldn't dream of spamming you or selling your info.

© 2025 ChartExpo, all rights reserved.