• Home
  • Tools dropdown img
    • Spreadsheet Charts

      • ChartExpo for Google Sheets
      • ChartExpo for Microsoft Excel
    • Power BI Charts

      • Power BI Custom Visuals by ChartExpo
    • Word Cloud

  • Charts dropdown img
    • Chart Category

      • Bar Charts
      • Circle Graphs
      • Column Charts
      • Combo Charts
      • Comparison Charts
      • Line Graphs
      • PPC Charts
      • Sentiment Analysis Charts
      • Survey Charts
    • Chart Type

      • Box and Whisker Plot
      • Clustered Bar Chart
      • Clustered Column Chart
      • Comparison Bar Chart
      • Control Chart
      • CSAT Survey Bar Chart
      • CSAT Survey Chart
      • Dot Plot Chart
      • Double Bar Graph
      • Funnel Chart
      • Gauge Chart
      • Likert Scale Chart
      • Matrix Chart
      • Multi Axis Line Chart
      • Overlapping Bar Chart
      • Pareto Chart
      • Radar Chart
      • Radial Bar Chart
      • Sankey Diagram
      • Scatter Plot Chart
      • Slope Chart
      • Sunburst Chart
      • Tornado Chart
      • Waterfall Chart
      • Word Cloud
    • Google Sheets
      Microsoft Excel
  • Services
  • Pricing
  • Contact us
  • Blog
  • Support dropdown img
      • Gallery
      • Videos
      • Contact us
      • FAQs
      • Resources
    • Please feel free to contact us

      atsupport@chartexpo.com

Categories
All Data Visualizations Data Analytics Surveys
Add-ons/
  • Google Sheets
  • Microsoft Excel
  • Power BI
All Data Visualizations Data Analytics Surveys
Add-ons
  • Google Sheets
  • Microsoft Excel
  • Power BI

We use cookies

This website uses cookies to provide better user experience and user's session management.
By continuing visiting this website you consent the use of these cookies.

Ok

ChartExpo Survey


Home > Blog > Data Analytics

How to Normalize Data: Step-by-Step Guide

Raw data rarely arrives in a usable state. Values conflict, records repeat, and formats vary across sources, making any analysis built on that data inherently unreliable.

How to Normalize Data

Knowing how to normalize data closes this gap, turning messy inputs into clean, structured datasets ready for accurate reporting and consistent analytics.

This guide walks through every key aspect of the normalization process: what it is, when to apply it, which methods work best, and how to carry out each step in Power BI.

You will also find worked examples, concrete best practices, and answers to common questions to make each concept practical and immediately applicable.

What is Data Normalization?

Definition: Normalizing data is the practice of restructuring datasets to eliminate redundancy and enforce consistency. Rather than storing the same value in multiple locations, each piece of information lives in one place.

Tables become smaller and focused, linked through defined relationships that keep the model coherent and easy to maintain.

In analytics, organized tables form a reliable foundation for accurate reporting and greater accuracy across every dashboard the team builds.

Structured data supports faster queries, reduces update errors, and makes it far simpler to manage information at scale.

Why Should Data be Normalized?

Skipping the steps of how to normalize data causes subtle but compounding problems. Reports drift out of sync, updates create conflicts, and performance degrades as datasets grow.

  • Reduce data redundancy: Stores each value exactly once, so the same information cannot occupy multiple rows or columns simultaneously.
  • Improve data consistency: Enforces uniform values and formats across all related tables, ensuring every report reads from the same verified source.
  • Enhance data accuracy: Removes conflicting values that trigger calculation errors and preserves data analysis reliability throughout the entire pipeline.
  • Simplify data management: Makes records straightforward to update because changes propagate from a single location rather than requiring edits in many places.
  • Optimize database performance: Leaner, well-organized tables reduce the volume of data scanned, so queries and report dashboards load significantly faster.
  • Support reliable analysis: Provides the clean, structured inputs every downstream calculation depends on, producing results teams can act on with confidence.
  • Maintain data integrity: Preserves the correctness of table relationships so no update or deletion inadvertently corrupts records or breaks connected links.

When to Use Data Normalization?

Normalizing data is not always necessary, but large or complex datasets often require it before analysis can produce reliable results.

  • Large datasets with duplicates: Repeated records inflate storage and introduce inconsistencies, so normalization cleans the data and keeps large datasets manageable and accurate.
  • Complex relational databases: When multiple tables interact, or you need to use Power BI join tables, normalization prevents key conflicts and keeps all relationships stable.
  • Data consistency requirements: Reports that must reflect identical values everywhere benefit from normalization, which enforces one consistent format across every connected table.
  • Multi-table database systems: Databases that span many tables need clear structural rules so every link between data sources stays stable and data discovery remains productive.
  • Analytical data preparation: Before loading data for visualization or aggregation, normalization removes noise and ensures output accurately reflects the underlying source values.

Common Techniques Used to Normalize Data

Several approaches exist for how to normalize data, and the right one depends on your dataset range, distribution, and the type of analysis planned.

  • Min-max normalization: Compresses all column values into a 0-to-1 range, often applied when working through edit queries in Power BI for consistent scaling.
  • Z-score standardization: Expresses each value as its distance from the mean in standard deviation units, centering the full distribution around zero.
  • Decimal scaling method: Shifts the decimal point by dividing values by an appropriate power of 10, making large numbers easier to compare at a reduced scale.
  • Log transformation: Applies a logarithmic function to compress extreme outliers and bring heavily skewed distributions into a more workable range.
  • Max absolute scaling: Divides every value by the largest absolute value in the column, constraining output to a range running from negative one to one.
  • Unit vector scaling: Rescales each row so its vector length equals one, a method that pairs naturally with Power BI calculated columns for row-level normalization.
  • Data binning: Segments continuous values into discrete ranges so underlying patterns become easier to identify and interpret during analysis.

Explaining the Data Normalization Examples

Seeing real numbers alongside each technique makes how to normalize data tangible. The three examples below demonstrate the most widely used approaches in practice.

  • Min-max normalization example

Values are scaled between 0 and 1 using the minimum and maximum values.

Sample data (Sales): 12000, 18000, 9000, 22000, 15000

Formula: (x−min)/(max−min)

Min = 9000, Max = 22000

How to Normalize Data
  • Z-score normalization example

Values are adjusted using the mean and standard deviation to show distance from the average.

Sample data (Marks): 60, 70, 80, 90, 100

Mean = 80, Std Dev = 14.14

Formula: (x−mean) / std

How to Normalize Data
  • Decimal scaling example

Values are divided by powers of 10 to bring them into a smaller range.

Sample data (Revenue): 45000, 38000, 92000, 61000, 15000

Largest value = 92000
Divide by 100000

Formula: x / 10^n

How to Normalize Data

How to Normalize Data in Power BI?

Power BI supports how to normalize data directly inside Power Query and through DAX column formulas. Completing these steps before building visuals ensures every chart reflects consistent, well-structured figures.

  • Import the dataset into Power BI

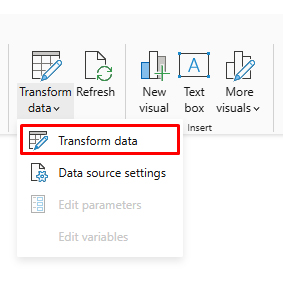
Open the desktop, click Get Data, and connect the required data source in Power BI to load your dataset.

  • Open Power Query Editor

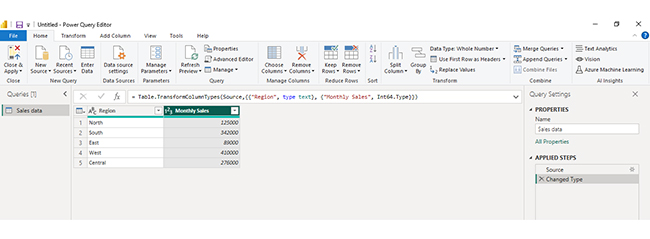
Click Transform Data to open Power Query Editor, where you can clean and modify the dataset.

How to Normalize Data
  • Select the target data column

In the table preview, click the Monthly Sales column because this numeric field needs to be normalized.

How to Normalize Data
  • Apply the normalization formula

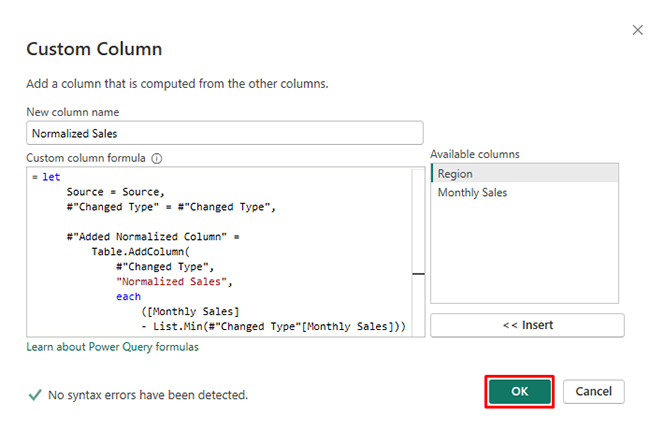
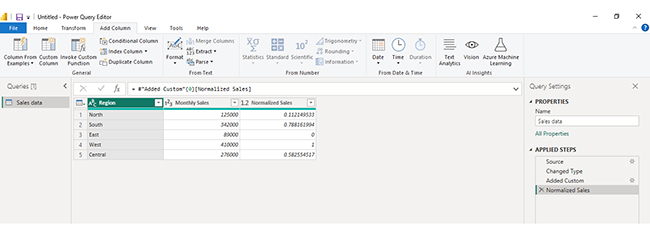
Go to Add Column → Custom Column and enter the Min-Max formula, then click OK to create a normalized column.

How to Normalize Data
  • Your custom column is created.

How to Normalize Data
  • Create a calculated column

If you want to keep the original values unchanged, go to Model → New Column and create a new column for normalized values.

  • Load normalized data

Click Close & Apply to save changes and load the normalized dataset for reporting.

How to Analyze Normalized Data in Power BI?

Analyzing normalized data in Power BI helps you work efficiently with structured datasets by reducing redundancy and improving data integrity. Since normalized data is spread across multiple related tables, proper modeling and visualization are essential to extract meaningful insights. Follow these steps to analyze it effectively:

Step 1: Load and Review Your Data

Import your normalized dataset into Power BI. Ensure all tables are loaded correctly and review their structure, including primary and foreign keys.

Step 2: Understand Table Relationships

Examine how tables are connected. Normalized data typically uses relationships between fact and dimension tables, so understanding these links is critical for accurate analysis.

Step 3: Build and Validate Data Model

Use the model view to create relationships between tables. Ensure connections are correctly defined so data flows properly across different tables.

Step 4: Create Measures and Calculations

Use DAX to create measures such as totals, averages, or performance metrics. These calculations allow you to combine data from multiple tables into meaningful insights.

Step 5: Design Visualizations

Create dashboards using charts like bar charts, line charts, and comparison visuals to explore your data. For more advanced and visually engaging dashboards, you can use ChartExpo to simplify complex data visualization.

Step 6: Analyze Trends and Performance

Interpret your visuals to identify patterns, trends, and performance across different dimensions such as departments, regions, or time periods.

Step 7: Add Final Dashboard Visualization

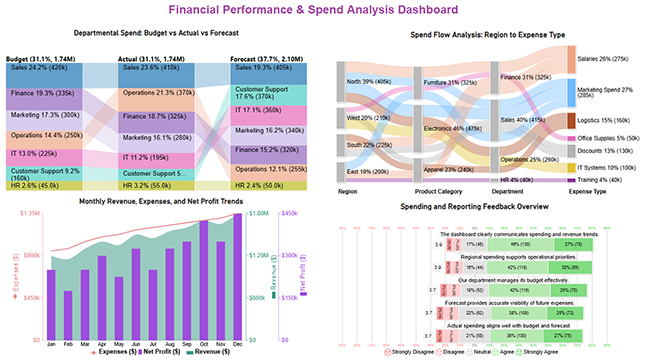
Include a final dashboard image that combines multiple insights, such as budget vs actual comparisons, spend flow analysis, and performance trends. This provides a comprehensive view of your normalized data and helps communicate insights clearly and effectively.

How to Normalize Data

Key Insights

  • The Comparison Bar Chart shows Sales ranking first across all three measurement categories: Budget, Actual, and Forecast.
  • Within the Sankey Chart, Electronics emerges as the top-spending category, followed by Salaries and Marketing as the leading expense types.
  • The Multi Axis Line Chart reveals that revenue is outpacing expenses over the tracked period, a trend that translates directly into growing profit.
  • Responses captured in the Likert Chart indicate that most survey participants feel the dashboard communicates performance information with sufficient clarity.

Benefits of Data Normalization

Understanding how to normalize data delivers measurable improvements across performance, reporting, and long-term data management. The gains compound as datasets grow.

  • Improved data consistency: Keeps field values uniform across all connected tables so every report draws from a single, verified version of each fact.
  • Better analytical accuracy: Structured, deduplicated inputs remove the ambiguity that distorts calculations, producing figures that analysts and decision-makers can rely on.
  • Reduced data duplication: Consolidates repeated values into a single authoritative record, shrinking dataset size and making the overall model cleaner to navigate.
  • Faster query performance: Compact, well-structured tables reduce processing overhead, which shortens query run times and speeds up report refresh cycles considerably.
  • Easier database updates: A normalized model supports data democratization by making records accessible, straightforward to revise, and easy to share across teams.
  • Improved reporting clarity: Clean inputs translate directly into sharper data visualization, where charts accurately represent real trends rather than structural data artifacts.

Best Practices for Data Normalization

Getting how to normalize data right requires more than picking a technique. These guidelines help you apply it without disrupting the relationships your model depends on.

  • Identify redundant attributes: Audit the dataset thoroughly before making changes, flagging duplicate fields and columns that should be consolidated or removed entirely.
  • Separate data into logical tables: Reorganize records so each table holds a single category of information, keeping the model clean and easy for future analysts to extend.
  • Apply appropriate normalization method: Match the technique to dataset characteristics and the analytical goal rather than defaulting to whatever method seems most familiar.
  • Maintain clear relationships: Define keys carefully and verify every join between tables reflects a genuine, intentional link rather than a coincidental or accidental match.
  • Validate normalized datasets: Run queries and cross-check aggregations after applying changes to confirm that calculations still return the correct and expected outputs.
  • Document data structures: Record the logic behind table design and key relationships so future analysts can understand and extend the model without guesswork or rework.

Common Challenges in Normalizing Data

Even when applied carefully, how to normalize data introduces trade-offs worth anticipating. Recognizing these in advance helps you calibrate the process correctly.

  • Complex database structures: Each normalization step adds a new table, and heavily normalized models can become difficult to navigate, audit, and maintain over time.
  • Increased query complexity: Retrieving a complete record often requires joining several tables, making queries longer and more demanding for analysts to write correctly.
  • Performance trade-offs: Too many small tables force the database to execute multiple joins for a single result, which can degrade query speed noticeably.
  • Data migration issues: Restructuring legacy datasets into a normalized format requires careful planning and thorough testing to avoid misaligning or losing existing records.
  • Maintaining relationships: A single incorrect foreign key breaks the link between tables, causing reports to return incomplete or entirely incorrect figures.
  • Over-normalization risks: Normalizing beyond what the use case requires adds structural complexity without improving data quality or query reliability.

FAQs

What is the best way to normalize data?

Start by auditing the dataset for duplicate and inconsistent values, then divide it into focused tables linked by defined keys. Choose a method such as min-max or z-score based on the data distribution, and validate results before using the output in any live reports.

What are the three steps in normalizing data?

The core steps are removing duplicate values, dividing data into related tables with clear purposes, and establishing key relationships so you can normalize data without repeating the same information across multiple locations.

What are 1NF, 2NF, and 3NF in normalization?

First normal form removes repeating groups, second normal form eliminates partial key dependencies, and third normal form addresses transitive dependencies. Together, they form a systematic approach to how to normalize data with progressively tighter structural rules.

What happens if you don’t normalize data?

Unnormalized datasets accumulate duplicates and conflicting values over time, leading to reports that contradict each other. Applying how to normalize data prevents these problems and keeps analytical outputs trustworthy and consistent.

Wrap Up

Applying how to normalize data correctly separates analysis that misleads from analysis that guides decisions with genuine confidence.

Normalization eliminates the structural flaws responsible for conflicting figures, unreliable calculations, and dashboards that mirror data artifacts rather than real patterns in the underlying business.

The benefits accumulate steadily over time. Cleaner tables produce faster queries, reduce the hours spent troubleshooting inconsistencies, and give every stakeholder far greater confidence in the numbers they see.

Whether the work happens in Power BI or any other platform, the principles covered here provide a repeatable framework for building datasets that perform reliably at scale and hold up under scrutiny.


How much did you enjoy this article?

GSAd1
Start Free Trial!
161136

Related articles

next previous
Data Analytics9 min read

Investment Performance Reporting: Insights for Better ROI

Investment performance reporting turns raw data into portfolio insights. Learn key metrics, report types, and analysis methods. Read on!

Data Analytics10 min read

Pay Equity Analysis: Smart Ways to Analyze Pay Gaps

Pay equity analysis uncovers hidden salary gaps. Learn how to measure compensation fairness, close pay disparities, and build trust. Read on!

Data Analytics10 min read

What Are Sales KPIs: Sales Metrics Made Easy

What are sales KPIs, and why should every business track them? Learn the top indicators, how to measure them, and improve results. Read on!

Data Analytics10 min read

Calculating Revenue Growth for Better Growth Analysis

Calculating revenue growth reveals where your business stands. Learn the formula, types, and steps to track performance accurately. Read on!

Data Analytics9 min read

Consulting Report Template: A Complete Guide

Consulting Report Template: structure insights, drive decisions, and deliver standout results. Discover how to build better reports now!

ChartExpo logo

Turn Data into Visual
Stories

CHARTEXPO

  • Home
  • Gallery
  • Videos
  • Services
  • Pricing
  • Contact us
  • FAQs
  • Privacy policy
  • Terms of Service
  • Sitemap

TOOLS

  • ChartExpo for Google Sheets
  • ChartExpo for Microsoft Excel
  • Power BI Custom Visuals by ChartExpo
  • Word Cloud

CATEGORIES

  • Bar Charts
  • Circle Graphs
  • Column Charts
  • Combo Charts
  • Comparison Charts
  • Line Graphs
  • PPC Charts
  • Sentiment Analysis Charts
  • Survey Charts

TOP CHARTS

  • Sankey Diagram
  • Likert Scale Chart
  • Comparison Bar Chart
  • Pareto Chart
  • Funnel Chart
  • Gauge Chart
  • Radar Chart
  • Radial Bar Chart
  • Sunburst Chart
  • see more
  • Scatter Plot Chart
  • CSAT Survey Bar Chart
  • CSAT Survey Chart
  • Dot Plot Chart
  • Double Bar Graph
  • Matrix Chart
  • Multi Axis Line Chart
  • Overlapping Bar Chart
  • Control Chart
  • Slope Chart
  • Clustered Bar Chart
  • Clustered Column Chart
  • Box and Whisker Plot
  • Tornado Chart
  • Waterfall Chart
  • Word Cloud
  • see less

RESOURCES

  • Blog
  • Resources
  • YouTube
SIGN UP FOR UPDATES

We wouldn't dream of spamming you or selling your info.

© 2026 ChartExpo, all rights reserved.